Quim. Nova, Vol. 35, No. 4, 814-817, 2012
N
o
ta
T
é
c
ni
c
a
*e-mail: [email protected]
CHLOROPHENOLS IN TAP WATER FROM WELLS AND SURFACE SOURCES IN RIO DE JANEIRO, BRAZIL - METHOD VALIDATION AND ANALYSIS
André Victor Sartori*
Instituto Nacional de Controle de Qualidade em Saúde, Fundação Oswaldo Cruz, Av. Brasil, 4365, 21040-900 Rio de Janeiro – RJ, Brasil
Thomas Manfred Krauss, Ana Maria Cheble Bahia Braga e Aida Gomes de Almeida Yamazaki
Centro de Estudos da Saúde do Trabalhador e Ecologia Humana, Escola Nacional de Saúde Pública, Fundação Oswaldo Cruz, Rua Leopoldo Bulhões, 1480, 21041-210 Rio de Janeiro – RJ, Brasil
Rosália Maria de Oliveira
Departamento de Saneamento e Saúde Ambiental, Escola Nacional de Saúde Pública, Fundação Oswaldo Cruz, Rua Leopoldo Bulhões, 1480, 21041-210 Rio de Janeiro – RJ, Brasil
Recebido em 18/7/11; aceito em 24/10/11; publicado na web em 4/1/12
Two analytical methods were validated for determination of trichlorophenols, tetrachlorophenols and pentachlorophenol in drinking water. Limits of quantification were at least ten times lower than maximum permissible levels set by the Brazilian legislation, which are 200 ng mL-1 for 2,4,6-trichlorophenol and 9 ng mL-1 for pentachlorophenol. Chlorophenol levels were determined in tap water collected in the Municipality of Rio de Janeiro. 2,4,6-Trichlorophenol residues were detected in 36% of the samples, varying from 0.008 to 0.238 ng mL-1. All other analytes were below the limit of quantification. The validated methods showed to be suitable for application in routine quality control.
Keywords: chlorophenols; drinking water; method validation.
INTRODUCTION
A wide range of chemical substances and pathogens can be in-troduced into the water bodies, mainly by anthropogenic activities. The continuous ingestion of contaminated water can cause serious health problems for the exposed population. Therefore, quality con-trol of drinking water is an important health surveillance issue for guaranteeing safe water for consumers.
Water monitoring has become one of the most important stakehol-der strategies to protect consumers’ health and many countries have defined priority pollutants and their maximum tolerable levels. In Brazil, drinking water quality is regulated by Ministry of Health Regulation no. 518/2004.1 The regulation defines the compounds to be analyzed, the maximum permissible levels, and sampling frequency, besides other relevant issues.
One group of priority pollutants in water consists of the chlo-rophenols (CPs) due to their high solubility in water, persistency, and toxicological properties. Some CPs are carcinogens and their presence in water can also generate organoleptic effects. CPs can be introduced into the environment from various sources such as wood preservatives, pesticides, and degradation of other compounds.2 Moreover, drinking water disinfection with active chlorine can also form some chlorophenols when phenolic compounds are already pre-sent in raw water.3 Importantly, most water treatment plants in Brazil are not equipped with activated carbon and/or membrane filters, and therefore elimination of possible chemical residues is less efficient.4
Many analytical methods for the determination of CPs have been reported, mainly using gas chromatography (GC) in combination with mass spectrometry detection (MS)5-7 or with electron capture detec-tion.8-10 CP analysis by GC requires derivatization, because injection of free chlorophenols results in broad and tailed peaks, hindering the chromatographic resolution.11
The objective of this study was to validate a method to be imple-mented in the national laboratory network in order to support gover-nment surveillance in water quality control related to chlorophenols. The method should be effective in complying with the maximum limits for 2,4,6-trichlorophenol and pentachlorophenol set by Regulation no. 518/2004, which are 200 and 9 ng mL-1, respectively.1 Additionally, all other trichlorophenol isomers and all tetrachlorophenol isomers were included since they can be part of fungicide formulations and result in higher incidence of cancer when present in drinking water.12
To achieve this goal, two methods for CP analysis were validated for tap water based on classic liquid-liquid extraction with previous in situ acetylation. The methods’ effectiveness was subsequently proven by analyses of tap water collected in the Municipality of Rio de Janeiro (RJ), Brazil.
EXPERIMENTAL
Materials and methods
Chlorophenols in tap water from wells and surface sources in Rio de Janeiro 815
Vol. 35, No. 4
Preparation of standards
Individual stock solutions were prepared in methanol at a concen-tration of 4 mg mL-1. Working solutions were prepared in methanol by mixture and appropriate dilution of aliquots from individual stock solutions. The acetylation procedure of the standards for calibration purposes was based on the method described in the literature13 and performed in triplicate for each concentration level. The analytes and the internal standard (IS) dissolved in methanol were added to a mixture of 2 mL of a 5% K2CO3 solution and 2 mL of n-hexane containing 200 µL acetic anhydride. Hexane is the top layer and can
be easily removed with a micropipette from a test tube. The mixture was shaken for 1 min and the organic phase separated. The aqueous phase was then extracted again with 1 mL of n-hexane. Both hexane phases were combined, dried with anhydrous sodium sulfate, and injected into the chromatographic system. The calibration curves were constructed plotting the peak area ratio (analyte/IS) against the respective concentration.
Gas chromatography - mass spectrometry analysis
Instrumental analysis was conducted on an Agilent Technologies 6890N Series gas chromatograph coupled to an Agilent Technologies 5973N mass selective detector. The chromatograph was equipped with a split/splitless injector operating in splitless mode at 250 °C. Injection volume was 2 µL. Chromatographic separation was perfor-med on a DB-5ms fused-silica capillary column (60 m length, 0.25 mm i.d., 0.25 µm film thickness; J&W Scientific, Folsom/USA).
Helium (99.999% purity) was employed as carrier gas and adjusted to a constant flow rate of 1mL min-1. The GC oven was programmed at an initial temperature of 60 °C held for 1 min followed by heating to 140 °C at 30 °C min-1, then raised to 170 °C at 4 °C min-1 and finally increased to 280 °C at 40 °C min-1 held for 5 min. The GC/ MS transfer line was kept at 280 °C and ionization was performed by electron impact (70 eV). The MS was operated in selected ion monitoring mode monitoring two ions for each analyte group; m/z 196/198 for TriCPs, m/z 230/232 for TeCPs, m/z 266/268 for PCP and m/z 330/332 for TriBrP. Since all analyte groups separated well, each ion pair was monitored in a single time window. A compound was considered identified when ion ratio was in the range of ± 15% of the theoretical ion ratio and absolute retention time was in the range of ± 10 s of the absolute retention time determined during calibration with standard compounds.
Sample treatment
Two methods were validated using sample volumes of 200 mL (method A) and 10 mL (method B), considering one as sensitive and the other as a quick method. Derivatization and extraction of the method A were performed in a separatory funnel. After adjusting to a pH of 11 with anhydrous potassium carbonate, the sample was spiked with internal standard. Then acetic anhydride (5 mL L-1) was added and the funnel shaken vigorously until the evolution of carbon dioxide ceased. The chlorophenol derivates were extracted twice with 15 mL of dichloromethane. The combined organic phases were spiked with 1 mL of iso-octane as keeper, concentrated to 1 mL in a rotatory evaporator (28 °C, 500 mmHg and 100 rpm) and dried over anhydrous sodium sulfate. Dichloromethane was chosen as extraction solvent for this method because of better handling (bottom layer) and better recoveries for trichlorophenols (evaporation step) in comparison with n-hexane.
The method B was performed in test tubes adding 0.4 mL of acetic anhydride and internal standard to the sample after adjusting it to a
pH of 11. Extraction was performed twice with 1.5 mL of n-hexane. The combined n-hexane extracts were dried over anhydrous sodium sulfate and then analyzed.
Tap water analysis
In October and November 2006, tap water samples were collected mainly at public buildings such as schools and hospitals, but also at private households in the municipality of Rio de Janeiro. Of the 25 selected locations, three locations were sampled twice, resulting in 28 samples. In the municipality of Rio de Janeiro, water is supplied from two different sources, namely water treatment plants with surface water as input and local wells, also referred to as alternative solutions. In both cases, disinfection is achieved through chlorination. The samples originated from Guandu water treatment plant were col-lected at the urban districts of Flamengo, Copacabana, Santa Teresa, Manguinhos, Recreio dos Bandeirantes, Barra da Tijuca, Jacarepaguá and Usina (15 samples). The samples originated from Ciganos water treatment plant were collected at the urban district of Freguesia (1 sample). All other samples originated from water treatment plants, namely Afonso Viseu (3 samples), Dois Murinhos (2 samples), Taylor (1 sample) and Gávea Pequena (1 sample), were collected at the urban district of Alto da Boa Vista. The five samples originated from the alternative solutions were collected also at the urban district of Alto da Boa Vista. The high sample number for Guandu was due to the fact that this treatment plant supplies drinking water to approximately 96% of the population in Rio de Janeiro.
Samples were collected in 1000 mL amber bottles with previously added sodium thiosulfate to avoid oxidation of the analytes.14 Samples were stored in a refrigerator at about 4 °C and analyzed within 7 days post-sampling.
Method validation
Single laboratory validation was performed by determination of the following performance parameters for the two methods: selecti-vity, linearity, precision, trueness, limit of detection (LOD), and limit of quantification (LOQ). Selectivity was evaluated by chromatogram comparison of matrix blanks and standard solutions. Linearity was tested in triplicate on six calibration levels for each analyte, also evaluating the calibration residues and significance of the linear regression. Precision (repeatability) and trueness (recovery) were de-termined through analysis of spiked tap water. Four replicates at four concentration levels were analyzed for method A and three replicates at six concentration levels for method B. A matrix blank spiked with the standard mixture was used to calculate limit of detection (LOD) and limit of quantification (LOQ), considering signal-to-noise ratios of 3 and 10, respectively.
RESULTS AND DISCUSSION
Validation
Sartori et al.
816 Quim. Nova
constant variability of calibration residues over the entire concentra-tion range. Linear regression significance was assessed by analysis of variance (ANOVA) at 95% confidence level. The significant F-values were less than the critical F-value for all evaluated compounds, thus attesting the linear regression significance.
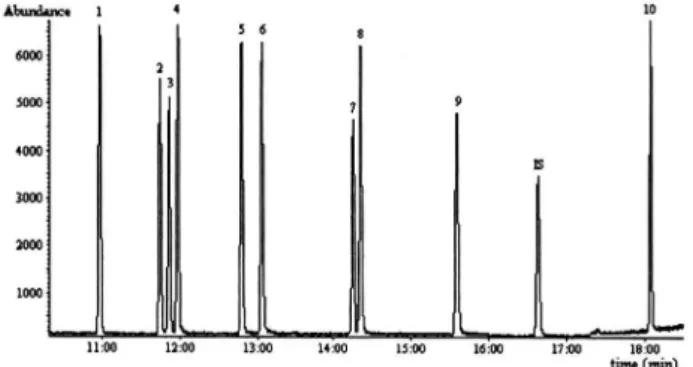
Figure 1 shows the method’s selectivity. The chromatogram shows that all chlorophenols were well separated, and possible interferences caused by the matrix were absent.
The recovery values for both methods met the range established by the European Commission.17 During the first tests, method A showed lower recoveries, principally for the trichlorophenols, but after the introduction of iso-octane as keeper before the evaporation step the recoveries remained in the range of 79 to 94%. Recovery for method B varied from 95 to 99%. Figure 2 shows the recovery values for individual chlorophenols.
As the criterion for precision evaluation, the accepted maximum coefficients of variation (CV %) depends on the studied concentration range, and values up to 20% are normally approved for trace analysis methods.18 The CV obtained from repeatability studies showed good precision for both methods (Figure 3). The CVs for the methods A and B were below 15 and 3.5%, respectively.
The Brazilian potability standard for drinking water determines the maximum permissible levels for 2,4,6-TCP and PCP, namely 200 and 9 ng mL-1, respectively.1 Both methods showed LOQs for these two chlorophenols well below the established limits (Table 1). The recoveries and the LOD/LOQ of the two methods were
compared with the solid-phase extraction (SPE) reported in the literature.13 Instrumental analysis was done by gas chromatography with plasma atomic detection. Water extraction volume was 2 L and extraction solvent consumption was the same as for the validated method B. The recoveries (83-93.7%) were similar in comparison to the validated method A, but slightly lower compared to the vali-dated method B. The LOQs (0.05 to 0.08 ng mL-1) were about ten times higher and 5 times lower than those of the methods A and B, respectively. Another study using solvent microextraction of a 1 mL sample with 2-3 µL of butyl acetate reported only relative recoveries of about 70% comparing peak areas of HPLC-grade water and river water extracts.5 The LOD for phenol, mono-, di-, tri- e tetrachloro-phenols varied from 0.005 to 0.022 ng mL-1.
Figure 2. Recovery values for the validated methods
Figure 3. Coefficients of variation (CV %) for the validated methods
Figure 1. Total ion chromatogram of chlorophenols in spiked laboratory tap water; (1) 246-TriCP, (2) 236-TriCP, (3) 235-TriCP, (4) 245-TriCP, (5) 234-TriCP, (6) 345-TriCP, (7) 2356-TeCP, (8) 2346-TeCP, (9) 2345-TeCP, (10) PCP, (IS) 246-TriBrP
Table 1. Detection and quantification limits of the validated methods
Compounds Method A Method B
LOD (ng mL-1) LOQ (ng mL-1) LOD (ng mL-1) LOQ (ng mL-1)
246-TriCP 0.002 0.008 0.145 0.483
236-TriCP 0.002 0.006 0.104 0.348
235-TriCP 0.002 0.007 0.128 0.427
245-TriCP 0.002 0.006 0.112 0.374
234-TriCP 0.002 0.007 0.123 0.409
345-TriCP 0.002 0.008 0.149 0.497
2356-TeCP 0.002 0.010 0.185 0.617
2346-TeCP 0.003 0. 010 0.186 0.618
2345-TeCP 0.003 0.010 0.184 0.613
Chlorophenols in tap water from wells and surface sources in Rio de Janeiro 817
Vol. 35, No. 4
Tap water analysis
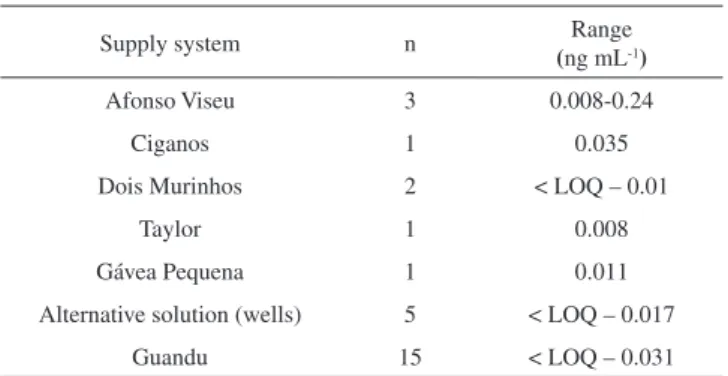
The validated method A was applied in duplicate for analysis of tap water. Besides 246-TriCP, all investigated chlorophenols were below the limit of detection. The concentration ranges of 246-TriCP for the different water supply systems are listed in Table 2.
Of the 28 analyzed samples, 11 (39%) showed 246-TriCP concen-trations above the limit of quantification. The highest concentration was found in the Afonso Viseu system. Only three samples collected from the Guandu system and one sample from the alternative solutions showed levels above LOQ. In Brazil, drinking water is pumped into a closed container located on the roof of the buildings before entering the household or establishment. The variations of results in samples taken from the same system at the same day can be explained by the degradation of 246-TriCP caused by the presence of still active chlorine and/or evaporation through sun irradiation depending on time of permanence in the container before use.
Three locations were sampled twice within seven days in order to verify potential differences in concentrations, since variation in the amount of organic matter in raw water can influence the formation of 246-TriCP caused by chlorination In one case there was no difference (both values were < LOQ), and in the other two cases similar values were found, which were 0.030/0.013 ng mL-1 and < LOQ/0.016 ng mL-1. The absence of rainfall during the sampling period can explain these results, since precipitation can increase the organic matter in raw water.19,20
However, according to the Brazilian potability standard, all the tested samples were adequate for consumption regarding 246-TriCP and PCP concentrations. Generally, the results for 246-TriCP in drinking water can also be considered low compared to results publi-shed in the scientific literature. Maximum 246-TriCP concentrations of 1.10 ng mL-1 was found in a study conducted in the USA and of 0.719 ng mL-1 in a investigation realized in 40 potable water treat-ment plants in Canada.19,21 In a current study realized in Poland, the highest 246-TriCP level was 0.89 ng mL-1.20 The highest 246-TriCP concentration (0.009 ng mL-1) determined in survey realized in Zagreb City/Republic of Croatia was similar to the concentrations found in the present work.22 No published data were available on CPs in drinking water in Brazil as a whole. In Brazil, the Central Public Health Laboratories (LACEN) are responsible for the analytical monitoring of drinking water. According to the last LACEN situation report published by the National Health Surveillance Agency, none of these laboratories had tested for chlorophenols in drinking water until the year 2004.23
CONCLUSION
All parameters associated with performance of the two methods were in accordance with those recommended or established by inter-national institutions. The validated methods are suitable for routine quality control of drinking water, due to its quick execution and low solvent and reagent consumption, especially method B.
The analysis of real tap water samples showed that the resulting chlorophenol levels posed no health risk for the population of the municipality of Rio de Janeiro at the time of sampling. However, in order to permanently protect the population, it is highly recommended to endorse routine analysis, since CP levels could increase during periods of heavy rainfall, which are common in Brazil.
REFERENCES
1. Brazil; Regulation nº 518, Ministry of Health: Official Diary of the
Union, Section 2, 266, Brasília on march 26th of 2004.
2. Amenate, P. M.; Kafkewtiz, D.; Lewandowski, G. A.; Jou, C. J.; Water Res. 1999, 33, 681.
3. Ahlborg, U. G.; Thunberg, T. M.; CRC Crit. Rev. Toxicol. 1980, 7, 1.
4. Menezes, C. T.; Heller, L.; Electronic Annals of the 23rd Brazilian
Congress for Sanitary and Environmental Engineering, Rio de Janeiro,
Brazil, 2005.
5. Bagheri, H.; Saber, A.; Mousavi, S. R.; J. Chromatogr., A2004, 1046,
27.
6. Quintana, M. C.; Ramos, L.; Trends Anal. Chem. 2008, 27, 418.
7. Kovács, Á.; Mörtl, M.; Kende, A.; Microchem. J. 2011, 99, 125. 8. Gaspar, I. F.; J. Braz. Chem. Soc.1997, 8, 515.
9. Bianchi, F.; Careri, M.; Mucchino, C.; Musci, M.; Chromatographia 2002, 55, 595.
10. Fattahi, N.; Assadi, Y.; Hosseini, M. R. M.; Jahromi, E. Z.; J. Chromatogr., A 2007, 1157, 23.
11. Martínez-Uruñela, A.; González-Sáiz, J. M.; Pizarro, C.; J. Chromatogr., A2004, 1048, 141.
12. Lampi, P.; Tuomisto, J.; Hakulinen, T.; Pukkala, E.; Scand. J. Work Environ. Health 2008, 34, 230.
13. Rodríguez, I.; Turnes, M. I.; Mejuto, M. C.; Cela, R.; J. Chromatogr., A 1996, 721, 297.
14. Rodriguez, I.; Cela, R.; Trends Anal. Chem. 1997, 16, 463. 15. Danzer, K.; Currie, L. A.; Pure Appl. Chem. 1998, 70, 993.
16. Thompson, M.; Ellison, S. L. R.; Wood, R.; Pure Appl. Chem. 2002, 74, 835.
17. European Commission - EC; Commission decision 2002/657/EC of 12 August 2002 - Implementing Council Directive 96/23/EC concerning performance of analytical methods and the interpretation of result.
Official Journal of the European Communities, L 221/8, Brussels, 2002. 18. AOAC; Guidelines for single-laboratory validation of analytical
methods for trace-level concentrations of organic chemicals, AOAC:
Washington, 1999.
19. Sithole, B. B.; Williams, D. T.; J. Assoc. Off. Anal. Chem. 1986, 69. 20. Michalovicz, J.; Stufka-Olczyk, J.; Milczarek, A.; Michniewicz, M.;
Environ. Sci. Pollut. Res.2011, 18, 1174.
21. Nieminski, E. C.; Chaudhuri, S.; Lamoreaux, T.; J. Am. Water Works Assoc.1993, 85, 98.
22. Fingler, S.; Drevenkar, V.; Toxicol. Environ. Chem. 1988, 17, 319. 23. Agência Nacional de Vigilância Sanitária (ANVISA); Relatório
situacional dos LACEN 2005 (Ano–base 2004), ANVISA: Brasília,
2006.
Table 2. Concentration ranges of 246-TriCP for the different water supply
systems
Supply system n Range
(ng mL-1)
Afonso Viseu 3 0.008-0.24
Ciganos 1 0.035
Dois Murinhos 2 < LOQ – 0.01
Taylor 1 0.008
Gávea Pequena 1 0.011