Relationships between static foot alignment and dynamic
plantar loads in runners with acute and chronic stages of
plantar fasciitis: a cross-sectional study
Ana P. Ribeiro1,2, Isabel C. N. Sacco1, Roberto C. Dinato1,
Silvia M. A. João1
1 Departamento de Fisioterapia, Fonoaudiologia e Terapia Ocupacional, Faculdade de Medicina, Universidade de São Paulo (USP), São Paulo, SP, Brazil
2 Pós-Graduação em Ciências da Saúde, Departamento de Fisioterapia, Faculdade de Medicina, Universidade de Santo Amaro (Unisa), São Paulo, SP, Brazil
Received: Mar. 25, 2015 Revised: Aug. 10, 2015 Accepted: Sept. 29, 2015
ABSTRACT | Background:The risk factors for the development of plantar fasciitis (PF) have been associated with the medial longitudinal arch (MLA), rearfoot alignment and calcaneal overload. However, the relationships between the biomechanical variables have yet to be determined. Objective: The goal of this study was to investigate the relationships between the MLA, rearfoot alignment, and dynamic plantar loads in runners with unilateral PF in acute and chronic phases. Method: Cross-sectional study which thirty-ive runners with unilateral PF were evaluated: 20 in the acute phase
(with pain) and 15 with previous chronic PF (without pain). The MLA index and rearfoot alignment were calculated using digital images. The contact area, maximum force, peak pressure, and force-time integral over three plantar areas
were acquired with Pedar X insoles while running at 12 km/h, and the loading rates were calculated from the vertical
forces. Results: The multiple regression analyses indicated that both the force-time integral (R2=0.15 for acute phase PF; R2=0.17 for chronic PF) and maximum force (R2=0.35 for chronic PF) over the forefoot were predicted by an elevated
MLA index. The rearfoot valgus alignment predicted the maximum force over the rearfoot in both PF groups: acute (R2=0.18) and chronic (R2=0.45). The rearfoot valgus alignment also predicted higher loading rates in the PF groups: acute (R2=0.19) and chronic (R2=0.40). Conclusion: The MLA index and the rearfoot alignment were good predictors of plantar loads over the forefoot and rearfoot areas in runners with PF. However, rearfoot valgus was demonstrated to be an important clinical measure, since it was able to predict the maximum force and both loading rates over the rearfoot.
Keywords: plantar fasciitis; foot; plantar arch; physical therapy; overload; running.
BULLET POINTS
• Elevated arches predict higher forefoot pressures in runners with PF, regardless of its stage. • Rearfoot valgus alignment predicts higher rearfoot dynamic loads in runners with PF.
• Conservative interventions to control rearfoot alignment and support the plantar arch may improve the plantar load
distribution, independent of the PF stage.
HOW TO CITE THIS ARTICLE
Ribeiro AP, Sacco ICN, Dinato RC, João SMA. Relationships between static foot alignment and dynamic plantar loads in runners with acute and chronic stages of plantar fasciitis: a cross-sectional study. Braz J Phys Ther. 2016 Jan-Feb; 20(1):87-95. http://dx.doi.org/10.1590/bjpt-rbf.2014.0136
Introduction
Foot types and repetitive plantar loads have been commonly associated with lower limb injuries, especially running-related injuries1, such as medial tibial stress syndrome2, patellofemoral pain syndrome3, and plantar fasciitis (PF)4-6. Among them, PF is a musculoskeletal disorder characterized by pain at the plantar fascia insertion point7. PF is considered to be the third most prevalent injury in runners8-10. Despite its
focus of clinicians to prevent injuries in runners, helping them to choose the correct footwear and providing the appropriate interventions15. These are directed towards improving the synaptic tactile afferents from the fascia and the motor neurons supplying the leg muscles1,16.
Studies of runners with PF have shown that changes in the medial longitudinal arch (MLA) geometry (higher5,6 or lower4) and the presence of pain contribute to increasing plantar loads4,13. Di Caprio et al.5 described a higher arch as a great predictor of PF in runners, because an elevated MLA could induce greater stiffness of the plantar fascia, resulting in less lexible tissue5. This could result in the ineficient capacity to dissipate foot impact forces, with greater mechanical stress on the calcaneus17, interfering with the dynamic foot function18.
Elevated MLAs in healthy runners have been associated with higher vertical loading rates19,20 and peak pressures over the rearfoot while running20. However, some studies have reported a lack of association between static and dynamic elevated MLAs and the loading rates or peak pressures during running21,22. Recently, the combination of MLAs and rearfoot eversion angles were described as good predictors of the pressure-time integral over the rearfoot and midfoot in healthy runners23. The increased rearfoot pronation associated with a lower MLA could also result in greater plantar loads over the calcaneal medial area24-27, which, in turn, induces greater stretch in the plantar fascia10,17. A valgus alignment of the calcaneus or pronated foot posture signiicantly increases the likelihood of generalized foot pain18.
The microtrauma and microtearing potentially caused by an elevated MLA and a valgus rearfoot are the primary mechanisms of PF, resulting in the inlammation characteristic of the acute phase28,29. The progression of PF can lead to a symptom remission phase, with the evolution of fragmentation and degeneration of the plantar fascia, characterizing the chronic phase29,30. Previous gait studies in individuals with PF determined that the pain stimulus promoted changes in foot roll-over patterns, thus causing load reductions in the rearfoot and load increases in the midfoot31, forefoot32, and toes32,33, possibly due to the protective mechanisms of pain. A deep comprehension of the changes in plantar pressure associated with static foot posture may provide useful information for the prescription or design of interventions, such as orthotics or motion-control shoes for runners with PF.
The purpose of this study was to investigate the relationships between the MLA index and rearfoot
alignment with plantar loads in runners with PF in the acute and chronic phases. We hypothesized that (1) an elevated MLA will predict lower plantar loads over the rearfoot in runners with acute PF, due to an antalgic mechanism, and higher loads in runners with chronic PF; and (2) a valgus rearfoot alignment would predict higher plantar loads and loading rates over the rearfoot in both groups of runners.
Method
Participants
This cross-sectional study examines the relationship between PF and foot alignment. For this, thirty-ive runners of both sexes with diagnoses of unilateral PF were recruited from the Rehabilitation Center of Sport Rheumatology at Hospital Universitário de São Paulo, Brazil. The mean running speed of their last 10 km competition was 11.5±0.4 km/h. The inclusion criteria were: runners must have run at least 20 km weekly for at least one year, be experienced in long-distance competitions, have a regular rearfoot strike pattern, and have a diagnosis of unilateral PF conirmed by a clinical examination. The exclusion criteria were a history of previous surgery in the lower limbs, traumas or fractures of the lower limbs in the previous six months, leg length discrepancies, or other musculoskeletal disorders such as neuropathies, rheumatoid arthritis, or calcaneal spurs. This protocol was approved by the Human Research Ethics Committee of the School of Medicine of Universidade de São Paulo (USP), São Paulo, SP, Brazil (number: 384/10; title: Support standard and impact of the feet with the ground during the running of runners with history and symptoms of plantar fasciitis and its relationship to the medial longitudinal arch). All participants provided written consent.
Fifteen runners had previous chronic stages of PF with a mean time since the irst diagnosis of 1.5±3.0 years and cycles of remission within the period between the diagnosis and the biomechanical evaluation. In this group, we only included runners with unilateral PF who showed plantar fascial thickness, fragmentation, and degeneration in the ultrasound, but no signs of acute inlammatory processes or pain complaints over the previous two months30.
Both groups (acute and chronic) demonstrated similar anthropometric characteristics and running practices (Table 1). In addition, all of the runners with PF were asked about any interventions previously used to treat this injury. The most frequent clinical interventions described by the runners were: physical therapy combined with medication (38%); insoles (27%);
medication alone (21%); and other interventions such as acupuncture and manual therapy (14%).
Static measurements of the structures of the ankle and foot
Assessment of the frontal alignment of the rearfoot (calcaneal tendon)
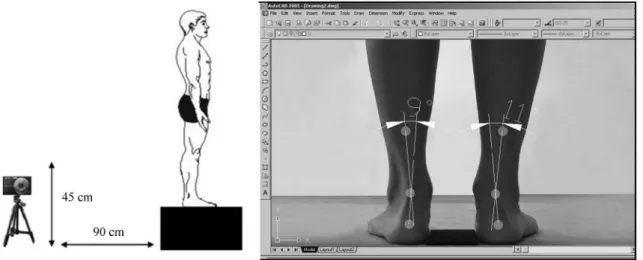
To evaluate the alignment of the rearfoot in the posterior view of the frontal plane, the runners stood over a 45 cm platform, keeping their feet 7.5 cm apart. With a dermatographic pen and 9 mm white markers, the following anatomical points were identiied on the inferoposterior regions of both legs: 1) the posterior calcaneal tuberosity; 2) the second point above the center of the calcaneus; and 3) the lower third of the leg13,34,35 (Figure 1). The center of each marker in the
Figure 1. Position of individual and digital camera to capture digital image of rearfoot angle and measurement of the frontal alignment
of the rearfoot in AutoCAD software.
Table 1. Descriptive statistics (mean ± standard deviation) and comparisons between acute plantar fasciitis (FP) and chronic plantar fasciitis (PF) regarding their demographic, anthropometric, and running practice characteristics.
Variables Acute PF(n=20) Sex (Acute PF)(n=13 M; 7 F) Chronic PF(n=15) Sex (Chronic PF)(n=10 M; 5 F) p*
Age (years) 42.8±9.3 M (46.1±8.3)
F (44.5±9.0) 38.3±7.3 M (37.8±6.5)F (34.6±4.3) 0.126
Body mass (Kg) 70.1±14.5 M (77.1±8.8)
F (59.2±9.5) 72.3±10.0 M (75.4±8.3)F (60.0±9.8) 0.641
Height (m) 1.70±9.9 M (1.74±4.7)
F (158.7±6.1) 1.76±7.8 M (1.79±5.7)F (1.6±3.6) 0.224
Body mass index
(Kg/m2) 24.6±2.7 M (25.3±1.8)F (23.4±1.9) 23.0±2.0 M (23.3±1.8)F (22.3±2.2) 0.090
Training volume
(km/week) 41.0±9.0 M (42.8±7.7)F (40.1±4.6) 45.0±10.0 M (46.4±8.1)F (40.0±3.4) 0.147
Practice time (years) 8.0±5.5 M (9.7±7.0)
F (5.5±1.7) 6.2±5.0 M (7.2±6.1)F (6.0±1.4) 0.382
Acronym: M for male; F for female; PF: Plantar Fasciitis. *Calculated by ANOVAs one-way between groups (Acute and Chronic of PF),
medial-lateral axis was obtained with a digital caliper that was used to measure the distances between the two symmetrically opposing sides with a ruler13. The images were then obtained with a digital camera positioned anterior and perpendicular to the subjects at a distance of 90 cm and at a height of 45 cm. The images obtained (with a minimum size of 768 pixels) were analyzed on a 96-ppi screen, due the good inter-examiner reliability for the photogrammetric measurements of the rearfoot static angles35 (Figure 1).
AutoCAD software 2005 was used to quantify the
alignment of the rearfoot. For this, a line was drawn from the irst marker (posterior calcaneal tuberosity) to the second marker (calcaneal center). A second straight line was then drawn, which originated from the lower third of the leg marker and passed through the second marker (calcaneal center)13,35 (Figure 1). The intersection of the extensions of both straight lines resulted in angles, which were classiied as normal foot (0° to 5°), varus (< 0°), or valgus (> 5°)34.
Assessment of the medial longitudinal arch (MLA)
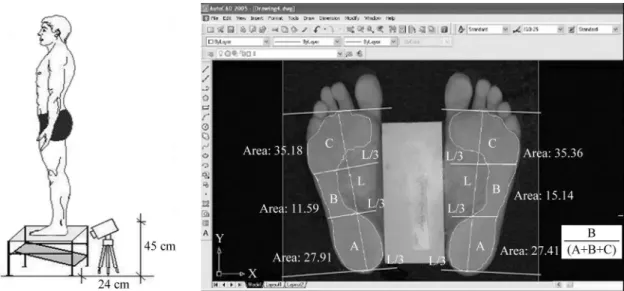
The footprint was acquired using a Carci podoscope. For the barefoot assessments, the subjects were positioned on the podoscope with 7.5 cm of ethylene vinyl acetate (EVA) placed between the feet. The footprint image was obtained with a digital camera, which was placed in front of the podoscope at a distance of 24 cm and a height of 45 cm (Figure 2). The EVA measurement was taken as a reference for the AutoCAD software 2005 image scale. In AutoCAD, a vertical line (L)
was drawn from the second metatarsus to the center of the calcaneus. Then, the L line was divided into three parts for the delineation of the forefoot, midfoot, and rearfoot areas13,34.
To classify the MLA, the Arch Index36 was calculated in the footprint image corresponding to the foot injured by PF. This index is the result of the ratio between the midfoot area and the total area of the foot (Figure 2). Index values between 0.22 and 0.25 correspond to a normal MLA, values smaller than 0.21 correspond to a cavus MLA, and values greater than 0.26 were classiied a planus MLA. Footprint analyses via digital imaging were chosen because of the advantages of having the reliability and validity previously conirmed37,38.
Procedures and instruments for the assessment of plantar loads while running
The plantar pressure distribution while running was obtained using the Pedar X system (Novel, Munich, Germany) at 100 Hz. All of the runners wore standard athletic shoes, which were considered to have neutral support (RAINHA SYSTEM, RAINHA, Alpargatas, São Paulo, Brazil). The shoe characteristics included a midsole made up of ethylene vinyl acetate (EVA, with compression set at 56%, hardness: 57 Asker C, and density = 0.21 g/cm3) throughout the entire sole of the shoe. The insoles were placed between the socks and the shoe, and were connected to equipment inside a backpack (about 1.5 Kg).
After a period of adaptation with the shoes, insoles, and backpack, the runners ran a distance of 40 meters on
Figure 2. Image obtained by podoscope (A) and illustration of the areas of the feet to calculate the longitudinal plantar arch index (MLA),
a smooth and regular asphalt track in good conditions at 12 km/h. The speed of the intermediate 20 meters of the track was controlled by two evaluators using a digital chronometer6. Two observers used a digital stopwatch to control the speed simultaneously, and the inter-examiner reliability of the speed measurements was calculated using Intra-Class Correlation Coeficients (ICCs). The inter-examiner reliability was excellent (ICC2,1=0.96; 95% CI=0.88–0.73), with a standard error of prediction of 0.04.
A mean value of 30 steps per subject was used for statistical purposes, and the variables were calculated using a MATLAB function: contact area (cm), maximum force (N), force-time integral (N.s), and peak pressure (kPa) over the three plantar areas of the rearfoot (30% of the foot length), midfoot (30% of the foot length), and forefoot and toes (40% of the foot length)6. Two plantar loading rates were calculated from the vertical force: 1) loading rate of 80% [BW.s–1], deined as the force rate between 20 and 80% of the irst peak, and 2) loading rate of 100% [BW.s–1], as determined by the force rate between 0 and 100% of the irst peak. All of the force variables were normalized by the body weight (BW).
Statistical analysis
The sample size calculation of the 35 runners with unilateral plantar fasciitis, based upon the maximal force variable, was carried out using G-Power 3.0 software, considering a moderate effect size (F=0.25),
a statistical power of 80%, and a signiicance level of 5%. Since all of the outcome variables showed normal distributions (Shapiro-Wilk’s test), ANOVAs followed by Tukey’s post-hoc tests were used to compare the groups.
To verify our hypothesis that the MLA and rearfoot alignment variables could predict the plantar loads on the foot, we irst checked the correlations between these biomechanical variables. Pearson’s correlation coefficients were calculated to investigate the relationships between the MLA index and rearfoot alignment and the 20 dependent biomechanical variables: 18 plantar pressure variables over the rearfoot, midfoot, and forefoot (maximum force, force-time integral, maximum mean pressure, peak pressure, pressure-time integral, and contact area), and two loading rates (20 to 80% and 0 to 100% of the irst peak [BW.s–1]).
Forward step-wise multiple regression analyses were used to predict the biomechanical dependent variables (plantar pressure and loading rates) via the MLA index
and rearfoot alignment. The biomechanical dependent variables were sequentially included in the model in three consecutive blocks: variables of contact area, force, and pressure. The 20 biomechanical variables were reduced, and only those whose correlation coeficients were higher than 0.20 were entered into the model. For all of the analyses, we adopted p<0.05.
The Pearson correlation analyses between the 20 dependent variables and the MLA index and rearfoot alignment resulted in 11 variables of interest for the regression analyses. The force-time integral, maximum force, and contact area over the rearfoot, midfoot, and forefoot, as well as the loading rates (20 to 80% and 0 to 100%), were included in the model. Nine variables were removed from the model due to low correlation coeficients (r<0.20): maximum mean pressure, peak pressure, and pressure-time integral over the foot areas.
To analyze the intra-rater reliability of the MLA index and rearfoot alignment, the measurements were obtained by the same examiner in two evaluation moments, with a one-week interval, and the intraclass correlation coeficients (ICC3,1) were calculated. To investigate the inter-rater reliability, ICC2,1 were calculated using the data collected during the irst week by two independent examiners39. The intra- and inter-rater reliability analyses for the anatomical marker data were performed only by the irst examiner, following previously recommended procedures37,38. Both evaluations were performed for both of the PF groups, without separating the phase of the injury.
In order to determine the systematic error of the MLA and rearfoot angle measurements for each examiner (intra- and inter-examiner reliability), the standard error of measurement (SEM) and standard error of prediction (SEP) were calculated. The intra-examiner reliability SEM was calculated as the ratio between the variability (standard deviation, SD) of the mean difference scores between the two repeated measurements, and the √2. The inter-examiner reliability SEP was calculated as: the product of the variability (SD) of the measurements obtained by each examiner and the √1-ICC235,39.
Results
6.4±4.5 and 7.8±3.4 for the acute and chronic PF groups, respectively.
In the inal regression model, the MLA index predicted a higher force-time integral over the forefoot for both PF groups and a higher maximum force over the forefoot in the chronic PF group (Table 2). However, the MLA index could not predict any loading rate variables for either PF group. The rearfoot valgus alignment predicted a higher maximum force over the rearfoot for both PF groups, in addition to predicting higher loading rates (20-80% and 0-100%) and higher force-time integrals over the rearfoot in the chronic PF group (Table 2).
High intra-examiner (pre: 0.178±0.09 cm; post: 0.177±0.08 cm; SEM=0.10; ICC=0.92; 95% CI=0.84-0.78) and inter-examiner (examiner 1: 0.178±0.09 cm, SEP=0.02; examiner 2: 0.186±0.05 cm, SEP=0.01; ICC=0.90 95% CI=0.89-0.80) reliability levels were found for the MLA index. The rearfoot alignment reliability levels were also high for the intra-examiner (pre: 6.7±2.3 degrees; post: 6.5±2.7 degrees; SEM=0.7; ICC=0.95; 95%CI=0.87-0.78) and inter-examiner (examiner 1: 6.7±2.3 degrees, SEP=0.7; examiner 2: 6.3±2.9 degrees, SEP=0.9; ICC=0.90; 95% CI=0.83-0.77) measurements.
Discussion
To the best of our knowledge, this is the irst study to investigate the relationship between static foot alignment and plantar pressure patterns in runners
with different stages of PF, as main risk factors for PF23,26. In contrast to what we hypothesized, an elevated MLA predicted higher plantar loads (higher force-time integral) over the forefoot while running in both PF groups and a higher maximum force over the forefoot in chronic PF (not only in runners with acute PF). This last inding suggests that higher loads over the forefoot, particularly during the propulsion of running, are strongly associated with elevated MLAs in runners with PF. This combination of the arch structure and loading pattern could indirectly result in higher tension in the plantar fascia around the metatarsal heads40, contributing to the progression of PF, regardless of its phase. Another important result allowed us to conirm our second hypothesis, which states that static valgus rearfoot alignment predicts higher plantar loads (higher maximum force and force-time integral) and higher loading rates (20-80% and 0-100%) over the rearfoot in both groups of PF.
During gait, some authors observed positive correlations between elevated MLAs and higher forefoot impulses41, and between elevated MLAs with foot pain symptoms and higher pressure-time integrals over the forefoot42. Although the present study evaluated the relationship between the foot posture and pressure while running, our results are similar to the gait indings41,42, demonstrating the predictive association between an elevated MLA and increased plantar load over the forefoot. One possible explanation for the positive relationship between an elevated MLA and higher maximum force over the forefoot
Table 2. The multiple regression models of the longitudinal plantar arch index (MLA) and rearfoot valgus alignment (REARFOOT) to predict the biomechanical dependent variables of runners with plantar fasciitis (PF): acute and chronic.
Variables Group CoeficientBeta Standard
deviation t p
& Equation* R, R2
Force-Time Integral (N.s) (FTIF)
Acute PF 0.350 0.16 3.0 0.031 FTIF=0.211+0.350*MLA r=0.35; R2=0.15
Chronic PF 0.165 0.12 3.2 0.020 FTIF=6.096+0.165*MLA r=0.41; R2=0.17
Maximal Force
forefoot (N) (MFF) Chronic PF 1.850 0.81 2.2 0.043 MFF=1.580+1.850*MLA r=0.59; R2=0.35
Maximal Force
rearfoot (N) (MFR)
Acute PF 2.012 0.17 2.8 0.048 MFR=1.400+2.012*REARFOOT r=0.42; R2=0.18
Chronic PF 0.056 0.02 2.7 0.017 MFR=2.140+0.056*REARFOOT r=0.67; R2=0.45
Force-Time Integral
rearfoot (N.s) (FTIR) Chronic PF 0.103 0.12 3.8 0.041 FTIR=2.840+0.103*REARFOOT r=0.41; R2=0.17 Loading rate 20-80%
(BW.s–1) Chronic PF 0.278 0.01 1.6 0.013
Loading rate (20-80%)
=0.645+0.278*REARFOOT r=0.44, R2=0.19
Loading rate 0-100%
(BW.s–1) Chronic PF 1.238 0.14 1.8 0.012
Loading rate (0-100%)
=7.54+1.238*REARFOOT r=0.63, R2=0.40
Acronyms: PF: Plantar Fasciitis; MLA: Medial Longitudinal Arch; REARFOOT: rearfoot valgus alignment; FTIF: Force-Time Integral; MFF: Maximal Force Forefoot; MFR: Maximal Force Rearfoot; FTIR: Force-Time Integral Rearfoot. & p-value of the multiple regression analyses. *Equations of the
in the group with chronic PF may be attributed to the foot’s passive tissue and muscle changes30,31, such as reduced thickness of the plantar fascia and atrophy of the intrinsic musculature43, which, in turn, would affect the function of the MLA while running. In this study, the altered function resulted in reduced loads over the rearfoot and higher loads over the forefoot.
Other studies have reported positive correlations between elevated MLAs and higher loading rates, measured by force plates in healthy individuals while running32,33. Contrarily, Ramskov et al.44 observed that the static foot posture, quantiied by the Foot Posture Index, did not seem to affect the risk of injury among novice runners. However, these results should be interpreted with caution due to the small sample size. The advantage of our study was to prove that static foot alignment (elevated MLA) in runners with PF, a more prevalent injury in runners8,9, predicted a higher plantar load over the forefoot while running, depending on the stage of PF (acute or chronic). However, the absence of a control group is one limitation of the present study.
One important inding was the non-conirmed relationship between an elevated MLA and higher plantar loads, or loading rates, while running, over the rearfoot in runners with PF (acute and chronic phases), since the rearfoot area is the region most associated with the physiopathology and etiology of PF7. A possible explanation for this inding is that runners in the acute phase of PF, with inlammation present in the calcaneal region, may have increased thickness of the plantar fascia (perifascial and cellular luid collection), resulting in the reduced capacity of this tissue to support mechanical loads over the rearfoot area23,45. The consequence of this reduced capacity of the attenuating loads in the plantar fascia can lead to the adoption of an antalgic strategy to reduce the plantar load over the rearfoot, resulting in an increase in the plantar load over the forefoot. These results were also observed in studies that evaluated the gait task7,33. In addition, Sullivan et al.46 showed that people with heel pain had reduced maximum force, peak pressures, and force–time integrals over the heel while walking.
We hypothesized that the structure of an elevated MLA and valgus rearfoot alignment would predict higher plantar loads and loading rates over the rearfoot in both groups of runners. However, only the static valgus rearfoot alignment was a signiicant predictor of the maximum force and the force–time integrals, as well as the higher loading rates over the rearfoot in
both PF groups. Our results agreed with the study by Pohl et al.4, who found increases in the vertical force in female runners with histories of PF, compared with control runners, although these authors did not show a statistical model demonstrating a direct relationship between these two parameters (MLA and plantar loads).
Higher and repetitive plantar loads over the rearfoot while running, due to valgus rearfoot alignment, can indirectly induce the tensile force and micro-failure of the plantar fascia throughout the medial calcaneal tuberosity while running23, contributing to the progression of PF. Lee and Hertel26 showed that valgus rearfoot alignment was a signiicant predictor of the peak and pressure-time integrals over the medial rearfoot and midfoot in healthy runners running on a treadmill. In the current study, we conirmed that runners with PF presented positive relationships between the valgus rearfoot alignment and maximum force, time-integral forces, and load rates over the rearfoot while running in a natural environment. Therefore, we can conclude that controlling the valgus alignment of the rearfoot may help prevent PF (acute and chronic). These indings may help health care professionals to choose more appropriate mechanical treatment strategies for runners with PF, such as orthoses, insoles, and physical therapy interventions, for better controlling rearfoot valgus and reducing the loading rates over the rearfoot.
One of the limitations of this study was that the loading rates were estimated using equipment with a maximal sampling rate of 100 Hz. We suggest that further studies examine the rearfoot valgus alignment and MLA dynamically to clearly elucidate the underlying mechanism of the increased maximum force, time-integral force, and loading rate over the rearfoot, as well as the maximum pressure and time-integral pressure over the forefoot, and relationships between these clinical measurements of the foot.
Conclusions
Acknowledgements
The authors would like to thank Coordenação de Aperfeiçoamento de Pessoal de Nível Superior (CAPES) for one scholarship (2011/03069-6) and Fundação de Amparo à Pesquisa do Estado de São Paulo (FAPESP) for three scholarships (2014/081190, 2015/20042-5, and 2010/14044-1).
References
1. Aguilar MB, Abián-VicénJ, Halstead J, Gijon-Nogueron G.
Effectiveness of neuromuscular taping on pronated foot
posture and walking plantar pressures in amateur runners.
J Sci Med Sport. 2015 Apr 24. pii: S1440-2440(15)00086-9.
doi: 10.1016/j.jsams.2015.04.004. PMid:25956688.
2. Newman P, Witchalls J, Waddington G, Adams R. Risk factors associated with medial tibial stress syndrome in runners: a systematic review and meta-analysis. Open
Access J Sports Med. 2013;4:229-41. PMid:24379729.
3. Willson JD, Ratcliff OM, Meardon SA, Willy RW. Influence of step length and landing pattern on patellofemoral
joint kinetics during running.Scand J Med Sci Sports.
2015;14(1):1-8. PMid:25585589.
4. Pohl MB, Hamill J, Davis IS. Biomechanical and anatomic factors associated with a history of plantar fasciitis in female runners. Clin J Sport Med. 2009;19(5):372-6. http://dx.doi.
org/10.1097/JSM.0b013e3181b8c270. PMid:19741308. 5. Di Caprio F, Buda R, Mosca M, Calabró A, Giannini S. Foot
and lower limb diseases in runners: assessment of risk factors. J Sports Sci Med. 2010;9(4):587-96. PMid:24149785.
6. Ribeiro AP, Trombini-Souza F, Tessutti VD, Lima FR, João SMA, Sacco ICN. The effects of plantar fasciitis and pain on plantar pressure distribution of recreational runners. Clin Biomech (Bristol, Avon). 2011;26(2):194-9. http://dx.doi.
org/10.1016/j.clinbiomech.2010.08.004. PMid:20843589. 7. Wearing SC, Smeathers JE, Urry SR, Hennig EM, Hills
AP. The pathomechanics of plantar fasciitis. Sports Med.
2006;36(7):585-611.
http://dx.doi.org/10.2165/00007256-200636070-00004. PMid:16796396.
8. Taunton JE, Ryan MB, Clement DB, McKenzie DC, Lloyd-Smith DR. Plantar fasciitis: a retrospective analysis of
267 cases. Phys Ther Sport. 2002;3(2):57-65. http://dx.doi.
org/10.1054/ptsp.2001.0082.
9. Lopes AD, Hespanhol LCH Jr, Yeung SS, Costa LOP. What
are the Main running-related musculoskeletal injuries? A
systematic review. Sports Med. 2012;42(10):891-905. http://
dx.doi.org/10.1007/BF03262301. PMid:22827721.
10. Kibler WB, Goldberg C, Chandler TJ. Functional biomechanical deficits in running athletes with plantar fasciitis. Am J Sports Med. 1991;19(1):66-71. http://dx.doi.
org/10.1177/036354659101900111. PMid:1672577. 11. Rome K, Howe T, Haslock I. Risk factors associated with
the development of plantar heel pain in athletes. Foot.
2001;11(13):119-25. http://dx.doi.org/10.1054/foot.2001.0698.
12. Saragiotto BT, Yamato TP, Lopes AD. What do recreational
runners think about risk factors for running injuries? A
descriptive study of their beliefs and opinions. J Orthop
Sports Phys Ther. 2014;44(10):733-8. http://dx.doi.org/10.2519/
jospt.2014.5710. PMid:25155860.
13. Ribeiro AP, Trombini-Souza F, Tessutti VD, Lima FR, Sacco
ICN, João SM. Rearfoot alignment and medial longitudinal arch configurations of runners with symptoms and histories of plantar fasciitis. Clinics. 2011;66(6):1027-33. http://dx.doi.
org/10.1590/S1807-59322011000600018. PMid:21808870.
14. Taunton JE, Clement DB, McNicol K. Plantar fasciitis in runners. Can J Appl Sport Sci. 1982;7(1):41-4. PMid:7094192. 15. Mei Q, Fernandez J, Fu W, Feng N, Gu Y. A comparative
biomechanical analysis of habitually unshod and shod runners based on a foot morphological difference. Hum Mov Sci. 2015;42(1):38-53. http://dx.doi.org/10.1016/j.
humov.2015.04.007. PMid:25964998.
16. Fallon JB, Bent LR, McNulty PA, Macefield VG. Evidence for strong synaptic coupling between single tactile afferents from the sole of the foot and motoneurons supplying leg muscles. J Neurophysiol. 2005;94(6):3795-804. http://dx.doi.
org/10.1152/jn.00359.2005. PMid:16079197.
17. Kwong PK, Kay D, VonerRT, White MW. Plantar fasciitis. Mechanics and pathomechanics of treatment. Clin Sports Med. 1988;7(1):119-26. PMid:3044618.
18. Menz HB, Dufour AB, RiskowskiJL, Hillstrom HJ, Hannan MT. Association of Planus Foot posture and pronated foot function are associated with foot pain: the framingham foot study. Arthritis Care Res. 2013;65(12):1991-9. http://
dx.doi.org/10.1002/acr.22079.
19. Williams DS 3rd, Davis IM, Scholz JP, Hamill J, Buchanan TS. High-arched runners exhibit increased leg stiffness compared to low-arched runners. Gait Posture. 2004;19(3):263-9. http://
dx.doi.org/10.1016/S0966-6362(03)00087-0. PMid:15125915.
20. Sneyers CJ, Lysens R, Feys H, Andries R. Influence of malalignment of feet on the plantar pressure pattern in running. Foot Ankle Int. 1995;16(10):624-32. http://dx.doi.
org/10.1177/107110079501601008. PMid:8574374.
21. Lees A, Lake M, Klenerman L. Shock absorption during forefoot running and its relationship to medial longitudinal arch height. Foot Ankle Int. 2005;26(12):1081-8. PMid:16390643.
22. Nakhaee Z, Rahimi A, Abaee M, Rezasoltani A, Kalantari KK. The relationship between the height of the medial
longitudinal arch (MLA) and the ankle and knee injuries
in professional runners. Foot (Edinb). 2008;18(2):84-90.
http://dx.doi.org/10.1016/j.foot.2008.01.004. PMid:20307417.
23. Lee SY, Hertel J, Lee SC. Rearfoot eversion has indirect effects on plantar fascia tension by changing the amount of arch collapse. Foot (Edinb). 2010;20(2-3):64-70.
PMid:20656471.
24. Williams DS, McClay IS, Hamill J, Buchanan TS. Lower extremity kinematic and kinetic differences in runners with high and low arches. J Appl Biomech. 2001;17(2):153-63.
25. Queen RM, Mall NA, NunleyJA, Chuckpaiwong B. Differences in plantar loading between flat and normal feet during different athletic tasks. Gait Posture. 2009;29(4):582-6. http://
dx.doi.org/10.1016/j.gaitpost.2008.12.010. PMid:19157878.
26. Lee SY, Hertel J. Effect of static foot alignment on plantar-pressure measures during running. J Sport Rehabil.
2012;21(2):137-43. PMid:22100503.
27. Rodrigues P, Chang R, TenBroek T, van EmmerikR, Hamill
tibial internal rotation continuously using vector coding. J Appl Biomech. 2015;31(2):88-94. http://dx.doi.org/10.1123/
JAB.2014-0067. PMid:25386828.
28. Schepsis AA, Leach RE, Gorzyca J. Plantar fasciitis. Etiology, treatment, surgical results, and review of the literature. Clin
Orthop Relat Res. 1991;266(266):185-96. PMid:2019049.
29. League AC. Current concepts review: plantar fasciitis. Foot
Ankle Int. 2008;29(3):358-66. http://dx.doi.org/10.3113/
FAI.2008.0358. PMid:18348838.
30. Lemont H, Ammirati KM, Usen N. A degenerative process (fasciosis) without inflammation. J Am Podiatr Med Assoc.
2003;93(3):234-7.
http://dx.doi.org/10.7547/87507315-93-3-234. PMid:12756315.
31. Bedi HS, Love BR. Differences in impulse distribution in patients with plantar fasciitis. Foot Ankle Int. 1998;19(3):153-6.
http://dx.doi.org/10.1177/107110079801900307. PMid:9542986.
32. Wearing SC, Smeathers JE, Urry SR. The effect of plantar fasciitis on vertical foot-ground reaction force. Clin Orthop
Relat Res. 2003;409:175-85. http://dx.doi.org/10.1097/01.
blo.0000057989.41099.d8. PMid:12671500.
33. Wearing SC, Smeathers JE, Sullivan PM, Yates B, Urry SR, Dubois P. Plantar fasciitis: are pain and fascial thickness
associated with arch shape and loading? Phys Ther.
2007;87(8):1002-8. http://dx.doi.org/10.2522/ptj.20060136.
PMid:17553919.
34. Cornwall MW, McPoil TG. Influence of rearfoot postural alignment on rearfoot motion during walking. Foot.
2004;14(3):133-8. http://dx.doi.org/10.1016/j.foot.2004.02.003.
35. Sacco ICN, Picon AP, Ribeiro AP, Sartor CD,
Camargo-Junior F, Macedo DO, et al. Effect of image resolution manipulation in rearfoot angle measurements obtained with photogrammetry. Braz J Med Biol Res. 2012;45(9):806
-10. http://dx.doi.org/10.1590/S0100-879X2012000900003.
PMid:22911379.
36. Cavanagh PR, Rodgers M. The arch index: a useful measure from footprints. J Biomech. 1987;20(5):547-51. http://dx.doi.
org/10.1016/0021-9290(87)90255-7. PMid:3611129.
37. Ribeiro AP, Tombini-Souza F, Iunes DH, Monte-RasoVV. Confiabilidade inter e intra-examinador da fotopodometria e intra-examinador da fotopodoscopia. Rev Bras Fisioter. 2006;10(4):435-9. http://dx.doi.org/10.1590/
S1413-35552006000400012.
38. Mall NA, Hardaker WM, NunleyJA, Queen RM. The reliability and reproducibility of foot type measurements using a mirrored foot photo box and digital photography compared to
caliper measurements. J Biomech. 2007;40(5):1171-6. http://
dx.doi.org/10.1016/j.jbiomech.2006.04.021. PMid:16824532.
39. Weir JP. Quantifying test-retest reliability using the intraclass
correlation coefficient and the SEM.J Strength Cond Res.
2005;19(1):231-40. PMid:15705040.
40. RosenbaumAJ, DiPreta JA, Misener D. Plantar heel pain.
Med Clin North Am. 2014;98(2):339-52. http://dx.doi.
org/10.1016/j.mcna.2013.10.009. PMid:24559879.
41. Teyhen DS, Stoltenberg BE, Collinsworth KM, Giesel CL, Williams DG, Kardouni CH, et al. Dynamic plantar pressure parameters associated with static arch height index during gait. Clin Biomech (Bristol, Avon). 2009;24(4):391-6. http://
dx.doi.org/10.1016/j.clinbiomech.2009.01.006. PMid:19246138.
42. Burns J, Crosbie J, Hunt A, Ouvrier R. The effect of pes cavus on foot pain and plantar pressure. Clin Biomech (Bristol, Avon). 2005;20(9):877-82. http://dx.doi.org/10.1016/j.
clinbiomech.2005.03.006. PMid:15882916.
43. Chang R, Kent-Braun JA, Hamill J. Use of MRI for volume estimation of tibialis posterior and plantar intrinsic foot muscles in healthy and chronic plantar fasciitis limbs. Clin Biomech (Bristol, Avon). 2012;27(5):500-5. http://dx.doi.
org/10.1016/j.clinbiomech.2011.11.007. PMid:22166747.
44. Ramskov D, Jensen ML, Obling K, NielsenRO, Parner ET,
Rasmussen S. No association between q-angle and foot
posture with running-related injuries: a 10 week prospective
follow-up study. Int J Sports Phys Ther. 2013;8(4):407-15.
PMid:24175127.
45. Pavan PG, Stecco C, Darwish S, NataliAN, De Caro R.
Investigation of the mechanical properties of the plantar
aponeurosis. Surg Radiol Anat. 2011;33(10):905-11. http://
dx.doi.org/10.1007/s00276-011-0873-z. PMid:21947015.
46. Sullivan J, Burns J, Adams R, Pappas E, Crosbie J. Plantar heel pain and foot loading during normal walking. Gait Posture. 2015;41(2):688-93. http://dx.doi.org/10.1016/j.
gaitpost.2015.01.025. PMid:25724260.
Correspondence Ana Paula Ribeiro Universidade de São Paulo Centro de Docência e Pesquisa
Departamento de Fisioterapia, Fonoaudiologia e Terapia Ocupacional
Rua Cipotânea, 51, Cidade Universitária CEP 05360-160, São Paulo, SP, Brazil