1 Department of Physical Education, Universidade Federal do Paraná (UFPR), Curitiba, PR, Brazil 2 Faculty of Physical Education, Universidade Estadual de Campinas (UNICAMP), Campinas, SP, Brazil 3 Department of Physical Education, Universidade do Paraná (UNIPAR), Francisco Beltrão, PR, Brazil
4 Research Center for Sport and Physical Activity, Faculty of Sports Sciences and Physical Education, Universidade de Coimbra, Coimbra, Portugal
Received: 02/05/2013 Revised: 06/26/2013 Accepted: 09/06/2013
a r t i c l e
Endothelial wall thickness, cardiorespiratory
fitness and inflammatory markers in obese
and non-obese adolescents
Larissa R. Silva1, Cláudia Cavaglieri2, Wendell A. Lopes2, Juliana Pizzi3, Manuel J. C. Coelho-e-Silva4, Neiva Leite1
ABSTRACT | Background: Increased carotid intima-media thickness (c-IMT) is considered a marker of early-onset atherosclerosis and it has been found in obese children and adolescents, but the risk factors associated with this population remain to be elucidated. Objective: To compare and verify the relationship between c-IMT, metabolic proile, inlammatory markers, and cardiorespiratory itness in obese and non-obese children and adolescents. Method: Thirty-ive obese subjects (19 boys) and 18 non-obese subjects (9 boys), aged 10-16 years, were included. Anthropometry, body composition, blood pressure, maximal oxygen consumption (VO2max), and basal metabolic rate were evaluated. Serum glucose, insulin, homeostasis model assessment of insulin resistance (HOMA-IR), blood lipids, C-reactive protein (CRP), and adiponectin were assessed. c-IMT was measured by ultrasound. Results: The results showed that c-IMT, triglycerides, insulin, HOMA-IR, and CRP values were signiicantly higher in the obese group than in the non-obese group, and high-density lipoprotein cholesterol (HDL-c), adiponectin, and VO2max values were signiicantly lower in the obese group than in the non-obese group. The c-IMT was directly correlated with body weight, waist circumference, % body fat, and HOMA-IR and inversely correlated with % free fat mass, HDL-c, and VO2max. Conclusions: Our indings show that c-IMT correlates not only with body composition, lipids, insulin resistance, and inlammation but also with low VO2max values in children and adolescents.
Keywords: obesity; inlammation; atherosclerosis; adolescents; itness; physical therapy.
HOW TO CITE THIS ARTICLE
Silva LR, Cavaglieri C, Lopes WA, Pizzi J, Coelho-e-Silva MJC, Leite N. Endothelial wall thickness, cardiorespiratory itness and inlammatory markers in obese and non-obese adolescents. Braz J Phys Ther. 2014 Jan-Feb; 18(1):47-55. http://dx.doi. org/10.1590/S1413-35552012005000133
Introduction
Obesity is independently associated with coronary atherosclerosis in young adults1. Inlammation, obesity,
and insulin resistance usually occur together, as they
are part of the atherosclerotic process and contribute to the development of cardiovascular diseases2. Research
in the juvenile population shows a relationship
between inflammatory markers and endothelial dysfunction3,4. The elevation of C-reactive protein
(CRP) is considered an indicator of inlammation and
a predictor of cardiovascular diseases and diabetes5.
Low concentrations of adiponectin are associated with
obesity6,7, vasculopathy, and diabetes8.
Recently, non-invasive techniques have been used in order to evaluate early markers of atherogenesis, including ultrasound assessment of the wall thickness
of the endothelium9,10. This evaluation consists in
measuring, by means of ultrasound imaging, the
thickness of the tunica intima and tunica media of the artery9, known as intima-media thickness (IMT).
The increase in this value is considered a risk factor for coronary artery disease10 and current data shows
that obese children have greater carotid
intima-media thickness (c-IMT) than healthy children,
thus suggesting that they are more susceptible to
cardiovascular events in adulthood2,3,9.
Some studies have examined the c-IMT in children and adolescents2,3, but few studies also
veriied cardiorespiratory itness11. The diagnosis
and prevention of these risk factors in childhood are important public health issues, as they allow
dysfunction, dyslipidemia, level of cardiorespiratory
itness, and inlammatory markers in obese and non-obese subjects.
Method
Participants
The sample included 53 subjects, aged 10-16 years of age, from the city of Curitiba, PR, Brazil. Participants were divided into two groups, the obese group (n=35) and the non-obese group (n=18). Inclusion criteria were: a) informed consent signed by parents or guardians, b) meeting the criteria for
obesity and non-obesity described below, and c) no
history of regular physical activity outside of physical education classes at school. Based on body mass index (BMI) and U.S. growth charts12, participants
were classiied as obese (n=35, BMI>P95%) and non-obese (n=18, BMI<85%). The obese group was selected among participants from an intervention project conducted at Universidade Federal do Paraná (UFPR), Curitiba, PR, Brazil. The non-obese group
consisted of volunteers from public schools matched
by sex and age. Exclusion criteria consisted of: a)
musculoskeletal problems or physical disability, b)
subjects who did not undergo all assessments, c) subjects with abnormal thyroid-stimulating hormone (TSH) function. All of the adolescents and their legal guardians gave written informed consent. The study complied with Resolution 196/96 of the National Health Council and was previously approved by the Human Research Ethics Committee of the UFPR Health Sciences Faculty (CEP/SD: 945.070.10.06).
Variables
Clinical evaluation
Chronological age (CA) was recorded to the nearest 0.1 year by subtracting the birth date from the date of the mid-testing period. Sexual maturation was given by stages of pubic hair (PH) and was individually assessed following the criteria described
by Tanner13. Resting heart rate (HRres) and systolic
(SBP) and diastolic blood pressure (DBP) were measured with the subjects in the sitting position after 10 minutes of rest. HRres was obtained using a heart rate monitor (Polar A2) followed by blood pressure (BP), which was always measured by a single clinician in the right arm supported at heart level, using a mercury sphygmomanometer (Wan Med,
São Paulo, SP, Brazil). Two measurements were
taken, with an interval of 2 minutes between them. The lowest value was considered for the analysis.
BP measurements were considered as borderline or increased if the values were equal to or above the 90th percentile for age and sex14.
Anthropometry
Height was measured with a portable stadiometer (Harpenden, Holtain Ltd, Crosswell, Crymych, Pembs., UK) to the nearest 0.1 cm. Body mass was measured with a portable scale (Seca 770, Hanover, MD, USA) to the nearest 0.1 kg. Anthropometry was performed by a single individual following standardized procedures15. The BMI was derived and
BMI Z-score was obtained using U.S. data tables12.
Waist circumference (WC) was also measured by the same single observer and was measured in centimeters, using a non-stretch flexible tape measure, to the nearest 0.1 cm. The tape was placed above the iliac crest, parallel to the ground, with the individual standing with the abdomen relaxed, arms to the side, and feet together. The cut-off was taken as the 75th percentile or greater, according to age
and ethnicity16.
Body fat mass assessment
The two-compartment model of body composition was assessed by bioelectrical impedance analysis
(BIA), using a standardized body composition analyzer (Biodynamics Corporation, Seattle, WA, USA). Measurements were performed in the morning, without performing any prior vigorous physical activity and before breakfast, after a 10 to 12-hour overnight fast. The procedure required subjects to be in the supine position. Fat free mass (FFM), Fat Mass (FM), and the percentage of body fat mass (%BF) were calculated using validated equations17
and in accordance with National Institutes of Health guidelines18.
Cardiorespiratory fitness
Cardiorespiratory fitness was assessed on a treadmill (X-Fit 7 Power Treadmill), using protocols in accordance with age and progressive intensities. The ramp protocol was used, which consists of 8 to 12 minutes of exercise with small and constant increments in speed and gradient based on the expected maximum oxygen consumption19. Criteria
for the maximum test were: a) exhaustion or inability
by the average of the three highest consecutive values obtained during the maximum test20.
Oxygen consumption (VO2), volume of expired
carbon dioxide (VCO2), and ventilation (VE) were measured in a gas analyzer using open-circuit ergospirometry (Parvo Medics TrueOne® 2400 Metabolic Measurement System, Sandy, UT, USA), and the respiratory exchange ratio (RER) was
calculated.
Measurement of biochemical markers
Participants were instructed to visit the hospital after 12 hours of fasting. All visits occurred in the morning, before any vigorous physical activity. Blood samples were collected to obtain a hemogram and levels of glucose, insulin, total cholesterol (TC), high-density lipoprotein cholesterol (HDL-c), low-density lipoprotein cholesterol (LDL-c), triacylglycerol (TAG), human adiponectin, and C-reactive protein (CRP). Data were collected by
venipuncture and the blood samples were stored in dry tubes for biochemical measurements. The
colorimetric enzymatic method was used to measure TC, HDL-c, and TAG. The cutoff points were those proposed to Brazilian children and adolescents21.
LDL-c was calculated using the Friedewald et al.22
formula. The ultra-sensitive CRP was measured
by the turbidimetric assay and adiponectin, by the
ELISA method (Adiponectin DuoSet, R&D Systems, Inc., Minneapolis, MN, USA).
Intima-media thickness (IMT) assessment
The IMT of the common carotid artery (1-2 cm
proximal to the carotid bifurcation) was assessed bilaterally in the posterior wall of the vessel with the
aid of an ultrasound device (Philips SONOS 5500 with 8 MHz linear transduction). The procedure required subjects to be in the supine position and resting their back on a pillow. The average of three values of the right-side c-IMT (c-IMTr) and left-side
c-IMT (c-IMTl) was retained for analysis. c-IMT corresponds to the mean of c-IMTr and c-IMTl.
All measurements were performed by the same experienced observer (clinician at Hospital das Clínicas - UFPR). The intraobserver coeficient was 8% for c-IMTl and 2% for c-IMTr.
Statistical analysis
The initial analysis was descriptive in nature to determine the means and standard deviations for anthropometry, metabolic markers, and IMT. The
normality of data was assessed by the Shapiro-Wilk
test. When necessary, values were transformed into natural logarithm (logn) for normalization. As for the
proportion and prevalence, we used the chi-square test and Fisher’s exact test. The independent T test was used for parametric data and the Mann-Whitney U test was used for nonparametric data in order to compare variables between groups. Pearson’s correlation for parametric data and Spearman’s
correlation for non-parametric data were used to
analyze the possible relationship among BMI, VO2max, inlammatory markers, lipid proile, and c-IMT. For proper analysis, the classiication of the magnitude of the correlations was used: r=0.10 to 0.30 (weak), r=0.40 to 0.60 (moderate), r=0.70 to 1.0 (strong). The level of signiicance was p<0.05. Statistical tests were performed with the SPSS Statistics 18.0 software (SPSS Inc.).
Results
Fifty-three adolescents participated in this study and were divided into two groups according to the
presence or absence of obesity. The sample consisted
of 35 subjects in the obese group (19 boys and 16 girls) and 18 subjects in the non-obese group (9 boys and 9 girls).
The clinical and anthropometric characteristics
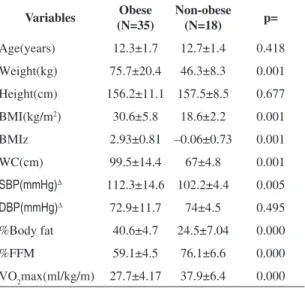
are presented in Table 1. The mean age was similar between the obese (12.3±1.7 years) and non-obese subjects (12.7±1.4 years). The mean height values did
Table 1. Clinical and anthropometric variables of the obese and non-obese groups (n=53).
Variables Obese (N=35)
Non-obese (N=18) p=
Age(years) 12.3±1.7 12.7±1.4 0.418
Weight(kg) 75.7±20.4 46.3±8.3 0.001
Height(cm) 156.2±11.1 157.5±8.5 0.677
BMI(kg/m2) 30.6±5.8 18.6±2.2 0.001
BMIz 2.93±0.81 –0.06±0.73 0.001
WC(cm) 99.5±14.4 67±4.8 0.001
SBP(mmHg)∆ 112.3±14.6 102.2±4.4 0.005
DBP(mmHg)∆ 72.9±11.7 74±4.5 0.495
%Body fat 40.6±4.7 24.5±7.04 0.000
%FFM 59.1±4.5 76.1±6.6 0.000
VO2max(ml/kg/m) 27.7±4.17 37.9±6.4 0.000
BMI: body mass index; BMIz: body mass index z-score; WC: waist circumference; SBP: systolic blood pressure; DBP: diastolic blood pressure; %Body fat: percentage of body fat; %FFM: percentage of free-fat mass; VO2max: maximum volume of oxygen; ∆variables
not differ between groups. The obese group showed higher values for weight, BMI, BMI Z-score, and WC than the non-obese group (p<0.001) as a result of the initial group allocation. The mean SBP was higher in the obese group than in the non-obese group (p<0.005) and DBP did not differ between groups. As for the maturation stage, the groups were similar (p<0.59).
For WC, all subjects in the obese group showed increased abdominal adiposity, with 29 subjects (93%) above the 90th percentile. None of the non-obese subjects showed adiposity above the 75th percentile. In the total sample, there were eight (15.7%) subjects with systolic hypertensive measurements and 17 (33.3%) with diastolic hypertensive measurements. The obese group had a higher frequency of hypertensive measures in SBP (8 vs. 0, χ2=4.74; p<0.029). The frequencies of
DBP were similar between groups. The mean values of FM, fat percentage (%Body Fat), fat-free mass (FFM), and percentage of fat-free mass (%FFM) were higher in the obese group than in the non-obese group (p<0.01). As for cardiorespiratory variables, the obese group had lower levels of VO2maxand higher levels of HRrest than the non-obese group (p<0.001).
The obese group showed higher frequencies of VO2max, lower than the expected for age and sex, than the non-obese group (34 vs. 14; p<0.006). In the non-obese group, three (22.3%) subjects had normal values of VO2max, while none of the subjects in the obese group reached this classiication.
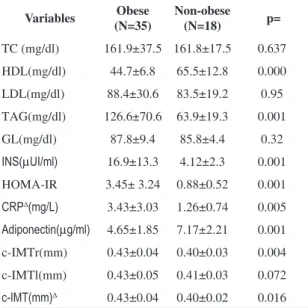
The clinical and laboratory variables are presented
in Table 2. The obese subjects showed higher TAG and insulin values and lower HDL values than the non-obese ones (p<0.001). The TC, LDL, and glycemia (GL) variables were similar between groups.
The obese subjects had a higher number of occurrences of high TAG (13 vs. 1, χ2=7.50; p<0.007)
and low HDL (18 vs. 0, χ2=17.21; p<0.00) than the
non-obese ones. TC (10 vs. 5, χ2=0.12; p<0.733) and
LDL (2 vs. 0, p<0.27) did not differ between groups. Figure 1 shows the distributions of percentage values of changes in lipid proiles of both groups. The obese subjects had higher CRP, c-IMTr, and c-IMT values than the non-obese subjects (p<0.05) and lower adiponectin values (p<0.001). c-IMTl values were similar between the two groups.
BMI showed a strong positive correlation with weight (r=0.93; p<0.01), WC (r=0.95; p<0.01), Fat Mass (FM) (r=0.95; p<0.01), and %Body Fat (r=0.87; p<0.01) and an inverse correlation with %FFM(r=–0.88; p<0.01) and VO2max(r=–0.68;
Table 2. Clinical and laboratory variables of the obese and non-obese groups (n=53).
Variables Obese (N=35)
Non-obese (N=18) p=
TC (mg/dl) 161.9±37.5 161.8±17.5 0.637
HDL(mg/dl) 44.7±6.8 65.5±12.8 0.000
LDL(mg/dl) 88.4±30.6 83.5±19.2 0.95
TAG(mg/dl) 126.6±70.6 63.9±19.3 0.001
GL(mg/dl) 87.8±9.4 85.8±4.4 0.32
INS(µUI/ml) 16.9±13.3 4.12±2.3 0.001
HOMA-IR 3.45± 3.24 0.88±0.52 0.001
CRP∆(mg/L) 3.43±3.03 1.26±0.74 0.005
Adiponectin(µg/ml) 4.65±1.85 7.17±2.21 0.001
c-IMTr(mm) 0.43±0.04 0.40±0.03 0.004
c-IMTl(mm) 0.43±0.05 0.41±0.03 0.072
c-IMT(mm)∆ 0.43±0.04 0.40±0.02 0.016
TC: total cholesterol; HDL: high density lipoprotein; LDL: low density lipoprotein; TAG: triacylglycerides; GL: glycemia; INS: insulinemia; HOMA-IR: Homeostasis Metabolic Assessment; CRP: c-reactive protein; c-IMTr: right intima-media thickness; c-IMTl:
left intima-media thickness; c-IMT: mean intima-media thickness;
∆variables that did not show a normal distribution.
p<0.01). It was also moderately and directly correlated with SBP(r=0.45; p<0.01), HRrest (r=0.42; p<0.01), TAG (r=0.42; p<0.01), GL (r=0.40; p<0.01), and insulin (r=0.44; p<0.01) and inversely correlated with FFM (r=0.65; p<0.01), adiponectin (r=–0.51; p<0.01), and HDL (r=0.61; p<0.01).
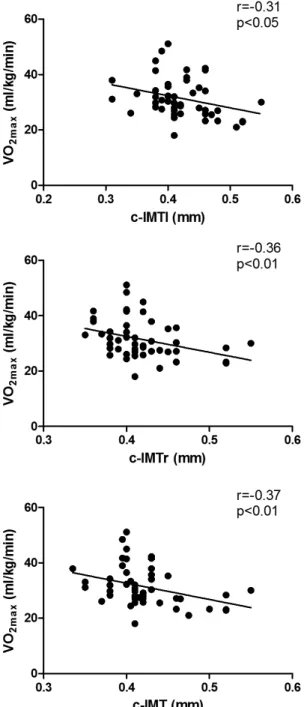
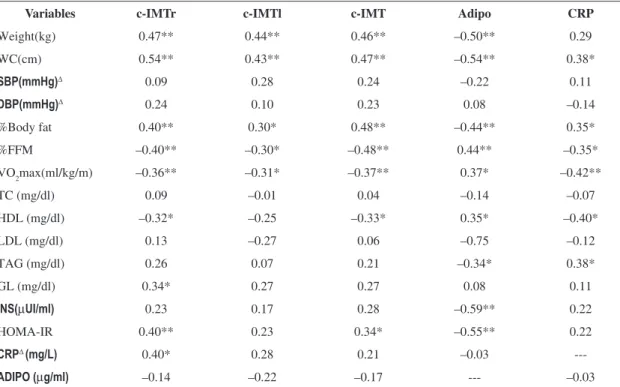
The three measures of c-IMT showed a moderate
direct correlation with weight, WC, BMI, FM, %Body Fat, and FFM and an inverse correlation with %FFM and VO2max. Figure 1 shows the correlation between VO2maxand c-IMT. Only c-IMTr and c-IMT were moderately correlated with the BMI Z-score. As for laboratory variables, c-IMTr showed a weak positive correlation with LDL and GL, and a negative correlation with HDL. It was also moderately correlated with CRP. For c-IMT, we found only a weak inverse correlation with HDL. For c-IMTl, we did not ind any correlations with any of the evaluated
clinical and laboratory variables.
Adiponectin showed a moderate inverse correlation with weight, WC, FM, %Body Fat, and FFM and a positive correlation with %FFM. It was weakly and directly correlated with VO2max. As for CRP, we found a weak direct correlation with WC and %Body Fat and an inverse correlation with %FFM. CRP and VO2max were moderately and inversely correlated.
It was also weakly correlated with HDL and inversely correlated with TAG. CRP was moderately correlated with TAG and inversely correlated with HDL. Table 3 shows the correlations among the variables.
Discussion
In our study, we found that obese children and
adolescents presented higher c-IMT values than
non-obese ones, corroborating previous studies
that reported the contribution of obesity to the development of early atherosclerosis23,24. The risk
factors for atherosclerosis, such as hypertension, dyslipidemia, diabetes, and insulin resistance, have been demonstrated in adults25-28, however information
on the association of c-IMT with different risk factors measured in childhood and adolescence is limited and contradictory. In a study conducted by
Mangge et al.29, BMI was positively correlated with
c-IMT. Additionally, Beauloye et al.4 found that
SBP, insulin, and HOMA-IR were correlated with c-IMT. In contrast, some authors did not ind any
correlation between c-IMT and cardiovascular risk factors3,30-32. In the present study, we found that c-IMT
was positively correlated with BMI, WC, %BF, and HOMA-IR and inversely correlated with HDL. These indings are in line with studies demonstrating
that obesity, insulin resistance, and dyslipidemia can be associated with an increase in c-IMT in this population33.
Recently, inlammation biomarkers have been
considered a risk factor for early atherosclerosis4,34,35.
Elevated PCR and reduced adiponectin levels are known to be more frequent in obese individuals7. We
found that obese children and adolescents had higher PCR and lower adiponectin levels than non-obese ones. Also, we found that c-IMT was signiicantly correlated with PCR, but not with adiponectin. CRP is
known to affect endothelial function via either direct
or indirect mechanisms, such as reducing NO (nitric oxide) production and stimulating
inlammation-oxidative stress pathways34. Moreover, adiponectin
promotes the production of NO in endothelial cells,
and hypoadiponectinaemia is associated with blunted endothelial function30. The lack of NO production
induces vasoconstriction, leucocyte adherence, platelet activation, oxidative stress, and thrombosis,
leading to endothelial dysfunction34,36. The lack of
correlation between adiponectin and endothelial dysfunction in obese children and adolescents may
be due to different signaling pathways in children and in adults, especially as regards phosphatidylinositol 3-kinase for adiponectin stimulation of NO
production in endothelial cells37. In addition, the
presence of multimetric forms of adiponectin and
high-molecular-weight adiponectin is thought to be superior to total adiponectin level in predicting the
c-IMT37. This was shown by Mangge et al.31, who
reported that only high-molecular-weight adiponectin
was correlated with c-IMT in obese and non-obese children.
Figure 1. Correlation between maximal oxygen consumption
(VO2max) and left-side carotid intima-media thickness (c-IMTl), right-side carotid intima-media thickness (c-IMTr), and carotid
Our main inding was that cardiorespiratory itness (VO2max) was inversely associated with c-IMT. Studies have reported an inverse association
between cardiorespiratory itness and c-IMT in middle-aged38,39 and elderly39 individuals. In children
and adolescents, only two studies investigated this
relationship and the results were contradictory40,41.
Kim et al.40 found an inverse signiicant correlation
between VO2max and maximum IMT in Korean male adolescents. On the other hand, Pahkala et al.41 did
not ind an association between itness and c-IMT in Finnish adolescents. It is interesting to note that both studies estimated VO2max using indirect methods. The gold-standard measure of cardiorespiratory itness in humans involves direct assessment of peak or maximal oxygen consumption in response to an exercise test. We used the direct method to measure the VO2max.
Cardiorespiratory itness is strongly associated with
reduced risk of cardiovascular disease and all-cause mortality42. There are several plausible mechanisms
by which cardiorespiratory itness might reduce the
risk of carotid atherosclerotic vascular disease. Some
studies suggest that the effect of exercise on arterial
wall thickness is explained by exercise-mediated
changes in traditional cardiovascular risk factors,
such as adiposity, lipid levels, and blood pressure39.
High levels of physical activity increase nitric oxide
production, which improve vascular function by
enhancing vasodilation and vasomotor function in the vessels. It also prevents platelet aggregation and adhesion in the endothelium, enhances ibrinolysis, improves lipid proiles, and reduces blood viscosity and ibrinogen levels, all of which may contribute to slowing the progression of carotid atherosclerotic
vascular disease39,43. In contrast, other studies have
demonstrated the impact of exercise on c-IMT
regardless of changes in risk factors39,43.
The strength of this study is that we assessed values directly by using gas analyzer and ramp protocol. A limitation of our study is that the number of patients was small and we did not analyze boys and girls separately. In order to minimize the possible effects of gender differences on our data, the number of boys and girls was proportional in both groups (around 50% in each group). Another limitation is that we used the HOMA-IR to assess insulin resistance,
which is less accurate than hyperinsulinemic
euglycemic clamp. Additionally, we did not measure
other isoforms of adiponectin, which could be more
Table 3. Correlations between clinical, laboratory, and anthropometric variables.
Variables c-IMTr c-IMTl c-IMT Adipo CRP
Weight(kg) 0.47** 0.44** 0.46** –0.50** 0.29
WC(cm) 0.54** 0.43** 0.47** –0.54** 0.38*
SBP(mmHg)∆ 0.09 0.28 0.24 –0.22 0.11
DBP(mmHg)∆ 0.24 0.10 0.23 0.08 –0.14
%Body fat 0.40** 0.30* 0.48** –0.44** 0.35*
%FFM –0.40** –0.30* –0.48** 0.44** –0.35*
VO2max(ml/kg/m) –0.36** –0.31* –0.37** 0.37* –0.42**
TC (mg/dl) 0.09 –0.01 0.04 –0.14 –0.07
HDL (mg/dl) –0.32* –0.25 –0.33* 0.35* –0.40*
LDL (mg/dl) 0.13 –0.27 0.06 –0.75 –0.12
TAG (mg/dl) 0.26 0.07 0.21 –0.34* 0.38*
GL (mg/dl) 0.34* 0.27 0.27 0.08 0.11
INS(µUI/ml) 0.23 0.17 0.28 –0.59** 0.22
HOMA-IR 0.40** 0.23 0.34* –0.55** 0.22
CRP∆(mg/L) 0.40* 0.28 0.21 –0.03
---ADIPO (µg/ml) –0.14 –0.22 –0.17 --- –0.03
sensitive to correlation with c-IMT. Finally, the current study did not use a multivariable adjusted
model.
The main inding of this study was the inverse correlation between c-IMT and VO2max, which
shows that low aerobic itness in this age group
can be a predictor of the development of increased c-IMT in childhood and adolescence. It also shows
that regular physical activity may be a protective factor for atherosclerosis, regardless of the presence
of other traditional cardiovascular risk factors and
inlammation.
Conclusion
Obese children and adolescents had higher values of c-IMT, as well as metabolic and inlammatory
profiles. c-IMT correlates not only with body composition, blood lipids, insulin resistance, and
inlammation, but also with low VO2max in children
and adolescents. This result conirms the importance of regular physical activity to prevent cardiovascular disease. Further longitudinal studies are needed to
determine whether the increase in cardiorespiratory
itness is associated with improvement in c-IMT during adolescence.
The authors declared no conlict of interest.
Acknowledgements
The authors wish to thank Fundação para a Ciência e Tecnologia (FCT), Portugal, Coordenação de Aperfeiçoamento de Pessoal de Nivel Superior (CAPES), Brazil, and Conselho Nacional de Desenvolvimento Cientíico e Tecnológico (CNPq), Brazil, for their funding.
References
1. McGill HC Jr, Herderick EE, McMahan CA, Zieske AW, Malcolm GT, Tracy RE, et al. Atherosclerosis in youth. Minerva Pediatr. 2002;54:437-47. PMid:12244281.
2. Zhu W, Huang X, He J, Li M, Neubauer H. Arterial intima-media thickening and endothelial dysfunction in obese Chinese children. Eur J Pediatr. 2005;164:337-44. PMid:15750804. http://dx.doi.org/10.1007/ s00431-005-1642-y
3. Giannini C, De Giorgis T, Scarinci A, Ciampani M, Marcovecchio ML, Chiarelli F, et al. Obese related effects of inlammatory markers and insulin resistance on increased
carotid intima media thickness in pre-pubertal children.
Atherosclerosis. 2008;197:448-56. PMid:17681348. http://dx.doi.org/10.1016/j.atherosclerosis.2007.06.023 4. Beauloye V, Zech F, Tran HT, Clapuyt P, Maes M,
Brichard SM. Determinants of early atherosclerosis
in obese children and adolescents. J Clin Endocrinol Metab. 2007;92:3025-32. PMid:17519311. http://dx.doi. org/10.1210/jc.2007-0619
5. Brasil AR, Norton RC, Rossetti MB, Leao E, Mendes RP. C-reactive protein as an indicator of low intensity inlammation in children and adolescents with and without obesity. J Pediatr (Rio J). 2007;83:477-80.
6. Asayama K, Hayashibe H, Dobashi K, Uchida N, Nakane T, Kodera K, et al. Decrease in serum adiponectin level
due to obesity and visceral fat accumulation in children.
Obes Res. 2003;11:1072-9. PMid:12972677. http://dx.doi. org/10.1038/oby.2003.147
7. Nishimura R, Sano H, Matsudaira T, Morimoto A, Miyashita Y, Shirasawa T, et al. Changes in body mass index, leptin and adiponectin in Japanese children during a three-year follow-up period: a population-based cohort study. Cardiovasc Diabetol. 2009;8:30. PMid:19490650 PMCid:PMC2701411. http://dx.doi. org/10.1186/1475-2840-8-30
8. Bouassida A, Chamari K, Zaouali M, Feki Y, Zbidi A, Tabka Z. Review on leptin and adiponectin responses and adaptations to acute and chronic exercise. Br J Sports Med. 2010;44:620-30. PMid:18927166. http://dx.doi. org/10.1136/bjsm.2008.046151
9. Kumar V, Sachdev HP, Khalil A. Noninvasive evaluation
of endothelial function and arterial mechanics in
overweight adolescents. Indian Pediatr. 2004;41:1105-14. PMid:15591660.
10. Kapuku GK, Harshfield GA, Davis HC, Treiber FA. Early markers of cardiovascular disease. Vascul Pharmacol. 2006;45:277-80. PMid:17011834. http:// dx.doi.org/10.1016/j.vph.2006.08.009
11. Farpour-Lambert NJ, Aggoun Y, Marchand LM, Martin XE, Herrmann FR, Beghetti M. Physical activity reduces
systemic blood pressure and improves early markers of
atherosclerosis in pre-pubertal obese children. J Am Coll Cardiol. 2009;54:2396-2406. PMid:20082930. http:// dx.doi.org/10.1016/j.jacc.2009.08.030
12. Kuczmarski RJ, Ogden CL, Grummer-Strawn LM, Flegal KM, Guo SS, Wei R, et al. CDC growth charts: United States. Adv Data. 2000;(314)1-27. PMid:11183293. 13. Tanner JM. Normal growth and techniques of growth
assessment. Clin Endocrinol Metab. 1986;15:411-51. http://dx.doi.org/10.1016/S0300-595X(86)80005-6 14. National High Blood Pressure Education Program
Working Group on High Blood Pressure in Children and Adolescents. The fourth report on the diagnosis, evaluation, and treatment of high blood pressure in children and adolescents. Pediatrics. 2004;114:555-76. PMid:15286277. http://dx.doi.org/10.1542/ peds.114.2.S2.555
15. Lohman TG, Roche AF, Martorell R. Anthropometric standardization reference manual. Champaign: Human Kinetics; 1988.
16. Fernandez JR, Redden DT, Pietrobelli A, Allison DB. Waist
circumference percentiles in nationally representative
17. Houtkooper LB, Going SB, Lohman TG, Roche AF, Van Loan M. Bioelectrical impedance estimation of fat-free
body mass in children and youth: a cross-validation study.
J Appl Physiol. 1992;72:366-73. PMid:1537738. 18. Bioelectrical impedance analysis in body composition
measurement: National Institutes of Health Technology Assessment Conference Statement. Am J Clin Nutr. 1996;64(3 Suppl):524S-32. PMid:8780375.
19. American College of Sports Medicine – ACSM. ACSM’S Guidelines for exercise testing and prescription. Philadelphia: Lippincott Williams & Wilkins; 2006. 20. Leite N, Milano GE, Cieslak F, Lopes WA, Rodacki
A, Radominski RB. Effects of physical exercise and nutritional guidance on metabolic syndrome in obese adolescents. Rev Bras Fisioter. 2009;13:73-81. http:// dx.doi.org/10.1590/S1413-35552009005000009 21. Back Giuliano Ide C, Caramelli B, Pellanda L, Duncan
B, Mattos S, Fonseca FH. [I guidelines of prevention of atherosclerosis in childhood and adolescence]. Arq Bras Cardiol. 2005;85 Suppl 6:4-36. PMid:16597097.
22. Friedewald WT, Levy R, Fredrickson DS. Estimation of
the concentration of low-density lipoprotein cholesterol
in plasma, without use of the preparative ultracentrifuge. Clin Chem. 1972;18:499-502. PMid:4337382.
23. Lamotte C, Iliescu C, Libersa CFG. Increased
intima-media thickness of the carotid artery in childhood: a
systematic review of observational studies. Eur J Pediatr. 2011;170:719-29. PMid:20978785. http://dx.doi. org/10.1007/s00431-010-1328-y
24. Silva LR, Stefanello JMF, Pizzi J, Timossi LS, Leite N. Atherosclerosis subclinical and inlammatory markers in obese and nonobese Children and adolescents. Rev Bras Epidemiol. 2012;15(4):13. PMid:22450489.
25. Di Pino A, Alagona C, Piro S, Calanna S, Spadaro L, Palermo F, et al. Separate impact of metabolic syndrome and altered glucose tolerance on early markers of vascular injuries. Atherosclerosis. 2012;223(2):458-62. PMid:22742860. http://dx.doi.org/10.1016/j. atherosclerosis.2012.05.008
26. Recio-Rodriguez JI, Gomez-Marcos MA, Patino-Alonso MC, Agudo-Conde C, Rodriguez-Sanchez E, Garcia-Ortiz L, et al. Abdominal obesity vs general obesity for identifying arterial stiffness, subclinical atherosclerosis and wave relection in healthy, diabetics and hypertensive. BMC Cardiovasc Disord. 2012;12:3. PMid:22292502 PMCid:PMC3395841. http://dx.doi. org/10.1186/1471-2261-12-3
27. Wang Y, Ma X, Zhou M, Zong W, Zhang LYH, Zhu J, et al. Contribution of visceral fat accumulation to carotid intima-media thickness in a Chinese population. Int J Obes (Lond). 2012;36(9):51203-8. PMid:22124446 PMCid:PMC3448043. http://dx.doi.org/10.1038/ ijo.2011.222
28. Manios E, Michas F, Tsivgoulis G, Stamatelopoulos K, Tsagalis G, Koroboki E, et al. Impact of prehypertension on carotid artery intima–media thickening: Actual or masked? Atherosclerosis. 2011;214:215-9. PMid:21122854. http:// dx.doi.org/10.1016/j.atherosclerosis.2010.10.032 29. Mangge H, Schauenstein K, Stroedter L, Griesl A, Maerz
W, Borkenstein M. Low grade inlammation in juvenile
obesity and type 1 diabetes associated with early signs of atherosclerosis. Exper Clin Endocrinol Diabetes. 2004;112(7):378-82. PMid:15239023. http://dx.doi. org/10.1055/s-2004-821023
30. Arnaiz P, Acevedo M, Barja S, Aglony M, Guzmán B, Cassis B, et al. Adiponectin levels, cardiometabolic
risk fators and markers of subclinical atherosclerosis in
children. Int J Cardiol. 2008;138:138-44. PMid:18774612. http://dx.doi.org/10.1016/j.ijcard.2008.08.007
31. Mangge H, Almer G, Haj-Yahya S, Grandits N, Gasser R, Pilz S, et al. Nuchal thickness of subcutaneous adipose tissue is tightly associated with an increased LMW/total adiponectin ratio in obese juveniles. Atherosclerosis. 2009;203(1):277-83. PMid:18656877. http://dx.doi. org/10.1016/j.atherosclerosis.2008.06.013
32. Kelishadi R, Cook SR, Amrac B, Adibi A. Factors
associated with insulin resistance and non-alcoholic
fatty liver disease among youths. Atherosclerosis. 2009;204:538-43. PMid:19013572. http://dx.doi. org/10.1016/j.atherosclerosis.2008.09.034
33. Herouvi D, Karanasios E, Karayianni C, Karavanaki K. Cardiovascular disease in childhood: the role of obesity. Eur J Pediatr. 2013;172:721-32. PMid:23340698. http:// dx.doi.org/10.1007/s00431-013-1932-8
34. Higashi Y, Noma K, Yoshizumi M, Kihara Y. Endothelial
function and oxidative stress in cardiovascular diseases.
Circ J. 2009;73(3):411-8. PMid:19194043. http://dx.doi. org/10.1253/circj.CJ-08-1102
35. Jimenez MV, Estepa RM, Camacho RM, Estrada RC, Luna FG, Guitarte FB. Endothelial dysfunction is related to insulin resistance and inlammatory biomarker levels in obese prepubertal children. Eur J Endocrinol. 2007;156:497-502. PMid:17389466. http://dx.doi. org/10.1530/EJE-06-0662
36. Vanhoutte PM. Endothelial dysfunction: the irst step toward coronary arteriosclerosis. Circ J. 2009;73:7. http:// dx.doi.org/10.1253/circj.CJ-08-1169
37. Han SH, Sakuma I, Shin EK, Koh KK. Antiatherosclerotic
and anti-insulin resistance effects of adiponectin: basic and
clinical studies. Prog Cardiovasc Dis. 2009;52(2):126-40. PMid:19732605. http://dx.doi.org/10.1016/j. pcad.2009.06.004
38. Lee CD, Jae SY, Iribarren C, Pettee KK, Choi H. Physical itness and carotid atherosclerosis in men. Int J Sports Med. 2009;30:672-6. PMid:19569012. http://dx.doi. org/10.1055/s-0029-1224179
39. Thijssen DH, Cable NT, Green DJ. Impact of exercise training on arterial wall thickness in humans. Clin Sci (Lond). 2012;122(7):311-22. PMid:22150253 PMCid:3233305. http://dx.doi.org/10.1042/CS20110469 40. Kim ES, Park J-H, Lee MK, Lee DH, Kang ES, Lee
HC, et al. Associations between Fatness, Fitness, IGF and IMT among Obese Korean Male Adolescents. Diabetes Metab J. 2011;35(6):610-8. PMid:22247904 PMCid:PMC3253972. http://dx.doi.org/10.4093/ dmj.2011.35.6.610
41. Pahkala K, Laitinen TT, Heinonen OJ, Viikari JS, Ronnemaa T, Niinikoski H, et al. Association of itness with vascular
Pediatrics. 2013;132(1):e77-84. PMid:23753102. http:// dx.doi.org/10.1542/peds.2013-0041
42. Eisenmann JC, Welk GJ, Ihmels M, Dollmlan J. Fatness, itness, and cardiovascular disease risk factors in children and adolescents. Med Sci Sports Exerc. 2007;39(8):1251-7. PMid:17762357. http://dx.doi. org/10.1249/MSS.0b013e318064c8b0
43. Montero D, Walther G, Perez-Martin A, Roche E, Vinet A. Endothelial dysfunction, inlammation, and
oxidative stress in obese children and adolescents:
markers and effect of lifestyle intervention. Obes Rev. 2012;13:441-55. PMid:22133012. http://dx.doi. org/10.1111/j.1467-789X.2011.00956.x
Correspondence
Larissa R. Silva
Universidade Federal do Paraná Departmento de Educação Física
Travessa Coração de Maria, 92, BR 116, km 95, Jardim Botânico