Nota Técnica
*e-mail: [email protected]
ANALYTICAL PROCEDURES FOR DETERMINING Pb AND Sr ISOTOPIC COMPOSITIONS IN WATER SAMPLES BY ID-TIMS
Veridiana Martins*, Marly Babinski, Izabel Ruiz, Kei Sato e Solange Souza
Centro de Pesquisas Geocronológicas, Instituto de Geociências, Universidade de São Paulo, Rua do Lago, 562, 05508-080 São Paulo - SP, Brasil
Ricardo Hirata
Departamento de Geologia Sedimentar e Ambiental, Instituto de Geociências, Universidade de São Paulo, Rua do Lago, 562, 05508-080 São Paulo - SP, Brasil
Recebido em 10/5/07; aceito em 14/3/08; publicado na web em 26/9/08
Few articles deal with lead and strontium isotopic analysis of water samples. The aim of this study was to deine the chemical procedures for Pb and Sr isotopic analyses of groundwater samples from an urban sedimentary aquifer. Thirty lead and fourteen strontium isotopic analyses were performed to test different analytical procedures. Pb and Sr isotopic ratios as well as Sr concentration did not vary using different chemical procedures. However, the Pb concentrations were very dependent on the different procedures. Therefore, the choice of the best analytical procedure was based on the Pb results, which indicated a higher reproducibility from samples that had been iltered and acidiied before the evaporation, had their residues totally dissolved, and were puriied by ion chromatography using the Bioradcolumn. Our results showed no changes in Pb ratios with the storage time.
Keywords: Pb-Sr isotopes; groundwater; TIMS.
INTRODUCTION
The sustainable use of water is a highly important subject worldwide and the necessity of reducing water pollution and waste generation is of prime importance for the future of human kind. Despite the fact that surface reservoirs are the main sources of water provided by the public utility company in the Metropolitan Region of São Paulo, groundwater sources play an important role as alternative supply sources for private users, corresponding to 12% of the volume produced by the public company.1 Groundwater contamination is in-trinsically linked with its recharge.2 An understanding of the recharge processes is an important part of the assessment and management of water resources, providing for sustainable development of resource exploitation.3,4 Therefore, new analytical tools, capable of evaluating the origin and quality of groundwater recharge, are very useful to achieve this aim.5 Sr and Pb isotopes can be used as environmental indicators of water contamination and for possible identiication of its source,6-9 as they provide different isotopic signatures.
The use of isotopic techniques has been applied to identify re-charge sources and routesin groundwater studies for the last decade,3 but the majority of these deal with strontium, oxygen and hydrogen isotopes,10-21 whereas Pb is not often examined.22-26 Stable isotopes (O and H) are considered as water isotopes, tracing the source and pathway of water molecules, while radiogenic isotopes (Sr and Pb) are solute isotopes, and trace the source and pathway of dissolved ions in the hydrologic cycle.17,25 Some authors use isotopes to investigate atmospheric emissions,26,27 sediments28,29 and rain/snow,9,30-33 and others analyze supericial or sub-supericial waters34 with higher Sr and Pb concentrations.34-36
This paper is focused on urban groundwater that has pH values ranging from 5 to 7 and contains some suspended material. There are currently no articles in the literature about Pb isotope determination by ID-TIMS (isotope dilution and thermal ionization mass
spectro-meter) in groundwater from an urban sedimentary aquifer. Thus a new analytical procedure was developed in order to analyze this type of water samples at the Center of Geochronological Research (Centro de Pesquisas Geocronológicas – CPGeo), Geoscience Institute at the University of São Paulo. This paper also discusses the effects of iltration, acidiication and storage time for Sr and Pb isotopic analyses in water samples from a sedimentary aquifer. Many experiments were carried out in order to deine the best analytical procedure.
The advantage of using radiogenic isotopes is that they do not fractionate in the environment because the isotopic composition re-mains constant as Sr or Pb are removed from the aqueous environment through precipitation or cationic exchange.16 Neither weathering nor biological processes fractionate radiogenic isotopes.37 Therefore, Sr and Pb isotopes can provide information about the solute sources, indicating whether they are anthropogenic or natural.7
The groundwater isotopic composition is controlled by the che-mical composition of the aquifer rocks as well as their ages,25 the rain, and leakage from pipes. The high precision of isotopic analysis permits the identiication of small differences in the isotopic ratios and concentrations, which then characterizes different groundwater sources.
beams are collected in the ion collectors where they are neutralized by electrons that pass through a resistor. The voltage difference in the resistor is ampliied and measured, providing resulting signals consisting of a series of peaks and valleys that form the spectrum of the element.38 It is very important to purify the element to be analyzed using ion exchange separation techniques to avoid isobaric interferences in the mass spectra.39,40
Inductively Coupled Plasma Mass Spectrometry (ICP-MS) is a technique capable of determining concentration and isotope ratios faster than ID-TIMS, and represents an alternative method for studies that do not require high precision results.
STUDY AREA
São Paulo city developed microclimates due to urbanization problems such as air pollution and deforestation. The humid tropical climate is characterized by two distinct seasons: spring/summer (hot and humid), and autumn/winter (cold and dry). The mean precipitation is 1400 mm per year, with the largest proportion occurring in the sum-mer months (January, February and March). The mean temperature varies from 17 ºC in the winter to 23 ºC in the summer. These means are higher in regions with a higher population density and can vary 5 ºC at different points in the city at the same time.41
The Metropolitan Region of São Paulo is located within the Upper Tietê Watershed (UTW). The Tietê river is the main watercourse of the UTW, which also comprises some important tributaries such as the Pinheiros, Tamanduateí, and Cabuçu rivers.41
The samples were all collected in the same well, located at the Geoscience Institute, at the Campus of the University of São Paulo (USP), with coordinates 46.733ºW and 23.559ºS. It is approximately 2.5 km away from the Pinheiros River.
The well, named P2G, is 50 m deep and extracts water from Ter-tiary sedimentary rocks present in the São Paulo Sedimentary Basin. In general, these sediments are composed of sandstone, siltstone, argillite and conglomerates. The water has mean values of 5.8 (pH), 358.4 mV (Eh), 33.85 µS cm-1 (Electric conductivity) and 24.3 ºC (temperature). The average ionic composition of the water for major ions is (mg L-1): 13.44 (HCO
3-), 0.47 (SO42-), 3.52 (Cl-), 1.64 (Ca2+), 2.71 (Na+), 0.74 (Mg2+), 2.98 (K+), indicating a Na-Ca-K-HCO
3-Cl water type. The mean compositions for other ions are (mg L-1): 0.61 (NO3-), 0.07 (F-), 0.33 (Fe), 0.31 (Al) and 0.12 (Ba). The dissolved silica concentration has a mean composition of 16.4 mg L-1. Dif-ferences in the electroneutrality of the six samples analyzed were lower than 5%.
The Campus of the University of São Paulo has a low population density and is rich in vegetation compared to others districts in the city. The P2G well was selected due to: its particulate contents are similar to other wells that have been analyzed in another project dealing with aquifer recharge in the UTW42 and its low vulnerability to the inlu-ence of contaminants brought by rainfall events or leakages.
ANALYTICAL EXPERIMENTS
The National Field Manual for the Collection of Water-Quality Data43 describes protocols and provides guidelines for national sur-face and groundwater quality assessment. For isotope analysis, it is recommended that the water sample be iltered into polysulfone ilter media with a 0.45 µm pore size membrane.44
Other authors8,30,45,46 have also recommend acidifying the water samples with suprapur HNO3 to pH<2. Bank et al.35 also examines the effect of iltration on surface water analysis. In this case, samples have a high pH and high particulate content. Another work by Bank36 about the effects of iltration deals with a crystalline aquifer whose water
has low particulate contents, and no isotope analyses were done. Water samples were collected in low-density polyethylene (LDPE; Nalgon) bottles of 500 mL capacity, which were previously cleaned47 as follows: bottles were washed with deionized water using MilliQ equipment from Millipore (herein named H
2O MQ) and weak detergent; ca. 50 mL of an acid mixture of 25% HCl+HNO3 was added to the bottles and heated on a hot plate at 40 ºC for 2 days (one day in an upright and the next day in an upside down position). After that, they were left for two days (one day in an upright and in the day after in an upside down position) resting in an exhaustion hood. The bottles were then rinsed three times with H2O MQ; ca. 50 mL of 25% HCl was added to the bottles and they were heated on a hot plate (40 ºC) for 2 days (one day in an upright position and the day after in an upside down position). After the bottles had sat for 2 days in an exhaust hood, the solutions were discarded and the bottles were rinsed three times with H2O MQ; bottles were illed with 1% suprapure nitric acid and sealed until use; just before sampling, the solutions were discarded and the bottles were rinsed three times with H2O MQ, dried in a class-100 clean bench under laminar low and sealed.
During ield sampling, bottles were rinsed three times with sample water before collection. Filtration was done less than 10 h after col-lection48 at the laboratory using the class-100 laminar low hood.
Some samples were iltered using an acid cleaned polysulfone ilter holder with receiver (Nalgene), with capacity of 500 mL, con-nected to a vacuum line. The ilters were cellulose acetate membrane (Millipore) with a 0.45 µm pore size and 47 mm diameter. This pro-cedure was also done to determine the inluence of suspended material on the chemical composition of the water and its isotopic ratios.
After emptying the bottle for water sample iltration and before transferring the iltered water back to the same bottle, it was rinsed twice with H2O MQ and once with the iltered water sample. After iltration, some samples were acidiied to pH<2 with ultrapure 50% HNO3 to avoid cation precipitation, and some bottles were stored at 4-10 ºC to guarantee that no chemical reactions occurred.
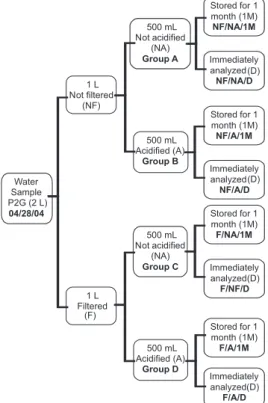
In order to deine the analytical procedure, half of the collected samples were iltered (F) and half were not (NF). In addition, half of the iltered samples were acidiied (A) and half were not (NA). The same procedure was performed on uniltered samples. Then, each sample (F/A, F/NA, NF/A, NF/NA) was divided into two, one for immediate analysis (D) and the other for storage in the refrigerator (4 ºC) for approximately one month (1 M). This stage generated eight samples (Table 1 and Figure 1) plus their duplicates, 16 samples in total.
Additional samples (Table 1 and Figure 2) were prepared in order to evaluate the residue chemical dissolution procedure, the ion exchange resin column type and the mass of water used in the experiments.
PREPARATION OF THE WATER SAMPLE
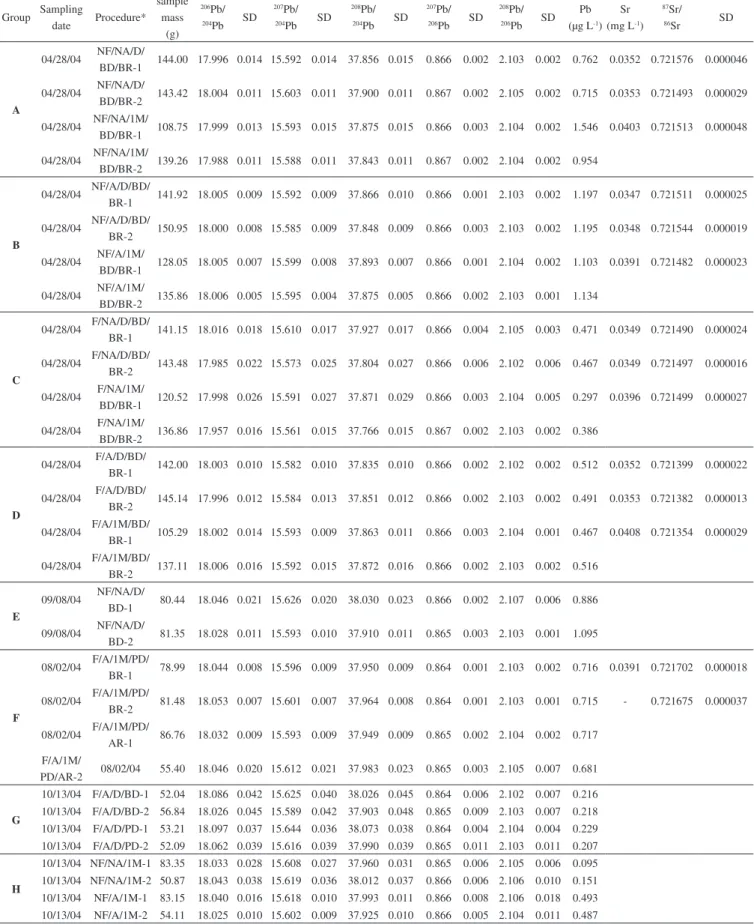
Table 1. Pb and Sr isotopic analyses results from groundwater samples (well P2G)
Group Sampling
date Procedure*
sample mass
(g)
206Pb/ 204Pb SD
207Pb/ 204Pb SD
208Pb/ 204Pb SD
207Pb/ 206Pb SD
208Pb/ 206Pb SD
Pb
(µg L-1)
Sr
(mg L-1)
87Sr/ 86Sr SD
A
04/28/04 NF/NA/D/
BD/BR-1 144.00 17.996 0.014 15.592 0.014 37.856 0.015 0.866 0.002 2.103 0.002 0.762 0.0352 0.721576 0.000046
04/28/04 NF/NA/D/
BD/BR-2 143.42 18.004 0.011 15.603 0.011 37.900 0.011 0.867 0.002 2.105 0.002 0.715 0.0353 0.721493 0.000029
04/28/04 NF/NA/1M/
BD/BR-1 108.75 17.999 0.013 15.593 0.015 37.875 0.015 0.866 0.003 2.104 0.002 1.546 0.0403 0.721513 0.000048
04/28/04 NF/NA/1M/
BD/BR-2 139.26 17.988 0.011 15.588 0.011 37.843 0.011 0.867 0.002 2.104 0.002 0.954
B
04/28/04 NF/A/D/BD/
BR-1 141.92 18.005 0.009 15.592 0.009 37.866 0.010 0.866 0.001 2.103 0.002 1.197 0.0347 0.721511 0.000025
04/28/04 NF/A/D/BD/
BR-2 150.95 18.000 0.008 15.585 0.009 37.848 0.009 0.866 0.003 2.103 0.002 1.195 0.0348 0.721544 0.000019
04/28/04 NF/A/1M/
BD/BR-1 128.05 18.005 0.007 15.599 0.008 37.893 0.007 0.866 0.001 2.104 0.002 1.103 0.0391 0.721482 0.000023
04/28/04 NF/A/1M/
BD/BR-2 135.86 18.006 0.005 15.595 0.004 37.875 0.005 0.866 0.002 2.103 0.001 1.134
C
04/28/04 F/NA/D/BD/
BR-1 141.15 18.016 0.018 15.610 0.017 37.927 0.017 0.866 0.004 2.105 0.003 0.471 0.0349 0.721490 0.000024
04/28/04 F/NA/D/BD/
BR-2 143.48 17.985 0.022 15.573 0.025 37.804 0.027 0.866 0.006 2.102 0.006 0.467 0.0349 0.721497 0.000016
04/28/04 F/NA/1M/
BD/BR-1 120.52 17.998 0.026 15.591 0.027 37.871 0.029 0.866 0.003 2.104 0.005 0.297 0.0396 0.721499 0.000027
04/28/04 F/NA/1M/
BD/BR-2 136.86 17.957 0.016 15.561 0.015 37.766 0.015 0.867 0.002 2.103 0.002 0.386
D
04/28/04 F/A/D/BD/
BR-1 142.00 18.003 0.010 15.582 0.010 37.835 0.010 0.866 0.002 2.102 0.002 0.512 0.0352 0.721399 0.000022
04/28/04 F/A/D/BD/
BR-2 145.14 17.996 0.012 15.584 0.013 37.851 0.012 0.866 0.002 2.103 0.002 0.491 0.0353 0.721382 0.000013
04/28/04 F/A/1M/BD/
BR-1 105.29 18.002 0.014 15.593 0.009 37.863 0.011 0.866 0.003 2.104 0.001 0.467 0.0408 0.721354 0.000029
04/28/04 F/A/1M/BD/
BR-2 137.11 18.006 0.016 15.592 0.015 37.872 0.016 0.866 0.002 2.103 0.002 0.516
E
09/08/04 NF/NA/D/
BD-1 80.44 18.046 0.021 15.626 0.020 38.030 0.023 0.866 0.002 2.107 0.006 0.886
09/08/04 NF/NA/D/
BD-2 81.35 18.028 0.011 15.593 0.010 37.910 0.011 0.865 0.003 2.103 0.001 1.095
F
08/02/04 F/A/1M/PD/
BR-1 78.99 18.044 0.008 15.596 0.009 37.950 0.009 0.864 0.001 2.103 0.002 0.716 0.0391 0.721702 0.000018
08/02/04 F/A/1M/PD/
BR-2 81.48 18.053 0.007 15.601 0.007 37.964 0.008 0.864 0.001 2.103 0.001 0.715 - 0.721675 0.000037
08/02/04 F/A/1M/PD/
AR-1 86.76 18.032 0.009 15.593 0.009 37.949 0.009 0.865 0.002 2.104 0.002 0.717
F/A/1M/
PD/AR-2 08/02/04 55.40 18.046 0.020 15.612 0.021 37.983 0.023 0.865 0.003 2.105 0.007 0.681
G
10/13/04 F/A/D/BD-1 52.04 18.086 0.042 15.625 0.040 38.026 0.045 0.864 0.006 2.102 0.007 0.216
10/13/04 F/A/D/BD-2 56.84 18.026 0.045 15.589 0.042 37.903 0.048 0.865 0.009 2.103 0.007 0.218
10/13/04 F/A/D/PD-1 53.21 18.097 0.037 15.644 0.036 38.073 0.038 0.864 0.004 2.104 0.004 0.229
10/13/04 F/A/D/PD-2 52.09 18.062 0.039 15.616 0.039 37.990 0.039 0.865 0.011 2.103 0.011 0.207
H
10/13/04 NF/NA/1M-1 83.35 18.033 0.028 15.608 0.027 37.960 0.031 0.865 0.006 2.105 0.006 0.095
10/13/04 NF/NA/1M-2 50.87 18.043 0.038 15.619 0.036 38.012 0.037 0.866 0.006 2.106 0.010 0.151
10/13/04 NF/A/1M-1 83.15 18.040 0.016 15.618 0.010 37.993 0.011 0.866 0.008 2.106 0.018 0.493
10/13/04 NF/A/1M-2 54.11 18.025 0.010 15.602 0.009 37.925 0.010 0.866 0.005 2.104 0.011 0.487
IC); addition of 1 mL of 0.7N HBr to the residues; and puriication of Pb by the ionic exchange technique.
The second dissolution technique is a Partial Dissolution (PD), which does not include HF+HNO3 dissolution: evaporation of the sample at 80 ºC in a precleaned savillex; addition of 5 mL of 0.7N
HBr to the residue and heating for 24 h at 100 ºC; transferring of the solution (IC) to a previously weighted savillex; aliquot separation (15% of total IC solution) for isotopic dilution; addition of ca. 10 µL of 208Pb spike to the ID aliquot; evaporation of solutions (DI and IC); addition of 1 mL of 0.7N HBr to the residues; and puriication of Pb by the ionic exchange technique.
The BD procedure dissolves all materials, including silicates, oxides, organic matter and carbonates. In constrast, the PD procedure where only HBr is used to digest the residue, the silicates were not dissolved.
Two types of ion exchange columns (Figure 3) were tested for Pb analyses: Biorad, made of polyethylene and illed with a Biorad AG1-X8 (200-400 mesh) chloride form resin (ca. 35 µL); and a hand-made retractil Telon microcolumn illed with the same resin.
Tests to assess the amount of water needed for the chemical preparation were also performed. Samples with two different weights, approximately 80 g (Groups E, F, G and H) and 150 g (Groups A, B, C and D), were analyzed. The capacity of the savillex used was 60 or 90 mL, so the more sample needed, the more stages were neces-sary to evaporate it.
The chemical digestion of the residue for strontium isotopic analyses was the same as the Pb analyses (steps a to f, BD and a to c, PD). After the last step, 1 mL of solution was separated to add 20 µL of 84Sr spike (ID aliquot). After evaporation, 1 mL of 2 M HNO
3 was added to each aliquot (ID and IC).
The ion exchange columns used for Sr isotopic (Figure 4) analyses were handmade retractile Telon columns with Sr spec resin (Eichrom non-ionic ester polymer resin, 100-150 mesh). Because there was no established routine for Sr analyses using this resin, at CPGeo, some experiments were performed in order to deine the amount of resin necessary to obtain a good Sr puriication and the best yield. The procedure was modiied from the work of Deniel and Pin49 on silicate samples and redeined (by tests) for water samples. It consists of: illing the columns with 80 mg of resin; pre-cleaning the resin with 20 mL of 6M HCl; conversion with 2.2 mL of 0.05 M HNO3; conditioning with 0.3 mL 2 M HNO3; deposition of 1 mL of the sample; conditioning with 0.4 mL of 2M HNO3; Ba elution with 1.6 mL of 7M HNO3; Sr collection with 3 mL of 0.5 M HNO3. An unstable and/or low beam was obtained in the mass-spectrometer if less than 80 mg of resin were used.
The Pb spike used here had a 208Pb/206Pb ratio of 20,000 and Figure 1. Diagram showing the different steps used for the water sample
preparation (groups A, B, C and D) in order to deine the best analytical procedure. All samples were dried, and the residue was acid digested. The solutions were puriied by an ion exchange technique using a Biorad column. All samples were collected in the same day
Figure 2. Diagram showing the different chemical experiments used for water sample preparation (groups E, F, G and H) in order to deine the best analytical procedures. The samples from these groups were collected during 3 different months
208Pb concentrations of 0.5441 ppm. The 84Sr spike concentration was 0.727937 ppm and its isotopic ratios were: 86Sr/84Sr= 0.044260, 87Sr/84Sr = 0.018679 and 88Sr/84Sr = 0.148794.
After Sr and Pb puriication through the ion exchange columns, 5 and 1 µL of H3PO4 (0.1N), respectively, were added to the solutions and then evaporated. For Pb analyses, 2 µL of the sample was loaded onto a degassed Re ilament after mixing it with silicagel of saturated concentration. The Sr samples were loaded onto a degassed tantalum ilament and then analyzed.
Lead isotopic ratios were measured in a VG354 multi-collector mass spectrometer. For Pb analyses, the Faraday multi-collector in the static mode was used instead of the Daly Detector because it had the best analytical reproducibility. Because the Pb concentrations in the samples were very low (0.10 – 1.5 ppb), more than 50 mL of water was necessary to obtain good precision. Corrections for mass fractionation and the bias factor were based on the NBS 981 stan-dard. The mean annual values (100 determinations), with 1 sigma standard deviation, obtained for the standard after the correction were: 207Pb/206Pb = 0.91464 ± 0.00010; 208Pb/206Pb = 2.1680 ± 0.0010. All 206Pb/204Pb, 207Pb/204Pb and 207Pb/206Pb ratios were corrected for an isotopic fractionation of 0.11% a.m.u-1 (atomic mass unit), whereas the 208Pb/204Pb was corrected for an isotopic fractionation of 0.07% a.m.u-1 and 208Pb/206Pb for 0.0035% u.m.a-1. Total Pb analytical blanks were 40 pg, representing less than 0.5% of the total Pb in the water samples.
Strontium isotopic ratios were measured in a VG354 mono-collector mass spectrometer. To compensate for its lower precision, 100 ratios were measured for each sample. Corrections for mass frac-tionation were based on 86Sr/88Sr = 0.1194. The mean annual value of the NBS 987 standard, with 2 sigma standard deviation, was: 87Sr/86Sr = 0.71024±0.00007. Total Sr analytical blanks were 2.4 ng.
RESULTS AND DISCUSSION
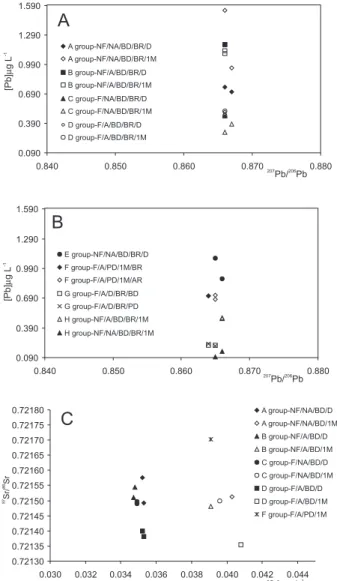
Thirty lead isotopic analyses (Table 1, Figures 5A and 5B) and fourteen strontium isotopic analyses (Table 1 and Figure 5C) were carried out to test the different analytical procedures.
Figures 5A, B, and C present the results divided into eight groups (A, B, C, D, E, F, G, and H) according to the different procedures. Groups A, B, C, and D (Figure 1) correspond to the same sample which was split into 16 parts for comparison of results. Groups E, F, G, and H (Figure 2) correspond to samples collected at different dates
(they are not the same sample) and analyzed individually; consequen-tly, comparisons between these groups (E, F, G and H) should not be made. Each group (A, B, C, D) corresponds to the same procedure, with results from samples analyzed on the same day of and 28 days after sampling, plus their duplicates.
Group E was analyzed using the same chemical procedure as group A, but with less sample quantity (ca. 80 g for group E and ca. 140 g for group A). Group F, also using less sample quantity (50-80 g), corresponds to different Pb puriication procedures. Group G compares the results of two different chemical dissolutions of the residue, and group H compares acidiied and non-acidiied samples that were stored for 28 days in the refrigerator.
As observed in Figures 5A and 5B, Pb isotopic ratios do not differ when the chemical procedure is modiied, but the Pb concentration does. The variations in isotopic ratios are ca 5% and ca 80% on the Pb concentrations. The same behavior was previously observed in rain samples.32,33
Group B presented higher Pb concentrations, probably because its samples had incorporated Pb from the suspended matter as they were acidiied, but not iltered. The results for Group C show that Figure 4. The ion exchange columns used for Sr isotopic analyses were
han-dmade retractile Telon columns illed with Sr Spec resin (Eichrom non-ionic ester polymer resin, 100-150 mesh). For optimal Sr puriication and the best yield, 80 mg of resin are necessary
without acidiication, the concentration decreases, probably due to either Pb adsorption into the walls of the bottles or precipitation. As long as the sample is stored in the refrigerator, the probability of lead adsorption or precipitation in non-acidiied samples increases (Table 1). The uniltered samples (groups A and B) presented an anomalous behavior, probably due to some colloid formation. Samples stored in the refrigerator for 28 days, from groups A, B and C, presented very different concentrations from those obtained from samples analyzed on the day of collection. The best results were from group D, because their results (isotopic ratios and concentrations) were more homoge-nous and had better reproducibility. Group D samples also relected the water composition, because acidiication prevents Pb precipitation and/or its adsorption into the walls of bottles, and iltering inhibits mixing of Pb from the suspended material with the Pb dissolved in the water sample, in the case of acidiied samples.
Group E samples (less sample quantity was evaporated) did not present good reproducibility and had higher standard deviations. Group F shows that the Biorad column results has better reprodu-cibility than the microcolumn, due to different lux velocities and interactions of the sample-resin. Pb puriication was optimal when samples were loaded onto the resin slowly, resulting in a more effecti-ve ion exchange. Group G demonstrates that samples whose residues underwent partial dissolution did not have good reproducibility, probably because the silicate phase was not dissolved.
Sr isotopic ratios presented small variations between the maximum and minimum values of (0.05%), which are lower than the analytical standard deviations. Larger variations were observed for the Sr concen-trations (15%), as already described in the literature.7,25 All Sr isotopic concentrations increased 5-10% after storage in the refrigerator for a month. Filtered samples presented smaller differences between original and duplicate (high reproducibility) Sr concentrations. There was not much difference (<1% for concentrations and <0.015% for isotopic ratios) between iltered/acidiied and iltered/non-acidiied samples.
The different diameter size of the two types of ion exchange co-lumns allows for different lux velocities. The Pb puriication process takes less time using the microcolumn than the Biorad columns, which are larger. However, the results indicate that the puriication process using the microcolumn is less effective and, consequently, the beam is less stable during mass spectrometer analysis. This instability could be responsible for the larger standard deviations obtained for those samples puriied in microcolumns.
CONCLUSIONS
Pb and Sr isotopic ratios and Sr concentrations do not present lar-ge variations despite the differences in the procedures applied during sampling and chemical preparation of the water samples. In contrast, Pb concentrations vary depending on these techniques, implying that the chosen analytical procedures have to be based on Pb results.
Our results show that in order to obtain better reproducibility, the samples have to be: iltered, avoiding mixtures between suspended matter and water compositions; acidiied; the residue has to be sub-mitted to bulk dissolution; and loaded onto a Biorad column because of its eficient Pb puriication. This procedure is validated by the high correlation factor (0.99) obtained between samples analyzed by ID-TIMS and ICP-MS for Sr concentrations.50
There was no signiicant difference between the results for the two mass evaporated water samples, if we consider the same chemi-cal procedure used. As the savillex capacity is 90 mL, a volume of approximately 80 mL will take only one stage to evaporate, limiting the exposure of the sample to contamination.
Examination of a delay time before analysis (on the same day or after 28 days) did not show signiicant differences in the results if the
samples were iltered and acidiied. This is very important due to the fact that most projects analyzing water samples involve storage in the refrigerator, either because of the distance between the lab and ield or the great volume of analyses to be done in the lab.
ACKNNOWLEDGMENTS
The authors would like to thank the inancial support (Proc. No. 02/07202-3) and the PhD scholarship (Proc. No. 04/05360-6) given by FAPESP (Fundação de Amparo à Pesquisa do Estado de São Paulo). We also thank the reviewers for their interesting criticism and suggestion, which contributed to improve the original manuscript.
REFERENCES
1. Hirata, R.; Ferrari, L.; Ferreira, L.; Pede, M.; Bol. Geol. Minero2002,
113, 273.
2. Foster, S.; Hirata, R.; WHO/PAHO – CEPIS Technical Report, Lima, Peru, 1988.
3. Scanlon, B. R.; Healy, R. W.; Cook, P.G.; Hydrog. J.2002, 10, 18. 4. Taylor, R. G.; Howard,K. W. F.; J. Hydrol. 1996, 180, 31.
5. Lerner, D. N.; Hydrogeol. J.2002, 10, 143.
6. Charalampides, G.; Manoliadis, O.; Environ. Int.2002, 28, 147.
7. Gosselin, D. C.; Harvey, F. E.; Frost, C.; Stotler, R.; Macfarlane, P. A.;
Appl. Geochem.2004, 19, 359.
8. Ojiambo, S. B.; Lyons, W. B.; Welch, K. A.; Poreda, R. J.; Johannesson, K. H.; Appl. Geochem.2003, 18, 1789.
9. Luck, J. M.; Ben Othman, D.; Chem. Geol.2002, 182, 443.
10. Barbieri, M.; Boschetti, T.; Petitta, M.; Tallini, M.; Appl. Geochem. 2005, 20, 2063.
11. Barrett, M. H.; Hiscock, K. M.; Pedley, S.; Lerner, D. N.; Tellam, J. H.; French, M. J.; Water Res.1999, 33, 3083.
12. Williams, A. E.; J. Hydrol.1997, 201, 230.
13. Abbott, M. D.; Lini, A.; Bierman, P. R.; J. Hydrol.2000, 228, 101. 14. Darling, W. G.; Bath, A. H.; J. Hydrol.1988, 101, 31.
15. Frost, C. D.; Pearson, B. N.; Ogle, K. M.; Heffern, E. L.; Lyman, R. M.;
Geology2002, 30, 923.
16. Frost, C. D.; Toner, R. N.; Ground-Water2004, 42, 418.
17. Bullen, T.D.; Kendall, C.In Isotope Tracers in Catchment Hydrology; Kendall, C.; McDonnell, J. J., eds.; Elsevier Science B.V.: Amsterdam, 1998, chap 18.
18. Huddart, P. A.; Longstaffe, F. J.; Crowe, A. S.; J. Hydrol.1999, 214, 18.
19. Johnson, T. M.; Roback, R. C.; Mcling, T. L.; Bullen, T. D.; Depaolo, D. J.; Doughty, C.; Hunt, R. J.; Smith, R. W.; De Wayne, C. L.; Murrell, M. T.; Geology2000, 28, 871.
20. O’driscoll, M. A.; Dewalle, D. R.; Mcguire, K. J.; Gburek, W. J.; J. Hydrol.2005, 303, 108.
21. Taylor, R. G.; Howard,K. W. F.; J. Hydrol.1996, 180, 31.
22. Erel, Y.; Environ. Res.Section A1998, 78, 112.
23. Erel, Y., Patterson, C. C., Scott, M. J., Morgan, J. J.; Chem. Geol. 1990,
85, 383.
24. Siegel, D. I.; Bickford, M. E.; Orrell, S. E.; Appl. Geochem.2000, 15,
493.
25. Banner, J. L.; Earth Science Reviews 2004, 65, 141.
26. Åberg, G.; Pacynia, J. M.; Stray, H.; Skjelkvale, B. L.; Atmos. Environ. 1999, 33, 3335.
27. Veron, A.; Flament, P.; Bertho, M. L.; Alleman, L.; Flegal, R.; Hamelin, B.; Atmos. Environ.1999, 33, 3377.
28. Steinmann, M.; Stille, P.; Appl. Geochem.1997, 12, 607.
29. Hinrichs, J.; Dellwig, O.; Brumsack, H. J.; Appl. Geochem.2002, 17,
621.
K.; Atmos. Environ.2000, 34, 4525.
31. Aquilina, L.; Ladouche, B.; Dörliger, N.; Appl. Geochem.2005, 20, 2189.
32. Aily, C.; Master Thesis, São Paulo University, Brasil, 2001. 33. Babinski, M.; Aily, C.; Ruiz, I. R.; Sato, K.; J. Phys.2003, 107, 87.
34. Bordalo, A. O.; Moura, C. A. V.; Scheller, T.; Quim Nova2007, 30, 821. 35. Banks, D.; Markland, H.; Smith, P.; Mendez, C.; Rodriguez, J.; Huerta,
A.; Saether, O. M.; J. Geochem. Expl.2005, 86, 104.
36. Banks, D.; Hall, G. E. M.; Reimann, C.; Siewers, U.; Appl. Geochem. 1999, 14, 27.
37. Capo, R. C.; Stewart, B. W.; Chadwick, O. A.; Geoderma1998, 82,
197.
38. Faure, G.; Mensing, T. M.; Isotopes: principles and applications, 3rd ed., John Wiley and Sons: New Jersey, 2005.
39. Potts, P. J.; A Handbook of Silicate Rock Analysis, Blackie Academic &
Professional: London, 1987.
40. Dickin, A. P.; Radiogenic Isotope Geology, Cambridge University Press:
Cambridge, 1997.
41. PMSP-SVMA-IPT; GEO cidade de São Paulo: panorama do meio
ambiente urbano, PNUMA: Brasília, 2004.
42. Martins, V. T. S.; PhD Dissertation, São Paulo University, Brazil, in
progress, unpublished.
43. USGS; Handbook Water-Research Investigation, Book 9, United States
Geological Survey, Ofice of Water Quality, 2004.
44. Wilde, F. D.; Radtke, D. B.; Gibs, J.; Iwatsubo, R. T.; National Field manual for the collection of water-quality data, United States Geologi-cal Survey, 2004.
45. Petelet, E.; Luck, J-M.; Ben Othman, D.; Negrel, P.; Aquilina, L.; Chem. Geol.1998, 150, 63.
46. Widerlund, A.; Roos, P.; Gunneriusson, L.; Ingri, J.; Holmström, H.;
Chem. Geol.2002, 189, 183.
47. Patterson, C.; Science1974, 183, 553.
48. Goldstein, S. J.; Jacobsen, S. B.; Chem. Geol. 1987, 66, 245.
49. Deniel, C.; Pin, C.; Anal. Chim Acta2001, 426, 95.