Article
Printed in Brazil - ©2015 Sociedade Brasileira de Química0103 - 5053 $6.00+0.00
A
*e-mail: [email protected]; [email protected]
Application of Bar Adsorptive Microextraction-Large-Volume Injection-Gas
Chromatography-Mass Spectrometric Method for the Determination of Trace
Levels of Agrochemicals in Real Matrices
João R. Bernarda, Samir M. Ahmad, Carlos Almeida, Nuno R. Neng* and José Manuel F. Nogueira*
Centro de Química e Bioquímica, Faculdade de Ciências, Universidade de Lisboa, 1749-016 Lisboa, Portugal
Bar adsorptive microextraction followed by liquid desorption in combination with large volume injection gas chromatography coupled to mass spectrometry, under selected ion monitoring mode acquisition (BAµE-LD/LVI-GC-MS(SIM)), was applied for the determination of trace levels of different classes of agrochemicals (using alachlor, diniconazole, fenpropathrin, as well as cis
and trans-permethrin as model compounds) in environmental water and wine matrices. Assays
performed on 25 mL of ultra-pure water samples spiked at the 2.0 µg L-1 level, yielded recoveries ranging from 55.2 to 105.6%, under optimized experimental conditions. The analytical performance showed convenient detection limits (8.0 to 32.0 ng L-1) and good linear dynamic ranges (0.03 to 4.00 µg L-1), with remarkable determination coefficients (r2> 0.9982). Excellent repeatability, based in relative standard deviation (RSD) was also achieved through intraday (RSD < 7.5%) and interday (RSD < 7.0%) assays. Studies performed on surface and ground water, as well as wine samples, using the standard addition method, revealed good sensitivity at the trace level.
Keywords: agrochemicals, BAµE, environmental water and wine matrices, LVI-GC-MS,
trace analysis
Introduction
The use of agrochemicals is almost as old as agriculture.1 The industrialized countries, since the 60’s, saw the process of agriculture modernization due to the development of new technologies, many of them based on the intensive use of agrochemicals, such as chloroacetanilides, organochlorines, azoles, organophosphates, pyrethroids, carbamates and many other classes.2 For this reason, any environmental and food sample is susceptible to contain pesticide residues because they are widely dispersed in their application areas, reaching the environment and food chain.3 As a result, people, fauna and flora are exposed to agrochemical residues from low to high concentrations through the environment, their diets, etc. Moreover, new alarming data regarding the persistency, effects and the real concentrations of these compounds in the environment have emerged.4,5 Additionally, some of these compounds are extensively applied in grapevines, mainly for fungus control, and can be found simultaneously in wine samples.6
Thus, the information about the concentration and fate of these pollutants in the environment is urgently needed, as well as, analytical methods for a rapid, sensitive and selective determination in water and food matrices are required.
SBSE) once allows to select the most convenient sorbent coating (e.g., activated carbons (ACs), polymers (Ps), etc.) for each particular type of target compound, which has shown high effectiveness in many applications.8,11-15 The present contribution, aims to evaluate the performance of BAµE prior to large volume injection-gas chromatography coupled to mass spectrometry operating in selected-ion monitoring acquisition mode (LVI-GC-MS(SIM)), to monitor trace levels of five agrochemicals (alachlor, diniconazole, fenpropathrin, and cis- and trans-permethrin)
in environmental water and wine matrices. These compounds belong to different classes of pesticides, namely chloroacetanilide herbicides, azole fungicides and pyrethroid insecticides. The optimization of the analytical procedure, including the selectivity and interaction mechanisms with the sorbent phases tested, as well as the influence of several experimental parameters are fully discussed. The validation and application of the optimized methodology in water and wine matrices is also addressed.
Experimental
Standards, materials and samples
All standards were of analytical grade and used with no further purification. The analytical standards alachlor (ALA, 99.7%), diniconazole (DIN, 99.1%), fenpropathrin (FEN, 98.1%) and permethrin (PERM,
cis- and trans-isomers mixture, 94.4%) were purchased
from Riedel-de Haën (Germany). The solvents used were HPLC-grade, methanol (MeOH, 99.8%) and acetonitrile (ACN, 99.8%) obtained from Carlo Erba (Italy). Sodium chloride (NaCl, 99.9%) was purchased from Merck Millipore (Germany) and sodium hydroxide (NaOH, 98.0%) pellets purchased from AnalaR BDH (U.K). Hydrochloric acid (HCl, 37%) was purchased from Panreac (Spain). Ultra-pure water was obtained from Milli-Q water purification system (Merck Millipore, U.S.A.). The polystyrene-divinylbenzene (PS-DVB) polymer SDB-L (P, particle size 100 µm, pore size 260 Å and surface area 500 m2 g-1), presenting pH stability between 0 and 14, was obtained from Phenomenex (U.S.A.). The commercial ACs, i.e., CA1 (AC1, surface area 1,400 m2 g-1 and pH
PZC 2.2), CN1 (AC2, surface area 1,400 m2 g-1 and pHPZC 6.4) and SX1 (AC3, surface area 900 m2 g-1 and pH
PZC 8.4) were supplied by Salmon & Cia (Portugal), where pHPZC is defined as the pH of point of zero charge. Stock solutions of individual agrochemicals (1,000 mg L-1) used for the working standard mixture were prepared in ACN, stored at −20 oC and renewed every month. For instrumental calibration, standard
mixtures were prepared in ACN by appropriate dilution of the previous stock solutions. Solution of NaOH (0.1 mol L-1) and HCl (0.1 mol L-1) were used for pH adjustments. The surface and ground water samples were collected from Alviela river and in a hole in the region of Santarém (Portugal), respectively. The red wine sample was obtained from a local producer in the same region.
BAµE-LD assays
Instrumental set-up
LVI-GC-MS(SIM) analysis was performed using an Agilent 6890 Series gas chromatograph equipped with an Agilent 7683 automatic liquid sampler coupled to an Agilent 5973N mass selective detector (Agilent Technologies, U.S.A.). A programmed temperature vaporization (PTV) injector with a liner filled with glass wool and liquid nitrogen used as inlet cooling was used operating under solvent-vent mode injection (vent time: 0.30 min; flow: 50 mL min-1; pressure: 0 psi; purge flow: 60 mL min-1 at 2 min). The inlet temperature was programmed from 60 oC (0.35 min) to 320 oC (3 min isothermal) at a rate of 600 oC min-1 and subsequently decreased to 200 oC (held until end) at a rate of 50 oC min-1. The injection volume and speed were 20 µL and 100 µL min-1, respectively. The GC analysis was performed on an TRB-5MS (30 m × 0.25 mm, 0.25 µm film thickness) capillary column (5% diphenyl, 95% dimethylpolysiloxane; Teknokroma, Spain) using helium as the carrier gas maintained in a constant-pressure mode (40 cm s-1). The oven temperature was programmed from 100 oC (held 1 min) at 15 oC min-1 to 290 oC (held 5 min) resulting in 18.67 min of total running time. The transfer line, ion source and quadrupole analyzer temperatures were 280, 230 and 150 oC, respectively, and a solvent delay of 7 min was selected. In a full-scan mode, electronic ionization mass spectra in the range 35-550 Da were recorded at 70 eV electron energy with an ionization current of 34.6 µA. In the selected ion monitoring (SIM) mode acquisition, a group of target ions were monitored at different time windows defined by the corresponding retention time (Table 1), maintaining a dwell time of 100 ms. For quantification, three qualifier ions were chosen for each agrochemical, according to the characteristic features of the mass spectra obtained in full-scan mode by comparison with Wiley’s library spectral data bank (G1035B; Rev D.02.00; Agilent Technologies, U.S.A.).
Data recording and instrument control were performed by the MSD ChemStation software (G1701CA; version C.00.00; Agilent Technologies, U.S.A.). The recovery yields for all performed assays were calculated by comparing average peak areas of the extraction assays with standard controls.
Results and Discussion
Evaluation and optimization of the LVI-GC-MS(SIM) performance
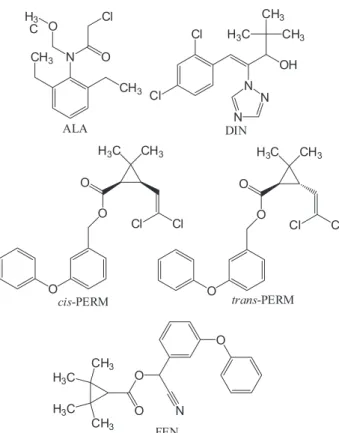
In the present work, five agrochemicals (ALA, DIN, FEN, cis-PERM and trans-PERM) were selected as model
compounds belonging to different chemical classes, as well as regarding their classification of use for target organisms (Table 1). Figure 1 depicts the chemical structures of the selected model compounds.
In a first approach we evaluated the mass spectral fragmentation pattern of each agrochemical, through the analysis of a standard mixture by GC-MS operating in the full-scan mode acquisition. Based on the characteristic features of the spectral data, target base peaks and qualifier ions were chosen (Table 1) to achieve high selectivity and sensitivity to operate in the SIM mode acquisition, according to the experimental parameters of this work and by comparing with studies reported in the literature.16,17
By monitoring those selected ions, good sensitivity and symmetrical peak shape could be achieved under the established conditions in suitable analytical time (< 20 min). In order to achieve high sensitivity for further experimental studies involving real matrices, a PTV injector, operating in the solvent vent mode using LVI, was used for sample analysis through GC-MS(SIM). Therefore, injection volumes of 20 µL were set as sample volume injection, because higher injection volumes lead to an increment of the solvent background and, therefore, lower signal-to-noise ratio (S/N)
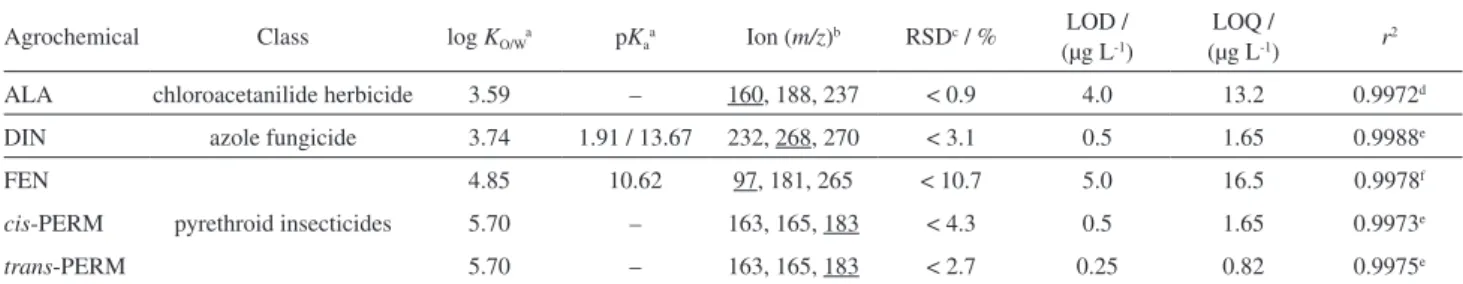
Table 1. Class, octanol-water partition coefficients (log KO/W), acid dissociation constants (pKa), ions, relative standard deviation of peak areas, limits of
detection (LOD), limits of quantification (LOQ) and determination coefficients (r2) for the five agrochemicals under study, obtained by LVI-GC-MS(SIM),
under optimized instrumental conditions
Agrochemical Class log KO/Wa pKaa Ion (m/z)b RSDc / %
LOD / (µg L-1)
LOQ /
(µg L-1) r2
ALA chloroacetanilide herbicide 3.59 – 160, 188, 237 < 0.9 4.0 13.2 0.9972d
DIN azole fungicide 3.74 1.91 / 13.67 232, 268, 270 < 3.1 0.5 1.65 0.9988e
FEN
pyrethroid insecticides
4.85 10.62 97, 181, 265 < 10.7 5.0 16.5 0.9978f
cis-PERM 5.70 – 163, 165, 183 < 4.3 0.5 1.65 0.9973e
trans-PERM 5.70 – 163, 165, 183 < 2.7 0.25 0.82 0.9975e aCalculator plug-in was used for structure property prediction and calculation, Marvin 6.2.2, 2014, ChemAxon (http://www.chemaxon.com); bquantification
during trace analysis. Instrumental sensitivity was checked through the limits of detection (LOD) and quantification (LOQ), obtained by the injection of diluted standard mixtures of the compounds under study and calculated with a S/N of 3/1 and 10/1, respectively. The instrumental precision was evaluated through repeated injections (250.0 µg L-1, n = 5), where no carryover was observed since the background was always below the instrumental LOD achieved. Table 1 summarizes the LOD, LOQ, determination coefficients (r2), as well as, the instrumental precision for all the compounds under study, achieved by LVI-GC-MS(SIM) using the selected ions.
Optimization of the BAµE-LD efficiency
In order to obtain the best performance for the proposed methodology, the optimization of several experimental parameters that can affect the recovery of the target compounds were studied. Therefore, systematic assays were performed in ultrapure water matrices spiked with the agrochemicals at the 2.0 µg L-1 level, in order to optimize several parameters, such as equilibrium time, stirring speed, pH, polarity and ionic strength for the extraction step, as well as solvent type and desorption time for the back-extraction step, using an univariate optimization strategy according to previous works.10-15
Selectivity of the sorbent phases
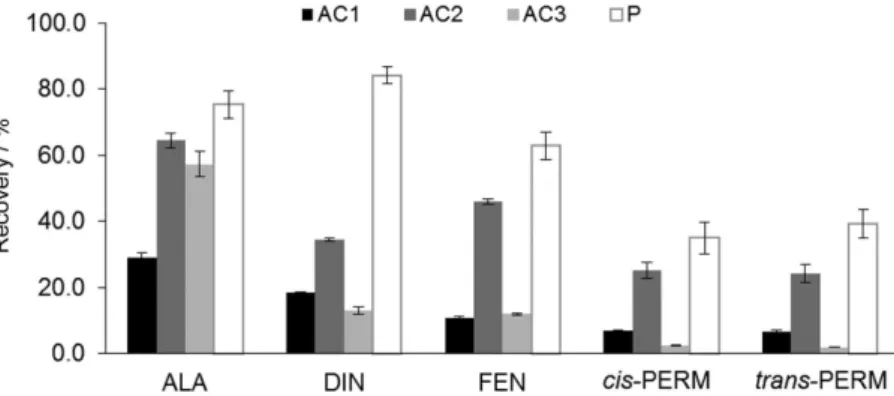
In a first approach several nanostructured materials were selected, having very different chemical properties to be tested as sorbent phases by BAµE, according to previous reports.10-15 Therefore, three ACs-based (AC1, AC2 and AC3) and one P-based (P) coatings were tested as sorbent phases for the microextraction of the five agrochemicals in aqueous media. Preliminary assays were performed through BAµE-LD on ultra-pure water samples in order to achieve the best selectivity of the different sorbent coatings tested, using standard experimental conditions: extraction: 3 h (1,000 rpm), 25 mL (2.0 µg L-1), pH 5.5; back-extraction: 200 µL ACN/MeOH (1/1, v/v), 30 min with ultrasonic treatment, according to previous works.11,12 It must be highlighted that the AC coatings are porous solid materials that retain solutes through electrostatic and/or dispersive interactions and therefore can be conditioned through the pHPZC of the sorbents. The textural adsorptive properties of all nanostructured (surface area, particle size and pore dimension) seems to be, also, a critical factor for the microextraction process involved. On the other hand, the polymeric phase tested is a reversed-phase type, retaining the analyte through mechanisms such as π-π, hydrogen bonding, dipole-dipole, hydrophobic and ionic interactions, where the texture properties of the polymeric phases can also be a critical factor for the microextraction process. Figure 2 depicts the efficiency profiles obtained for the sorbent materials tested under standard experimental conditions, in which P sorbent phase presents the best average recoveries among all materials tested.
Several mechanisms of retention can take place between P (having styrene-divinylbenzene groups) and the molecules involved and, since both present aromatic characteristics, the π-π interactions seems to be predominant with the neutral molecules at pH 5.5. Therefore, P sorbent coating was selected for the further assays.
Effect of LD parameters
After the selection of the best sorbents for the microextraction of the agrochemicals from aqueous media by BAµE(P), we continued with the back-extraction optimization process. This step is very important, since the desorption solvent must be carefully chosen, which must have enough strength to promote a complete stripping of the target compound from the sorbent coating. In order to accelerate the back-extraction process, the time submitted to ultrasonic treatment was also optimized.10,18 Hence, these two parameters, the stripping solvent and the ultrasonic treatment time were studied in triplicate, where MeOH,
Figure 1. Chemical structure of the five agrochemicals used in the
ACN and mixture of ACN/MeOH (1/1, v/v) were assayed using 30 min of desorption time to evaluate the best LD conditions. The results (data not shown) demonstrate that the best average recoveries are attained with ACN as stripping solvent for the five agrochemicals under study. Subsequently, the desorption time was also studied under 15, 30 and 45 min. From the data obtained (data not shown), there is an increase in recovery until 30 min, and no advantages were obtained for longer periods of desorption time. Furthermore, series of desorption replicates were also assayed, where no carryover was observed, since the background was always below the instrumental LOD. From the data obtained, the back-extraction assays were performed with ACN under ultrasonic treatment using 30 min.
Effect of BAµE(P) parameters
The next step was the optimization of the microextraction procedure. During the BAµE process, the interaction between the analytes from the bulk sample and the sorbent phase is based on an equilibrium process. Such phenomenon is affected by some kinetic parameters, whereas the stirring speed but also the equilibrium time are very important.10,19 Stirring speed has been reported as a very important parameter that can cause a significant effect on the efficiency yields by influencing the diffusion process of the analyte from the bulk sample to the sorbent phase through the floating sampling approach.13,14 Therefore, several assays were performed at 750, 1,000 and 1,250 rpm (room temperature), where stirring rates higher than 1,250 rpm were avoided, since it can create strong turbulence, which affects the floating stability of the BAµE devices, leading to low reproducibility.12 From the results obtained (data not shown), 1,000 rpm presented higher recoveries for all compounds under study and therefore, it was selected for further experiments. The equilibrium time was also evaluated by performing assays
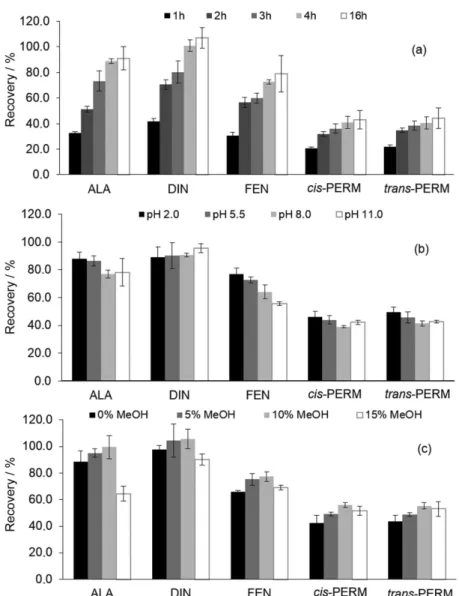
between 1 and 16 h for the five agrochemicals under study at room temperature. Figure 3a shows the equilibrium time profile obtained by using P sorbent phase, in which the best average recoveries were achieved after 4 h for all five compounds, where no advantages are observed by using higher equilibrium time. Subsequently, the sample matrix characteristics were also investigated, in particular the pH, ionic strength and polarity.
To evaluate the effect of the pH on the microextraction process, assays were performed using values of 2.0, 5.5, 8.0 and 11.0 (room temperature). The data obtained and depicted in Figure 3b shows that a matrix pH of 5.5 present more suitable average efficiency for all compounds under study. It must be also noted that for higher matrix pH, the efficiency decreases for FEN. Nevertheless, this result was expected since FEN becomes ionized at a more basic pH (Table 1), which can reduce the reverse-phase interactions with P sorbent phase. Therefore, matrix pH of 5.5 was fixed for further experiments. The addition of organic modifier such as MeOH to the sample matrix is usually used in order to avoid the “wall effect”, i.e., adsorption of the analytes to the sampling flask glass walls, and is an important parameter for the most hydrophobic compounds at trace levels. Therefore, assays were performed with the addition of MeOH (up to 15%, v/v) in the bulk matrix. The data obtained show that MeOH addition until 10% presented higher recoveries, which can be explained by the solubility increase of the target compounds in the bulk matrix, since these present nonpolar characteristics (3.59 < log KO/W < 5.70). As depicted in Figure 3c, 15%
of organic modifier showed lower extraction efficiencies for all compounds under study, which can be attributed to the increase of solubility of the agrochemicals in the bulk matrix, reducing its affinity to the polymeric sorbent phase. Consequently matrix with 10% MeOH was selected for further experiments. The addition of an electrolyte increases the ionic strength and can favor the migration
Figure 2. Selectivity effect on the average yields obtained by BAµE-LD/LVI-GC-MS(SIM) using different AC and P sorbent phases for the microextraction
of the agrochemicals in aqueous matrices, using standard experimental conditions (extraction: 25 mL (2.0 µgL-1), 3 h (1,000 rpm), pH 5.5; back-extraction:
of organic compounds toward the sorbent phase, which may strongly affect the efficiency, especially for the more polar ones (log KO/W < 3). In general, the addition of
salt increases the recoveries of the more polar targets, because the “salting-out effect” is based on decreasing the solubility of the compounds forcing them to migrate to the sorbent.11,12 Therefore, assays were performed with the addition of NaCl (up to 15%, m/v) in the bulk matrix. The results obtained (data not shown) show that the addition of NaCl clearly diminishes the extraction efficiency, once the agrochemicals under study present nonpolar characteristics, therefore the method was optimized in absence of NaCl.
Validation of the BAµE(P)-LD/LVI-GC-MS(SIM) methodology
After the optimization of the best experimental conditions, we proceeded to the validation process using the
following optimized experimental conditions (extraction: 4 h (1,000 rpm), pH 5.5, 10% MeOH; back-extraction: ACN (200 µL), 30 min under ultrasonic treatment). Under optimized experimental conditions, assays were performed on 25 mL of ultra-pure water samples spiked at the 2.0 µg L-1 level, showing that the proposed methodology (BAµE(P)-LD/LVI-GC-MS(SIM)) present remarkable performance, with average recovery yields ranging from 55.2 ± 4.3% (trans-PERM) to 105.6 ± 6.9% (DIN). The
data obtained presents higher extraction efficiencies when compared with other static sorption-based techniques such as SBSE using thermal (62.6%, ALA)20 and liquid (58.9%, FEN; 33.2%, cis-PERM; 38.2%, trans-PERM) desorption.21 The linear dynamic ranges for the present methodology were also evaluated on 25 mL of ultrapure water samples, spiked with the target analytes for concentrations between 0.03 and 4.0 µg L-1, where excellent linearity with remarkable determination coefficient (r2 > 0.9984) were
Figure 3. Effect of equilibrium time in (a), matrix pH in (b) and organic modifier in (c) on the recovery yields for the agrochemicals obtained by
achieved. Furthermore, the sensitivity of the methodology was also checked, where the LOD obtained were between 8.0 ng L-1 and 32.0 ng L-1, and LOQ ranging from 26.4 ng L-1 to 105.6 ng L-1, measured at a S/N of 3 and 10, respectively. It must be noted that the LOD achieved for these agrochemical compounds have the same order of magnitude with other reports founded in the literature using SBSE.20,21 Intraday and interday repeatability assays were also evaluated for the present methodology, calculated as RSD on five and nine assays, respectively. Intraday repeatability assays were implemented as five replicates performed in the same day and interday repeatability assays consisted in three replicates a day in three consecutive days. For intraday repeatability assays, spiked at the 2.0 µg L-1 level, good precisions were attained with RSD below 7.5% and interday repeatabilities were lower than 7.0%. Table 2 summarizes the results obtained for the method validation, presenting the average recoveries, the linear dynamic ranges, determination coefficients, LOD and LOQ, as well as inter and intraday repeatability assays for the five target compounds under optimized experimental conditions.
This analytical methodology operating under floating sampling technology has proved to be a suitable alternative, which allows to choose the coating phase according the target analytes under study, whenever other sorption-based static microextraction techniques present lack of effectiveness.
Application to real matrices
To demonstrate the applicability of the present methodology to real samples, several assays were performed in environmental water samples such as ground and surface water, as well as a red wine matrix. For real samples application, standard addition methodology (SAM) is usually the best strategy for quantification purposes to determine the levels of analytes under study and to reduce
possible matrix interferences in real samples.10-15 In a first approach, the matrix was spiked with four working standards to produce the corresponding concentration levels (0.2 to 2.0 µg L-1) for the analytes under study. Blank assays (“zero point”) were also performed without spiking. The results obtained (data not shown) demonstrate that good linearity was achieved for surface (r2 > 0.9980, DIN) and ground
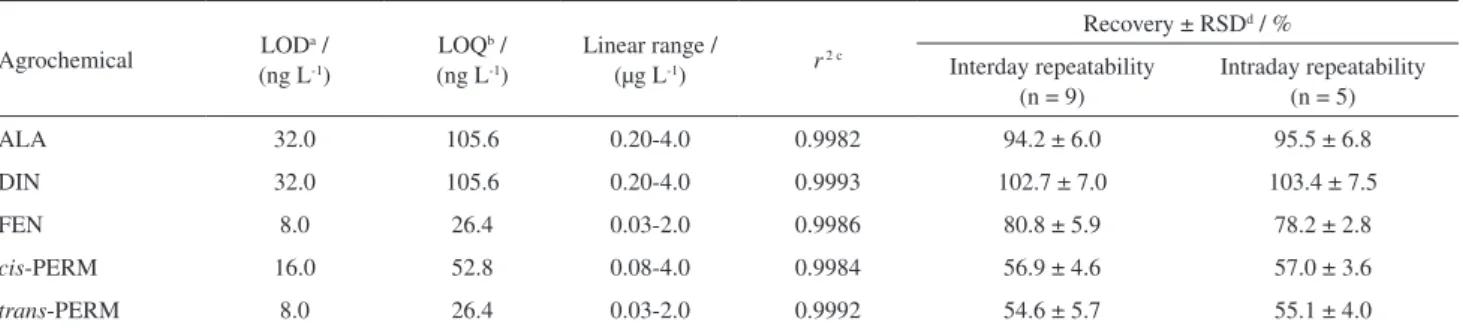
water (r2 > 0.9962, ALA), as well as red wine (r2 > 0.9911, FEN) matrices. Although the method presented high sensitivity, none of the agrochemicals under study were detected (<LOD) in the analyzed samples. It must also be emphasized that in Europe, the maximum admissible concentrations in surface water and in groundwater are 100 ng L-1 for a single pesticide and 500 ng L-1 for a mix of pesticides (Directives 2006/118/EC and 2008/105/EC).22,23 Additionally, some of these compounds were detected in wine samples in concentration higher than 100 ng L-1.24 Figure 4 exemplifies the chromatograms from recovery assays performed on ultrapure, surface and ground water, as well as red wine sample, spiked at the 250.0 ng L-1 level, through BAµE(P)-LD/LVI-GC-MS(SIM), under optimized experimental conditions, where good analytical performance is noticed.
In short, the BAµE(P)-LD/LVI-GC-MS(SIM) methodology revealed to be easy to work-up, efficient and environmentally friendly for trace level analysis of several classes of agrochemicals, allowing remarkable selectivity and sensitivity for real matrices with great complexity such as environmental water and wine samples.
Conclusions
The methodology proposed in the present work (BAµE(P)-LD/LVI-GC-MS(SIM)), using a styrene-divinylbenzene sorbent phase, was fully optimized and validated to monitor simultaneously five agrochemicals (alachlor, diniconazole, fenpropathrin, and cis- and
Table 2. Limit of detection, limit of quantification, linear dynamic ranges, determination coefficients, intra and interday repeatability assays, expressed in relative standard deviation of the average recovery rates, obtained for the agrochemicals under study by BAµE(P)-LD/LVI-GC-MS(SIM), under optimized experimental conditions
Agrochemical LODa / (ng L-1)
LOQb /
(ng L-1)
Linear range /
(µg L-1) r2 c
Recovery ± RSDd / %
Interday repeatability (n = 9)
Intraday repeatability (n = 5)
ALA 32.0 105.6 0.20-4.0 0.9982 94.2 ± 6.0 95.5 ± 6.8
DIN 32.0 105.6 0.20-4.0 0.9993 102.7 ± 7.0 103.4 ± 7.5
FEN 8.0 26.4 0.03-2.0 0.9986 80.8 ± 5.9 78.2 ± 2.8
cis-PERM 16.0 52.8 0.08-4.0 0.9984 56.9 ± 4.6 57.0 ± 3.6
trans-PERM 8.0 26.4 0.03-2.0 0.9992 54.6 ± 5.7 55.1 ± 4.0
Figure 4. Chromatograms obtained from assays in ultrapure water in (a), ground water in (b) and surface water in (c) matrices, as well as, red wine sample in (d) spiked with 250.0 ng L-1 by BAµE(P)-LD/LVI-GC-MS(SIM), under optimized experimental conditions. Peak identification: (1): ALA; (2): DIN;
(3): FEN; (4): cis-PERM; (5): trans-PERM.
trans-permethrin) belonging to different classes of
agrochemicals, in real matrices. Experimental parameters affecting the extraction and back-extraction processes were fully optimized, resulting in average extraction efficiencies ranging from 55.2 to 105.6% for the agrochemicals under study. Additionally, good accuracy, suitable precision, low detection limits and excellent linear dynamic ranges were also achieved. The application of the present methodology to monitor trace levels of agrochemicals in surface and ground water, as well as, wine sample provided very good performance through the standard addition method. The proposed methodology presents robustness, is easy to implement, and requires low sample volume, presenting high selectivity and sensitivity to monitor trace levels of agrochemicals in aqueous matrices. This new analytical approach that operates under the floating sampling technology has proved to be a cost-effective alternative with reduced environmental impact for screening of different classes of agrochemicals in water and wine matrices.
Acknowledgements
The authors wish to thank Fundação para a Ciência e a Tecnologia (Portugal) for funding (UID/
MULTI/00612/2013), and for the post-doc (SFRH/ BPD/86071/2012) and PhD (SFRH/BD/69951/2010) grants.
References
1. Casida, J. E.; Quistad, G. B.; Annu. Rev. Entomol. 1998,43, 1.
2. Aktar, M. W.; Sengupta, D.; Chowdhury, A.; Interdiscip. Toxicol.
2009,2, 1.
3. Masia, A.; Campo, J.; Vazquez-Roig, P.; Blasco, C.; Pico, Y.;
J. Hazard. Mater. 2013,263, 95.
4. Andreu, V.; Pico, Y.; Anal. Bioanal. Chem. 2012, 404, 2659.
5. Gilbert-Lopez, B.; Garcia-Reyes, J. F.; Fernandez-Alba, A. R.; Molina-Diaz, A.; J. Chromatogr. A 2010,1217, 3736.
6. Walorczyk, S.; Drozdzynski, D.; Gnusowski, B.; Talanta 2011,
85, 1856.
7. dos Anjos, J. P.; de Andrade, J. B.; Microchem. J. 2014,112, 119.
8. Nogueira, J. M. F.; Anal.Chim. Acta 2012,757, 1.
9. Silva, E. A. S.; Risticevic, S.; Pawliszyn, J.; TrAC, Trends Anal. Chem. 2013,43, 24.
10. Neng, N. R.; Silva, A. R.; Nogueira, J. M. F.; J. Chromatogr. A
11. Neng, N. R.; Sequeiros, R. C.; Nogueira, J. M. F.; Electrophoresis
2014, 35, 2488.
12. Almeida, C.; Strzelczyk, R.; Nogueira, J. M. F.; Talanta 2014,
120, 126.
13. Almeida, C.; Nogueira, J. M. F.; J. Chromatogr. A 2012,1265, 7.
14. Ahmad, S. M.; Almeida, C.; Neng, N. R.; Nogueira, J. M. F.;
J. Chromatogr. B 2014,969, 35.
15. Neng, N. R.; Mestre, A. S.; Carvalho, A. P.; Nogueira, J. M. F.;
J. Chromatogr. A 2011,1218, 6263.
16. Herrero-Hernandez, E.; Pose-Juan, E.; Alvarez-Martin, A.; Andrades, M. S.; Rodriguez-Cruz, M. S.; Sanchez-Martin, M. J.; J. Sep. Sci. 2012,35, 3492.
17. Garcia-Rodriguez, D.; Cela-Torrijos, R.; Lorenzo-Ferreira, R. A.; Carro-Diaz, A. M.; Food Chem. 2012,135, 259. 18. Mestre, A. S.; Pires, J.; Nogueira, J. M. F.; Parra, J. B.;
Carvalho, A. P.; Ania, C. O.; Bioresour. Technol. 2009,100, 1720.
19. Silva, A. R. M.; Portugal, F. C. M.; Nogueira, J. M. F.;
J. Chromatogr. A 2008, 1209, 10.
20. Tolgyessy, P.; Vrana, B.; Krascsenits, Z.; Talanta 2011,87, 152. 21. van Hoeck, E.; David, F.; Sandra, P.; J. Chromatogr. A 2007,
1157, 1.
22. The European Parliament and Council; Protection of Groundwater Against Pollution and Deterioration, Directive 2006/118/EC, 2006.
23. The European Parliament and Council; Environmental Quality Standards in the Field of Water Policy, Directive 2008/105/EC,
2008.
24. dos Anjos, J. P.; Andrade, J. B.; Microchem. J. 2015,120, 69.