vol. 43, n. 1, jan./mar., 2007
Determination of amoxicillin content in powdered pharmaceutical
formulations using DRIFTS and PLS
Graciele Parisotto
1, Marco Flôres Ferrão
2,*, João Carlos Furtado
2, Rolf Fredi Molz
21Departament of Chemistry and Physics, Universidade de Santa Cruz do Sul, 2Departament of Computer Science,
Universidade de Santa Cruz do Sul
The amount of amoxicillin in pharmaceutical formulations was determined using spectra of diffuse reflectance infrared Fourier transform spectroscopy (DRIFTS), in association with partial least squares (PLS) regression. The spectra of 24 different samples (17 for the calibration set and 7 for the validation set), which had been registered using a Nicolet Magna 550 spectrophotometer, contained 76.7-94.3% of amoxicillin in starch. The PLS models were constructed with auto-scaled or variance-scaled data, and multiplicative scatter correction (MSC). The best model presented
R2=0.9936, RMSEC=0.441 and RMSEV=0.790. The analytical
method proposed is non-destructive and the cost and time of analysis are very much reduced, allowing for the fast and direct determination of amoxicillin content.
*Correspondence:
M. F. Ferrão
Universidade de Santa Cruz do Sul Av. Independência, 2293 Cx. Postal 188
96815-900 - Santa Cruz do Sul - RS, Brazil
E-mail: [email protected]
Uniterms
• Multivariate regression • Partial least squares • regression
• Diffuse reflectance infrared • Fourier transform
• spectroscopy • Amoxicillin • Chemometrics
INTRODUCTION
The integration of the manufacturing sector with the quality control of pharmaceutical drugs plays a crucial role in guaranteeing that good practices will be used for the procurement of pharmaceutical end products, thus providing patients with excellent quality formulations. Instrumentation analytical methods that are neither destructive nor produce residues have been increasingly investigated for the identification and quantification of active ingredients, using infrared spectroscopy (Blanco et al., 2000a; Blanco et al., 2000b; Blanco et al., 2001; Braga, Poppi, 2004; Pasquini, 2003; Sun, Xiang, An, 2004; Yang, Irudayaraj, 2002).
Even though liquid chromatography is the official method for the quantification of amoxicillin in capsules or in oral solutions, according to a pharmacopoeia monograph
(USP, 2002), several alternatives have been proposed in the literature for the identification and quantification of amoxicillin in human tissues (e.g. plasma) or even in drug formulas. Hernández, Borrull and Calull (1999) developed a method using capillary electrophoresis in order to determi-ne amoxicillin content in animal plasma samples, since many veterinary drugs, such as amoxicillin, are used to treat animals for food production. A quick routine analytical procedure for the identification and quantification of premixtures of amoxicillin was developed and tested by Dousa and Hosmanová (2005) using reverse phase high performance liquid chromatography (HPLC). This method proved to be selective and can be used in routine analyses, allowing for the distinction between amoxicillin and other penicillins, which have similar structures. Hoizey et al.
acid in human plasma, whereas Hoizey used HPLC with ultraviolet detection and Yoon improved the method by employing HPLC combined with mass spectroscopy. Both methods were simple and accurate. Quite recently, Pasamontes and Callao (2004) described a quick method for the determination of pharmaceutical forms of amoxicillin in the presence of interferents, with inexpensive reagents and tools, and no need for sample pretreatment using sequential injection analysis with a diode array spectrophotometer and multivariate curve resolution.
The interface between chemometric tools and the data obtained by infrared methods offers new possibilities for the quantification and qualification of pharmaceutical drugs (Blanco et al., 2000a; Blanco et al., 2000b; Blanco
et al., 2001; Pasquini, 2003; Yang, Irudayaraj, 2002;
Fer-rão, Davanzo, 2005). On top of that, because it is a simple, easily obtained and non-destructive method, its procedures are appropriate for pharmaceutical formulations. Such methods have allowed to compare (Sabin, Ferrão, Furtado, 2004; Neumann et al., 2004, De Souza et al., 2004) and quantify (Blanco et al., 2000b; Blanco et al., 2001; Yang, Irudayaraj, 2002; Sun, Xiang, An, 2004; Konzen et al., 2003) several drugs during different manufacturing stages.
Partial least squares regression (PLS)
In the PLS regression model, developed by Herman Wold (Wold, 1978; Sjöström et al., 1983; Swierenga et al., 1999; Brereton, 2000), the spectral information and the concentrations are used simultaneously in the calibration phase.
The mainstay of PLS is the decomposition of the matrix of data X in terms of the sum of h matrices M plus a vector of residues e (corresponding to the error), as shown in equation 1. Matrices M are called latent variables (LVs) and h is the number of latent variables used to construct the model.
(1)
Basically, a matrix containing the absorbance of the infrared spectra of standards (X) is associated with another matrix that stores data on its concentration (y), resulting in equations 2 and 3, in which T and U are scores of X and y respectively, and P and Q are the loadings. Matrices E and F represent the modeling errors of X and y.
(2) (3)
The correlation between variables X and y is a
line-ar relationship obtained through lineline-ar regression coefficients, as shown in equation 4.
(4)
After being calculated, h values bh are grouped in a diagonal matrix B, which contains the regression coefficients between score matrices U of y and T of X. To find the best linear relationship between the scores of these two matrices, small rotations of the latent variables are carried out. Finally, we have equation 5, where y is calculated using the matrix of scores T, the regression coefficient matrix B, the matrix of loadings Q and the matrix of residues F.
(5)
To calculate the concentration of new samples, one should just calculate the new score matrix and substitute it into equation 6:
(6)
Preprocessing spectra data
Preprocessing is a column-oriented operation so preprocessing results are specific for a set of samples. Adding a sample to a data set can greatly influence the effect of a preprocessing technique. The difference between preprocessing data on a variable-basis and transforming data on a sample-basis is important to appreciate. Preprocessing is necessary because several multivariate algorithms compute results driven by variance patterns in the independent variables. Sometimes arbitrary measurement scales and/or magnitudes produce misleading results when an inappropriate preprocessing is made. The preprocessing procedures most common are mean-centering, variance scaling, auto-scaling and range scaling (Infometrix, 2003). In this work we used the auto-scaling and variance scaling algorithms.
Mean-center
A mean is computed for each variable (j) via the equation 7.
(7)
(8)
Variance scale
When data from two (or more) disparate variables span different magnitude ranges, the largest variable dominates any variance computations. In such situations, the dominant variable’s masking influence can be removed by variance scaling.
For preprocessing spectra data, first compute the variance for each variable (j) via the equation 9.
(9)
Then, each independent variable is divided by the appropriate standard deviation, sj, according to equation 10.
(10)
Auto-scale
Auto-scaling finds use in many fields including spectra data preprocessing. For these applications, auto-scaling is simply mean-centering followed by variance scaling (equation 11).
(11)
MATERIAL AND METHODS
Sample preparation
Through an experimental planning, 24 standard samples of amoxicillin were mixed into starch, of which 17 had been used for calibration and 7 for validation. This active ingredient was manipulated so as to provide a set of samples with different concentrations between 76.7-94.3 % (w/w).
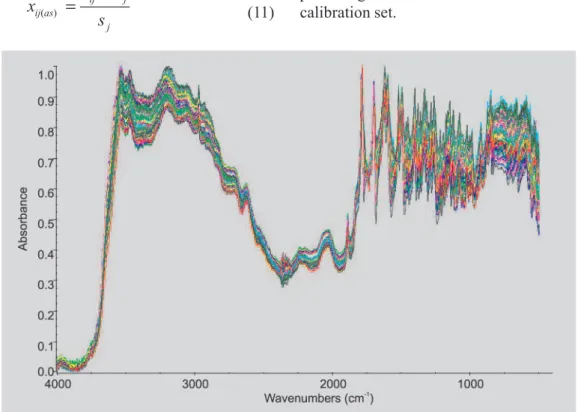
DRIFT spectra and data processing
A Nicolet Magna 550 FTIR spectrophotometer with a 4 cm-1 resolution and 32 scans was used for the
measurement of amoxicillin content in the samples. Duplicate spectra were recorded by a Pike DRIFTS accessory (Figure 1).
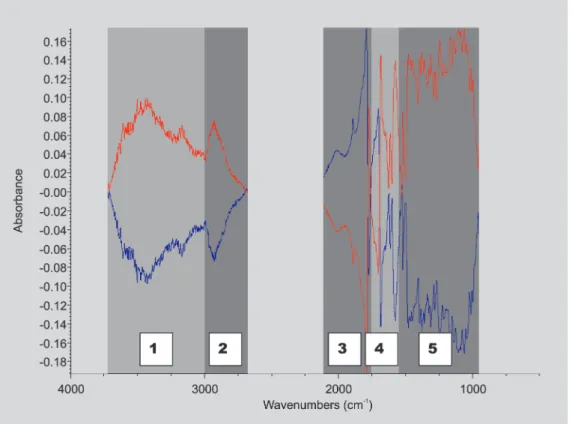
A partial least squares (PLS) regression analysis for the DRIFT spectra of the 17 samples was carried out using Pirouette software (Infometrix, 2003). The PLS models were developed using DRIFTS data in five different regions, as shown in Figure 2 (3,666-3,000; 3,000-2,650; 2,100-1,750; 1,750-1,530 and 1,530-950 cm-1). PLS
models were built with auto-scaled (mean-centered and variance-scaled methods were applied) and/or multiplicative scatter correction (MSC). The samples presenting extreme amoxicillin content were included in the calibration set.
Cross-validation following the leave-one-out procedure was performed during the validation step in order to define the optimum number of factors that should be kept in the model and to detect any outliers.
Seven new spectra were used in duplicate for the validation of the PLS regression model. The best model was selected considering the minimal error, that is, minor RMSEC (Root Mean Square Error of Calibration) and minor RMSEV (Root Mean Square Error of Validation) described in equation 12.
(12)
where n is the number of spectra, yi and ^y
iare the values for
standard amoxicillin samples mixed with starch and those predicted by the DRIFTS/PLS model, respectively, in the calibration set or external validation set.
RESULTS AND DISCUSSION
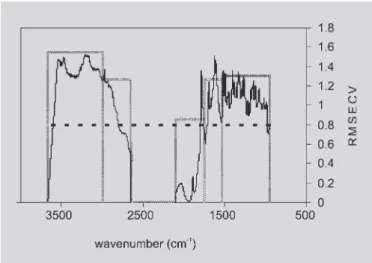
Initially, each of the five regions was assessed separately and the RMSECV values were calculated for the DRIFTS/PLS models, as shown in Figures 3 and 4. After
that, new DRIFTS/PLS models were constructed by combining the regions with the lowest RMSECV values with the other ones (Sutter, Kalivas, 1993). This procedure was repeated until the RMSECV value no longer decreased with the introduction of new spectral regions.
FIGURE 2 - Subtraction between the spectra of samples with high and low concentrations of amoxicillin in selected subregions.
All the built models had a lower error level when multiplicative scatter correction (MSC) was used.
Finally, the regression models with the lowest RMSECV values were compared to those that combined the five regions, as shown in Tables I and II, using auto-scaled and variance-auto-scaled data, respectively.
Seven samples were selected as test samples for the different preprocessing data. In both Tables (I and II), the models using only two subregions present better predictions with lower error in relation to the total combined subregion models.
The two preprocessing data used for the construction of the models yielded satisfactory results. The best RMSEC, RMSEV and R2 results of the best models using
auto-scaled and variance-scaled data are shown in Figures 5 and 6, respectively.
FIGURE 4 - Cross-validated prediction errors (RMSECV) for 5 interval models (bars) and combined subregion-spectrum model (dashed line) for amoxicillin determination using variance-scaled data and MSC.
TABLE I - Avarege prediction results for the calibration models for amoxicillin using auto-scaled data and MSC
Reference (%) Total Combined Subregion Model Combined Subregion Model
3,666-2,650 and 2,100-965 cm-1 3,000-2,650 and 2,100-1,750 cm-1
Predicted (%) Residual (%) Predicted (%) Residual (%)
78.59 78.58 ± 0.97 0.01 78.25 ± 0.50 0.34
80.63 81.14 ± 1.42 -0.51 81.55 ± 0.66 -0.92
82.74 82.64 ± 0.07 0.10 82.61 ± 0.15 0.13
84.96 84.92 ± 0.42 0.04 84.21 ± 0.20 0.75
87.35 87.02 ± 0.15 0.33 86.97 ± 0.62 0.37
89.83 91.91 ± 0.93 -2.08 90.86 ± 0.95 -1.03
92.49 91.18 ± 1.59 1.31 91.85 ± 0.62 0.64
RMSEP 0.958 0.671
LVs 5 5
TABLE II - Average prediction results for the calibration models for amoxicillin using variance scaled data and MSC
Reference (%) Total Combined Subregion Model Combined Subregion Model
3,666-2,650 and 2,100-965 cm-1 2,100-1,750 and 1,750-1,530 cm-1
Predicted (%) Residual (%) Predicted (%) Residual (%)
78.59 78.74 ± 0.15 -0.16 78.16 ± 0.03 0.43
80.63 80.68 ± 1.17 -0.05 81.26 ± 0.95 -0.62
82.74 82.52 ± 0.02 0.22 83.24 ± 0.23 -0.50
84.96 84.73 ± 0.66 0.23 84.85 ± 0.40 0.11
87.35 87.48 ± 0.54 -0.13 87.61 ± 0.40 -0.27
89.83 91.18 ± 0.66 -1.35 90.80 ± 0.64 -0.97
92.49 91.21 ± 1.63 1.27 91.43 ± 1.29 1.06
RMSEP 0.716 0.650
CONCLUSIONS
In the present study, we may verify that the DRIFTS technique associated with the PLS calibration algorithm is a solution to the problem with the quantification of amoxicillin in samples obtained in manufacturing processes. Better models could be obtained by using auto-scaled or variance-scaled data, with the advantage of selecting chemically significant bands. The advantages of these methodologies are that they are non-destructive, have a lower cost, and do not produce residues. Therefore, they may yield excellent results when applied to the quality control of drugs, either at the industrial level or in the control of manufacturing processes at compounding pharmacies.
ACKNOWLEDGEMENT
We gratefully acknowledge the support of Conselho Nacional de Desenvolvimento Científico e Tecnológico (CNPq), Brazil.
RESUMO
Determinação de amoxicilina em formulações farma-cêuticas em pó empregando DRIFTS-PLS
Neste trabalho propõe-se a quantificação de amoxicilina em formulações farmacêuticas empregando
espectros-copia por refletância difusa no infravermelho com trans-formada de Fourier (DRIFTS) e regressão por mínimos quadrados parciais (PLS). Foram coletados em um espectrômetro Nicolet Magna 550 os espectros de 24 amostras (17 para o conjunto de calibração e 7 para o conjunto de validação) contendo de 76,7-94,3 % de amoxicilina em amido. Para a construção dos modelos PLS foi empregada a correção do espalhamento de luz (MSC) e os dados foram autoescalados ou escalados pela variância. Foi obtido um excelente modelo para a
previ-são da amoxicilina o qual apresentou R2=0,9936,
RMSEC=0,441 e RMSEV=0,790. O método proposto além de não destrutivo apresenta baixo tempo de análise e baixo custo podendo ser facilmente empregado no con-trole de qualidade das indústrias farmacêuticas.
UNITERMOS: Regressão multivariada. Regressão por mínimos quadrados parciais. DRIFTS. Amoxicilina. Quimiometria.
REFERENCES
BLANCO, M.; COELHO, J.; ITURRIAGA, H.; MASPOCH, S.; POU, N. Development and validation of a near infrared method for the analytical control of a pharmaceutical preparation in three steps of the manufacturing process. Fresenius J. Anal. Chem., Berlin, v. 368, n.5, p. 534-539, 2000a.
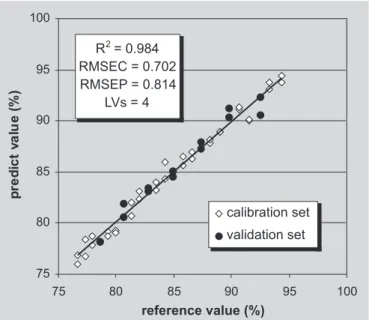
FIGURE 6 - Calibration and validation plot of % amoxicillin predicted by DRIFTS/PLS vs reference using 4 latent variables and combined regions 2,100-1,750 and 1,750-1,530 cm-1 for model with variance-scaled data and
MSC. FIGURE 5 - Calibration and validation plot of %
amoxicillin predicted by DRIFTS/PLS vs reference using 5 latent variables and combined regions 3,000-2,650 and 2,100-1,750 cm-1 for model with auto-scaled data and
BLANCO, M.; EUSTAQUIO, A.; GONZALEZ, J.M.; SERRANO, D. Identification and quantitation assays for intact tablets of two related pharmaceutical preparations by reflectance near-infrared spectroscopy: validation of the procedure. J. Pharm. Biomed. Anal., Amsterdam, v.22, n.1, p.139-148, 2000b.
BLANCO, M.; COELLO, J.; ITURRIAGA, H.; MASPOCH, S.; POU, N. Influence of the procedure used to prepare the calibration sample set on the performance of near infrared spectroscopy in quantitative pharmaceutical analyses. Analyst, London, v. 126, n.7, p.1129-1134, 2001.
BRAGA, J.W.; POPPI, R.J. Validação de modelos de calibração multivariada: Uma aplicação na determinação de pureza polimórfica de carbamazepina por espectroscopia no infravermelho próximo. Quím. Nova, São Paulo, v.27, p.1004-1011, 2004.
BRERETON, R.G. Introduction to multivariate calibration in analytical chemistry. Analyst, London, v.125, p.2125-2154, 2000.
DE SOUZA, J.S.; FERRÃO, M.F.; PARISOTTO, G.; FURTADO, J.C. Análise de medicamentos anti-inflamatórios não esteroidais manipulados empregando espectroscopia no infravermelho (DRIFTS). Rev. Cienc.
Farm., Araraquara, v.25, n.2, p.91-98, 2004.
DOUSA, M.; HOSMANOVÁ, R. Rapid determination of amoxicillin in premixes by HPLC. J. Pharm. Biomed. Anal., Amsterdam, v.37, n.2, p.373-377, 2005.
FERRÃO, M.F.; DAVANZO, C.U. Horizontal attenuated total reflection applied to simultaneous determination of ash and protein contents in commercial wheat flour. Anal.
Chim. Acta, Amsterdam, v.440, n.2, p.411-415, 2005.
HERNÁNDEZ, M.; BORRULL, F.; CALULL, M. Determination of amoxicillin in plasma samples by capillary electrophoresis. J. Chromatogr., B, Biomed. Sci. Appl., Amsterdam, v.731, n.2, p.309-315, 1999.
HOIZEY, G.; LAMIABLE, D.; FRANCES, C.; TRENQUE, T.; KALTENBACH, M.; DENIS, J.; MILLART, H. Simultaneous determination of amoxicillin and clavulanic acid in human plasma by HPLC with UV detection. J.
Pharm. Biomed. Anal., Amsterdam, v.30, n.3, p.661-666,
2002.
INFOMETRIX, Inc., Pirouette 3.11, Woodinville, WA, 2003.
KONZEN, P.H.A.; FURTADO, J.C.; CARVALHO, C.W.; FERRÃO, M.F.; MOLZ, R.F.; BASSANI, I.A.; HÜNING, S.L. Otimização de métodos de controle de qualidade de fármacos usando algoritmo genético e busca tabu. Pesqui. Oper., Rio de Janeiro, v.23, n.1, p.189-207, 2003.
NEUMANN, L.G.; FERRÃO, M.F.; PARISOTTO, G.; DE SOUZA, J.S.; KONZEN, P.H.A.; BRUXEL JUNIOR, V.; FURTADO, J.C. Algoritmo genético na otimização de HCA de espectros por reflexão difusa no infravermelho de medicamentos anti-inflamatórios. Tecno-Lóg., Santa Cruz do Sul, v. 8, n.2, p.9-28, 2004.
PASAMONTES, A.; CALLAO, M.P. Determination of amoxicillin in pharmaceuticals using sequential injection analysis and multivariate curve resolution. Anal. Chim. Acta, Amsterdam, v.515, n.1, p.159-165, 2004.
PASQUINI, C. Near infrared spectroscopy: fundamentals practical aspects and analytical applications. J. Braz.
Chem. Soc., São Paulo, v.14, n.2, p.138-219, 2003.
SABIN, J.G.; FERRÃO, M.F; FURTADO, J.C. Análise multivariada aplicada na identificação de fármacos antidepressivos. Parte II: Análise por componentes principais (PCA) e o método de classificação SIMCA.
Rev. Bras. Ciênc. Farm., São Paulo, v. 40, n.3, p.
387-396, 2004.
SJÖSTRÖM, M.; WOLD, S.; LINDBERG, W.; PERSSON, J.A.; MARTENS, H., A multivariate calibration problem in analytical chemistry solved by partial least-squares models in latent variables. Anal. Chim. Acta, Amsterdam, v.150, p.61-70, 1983.
SUN, M.L.; XIANG, B.R.; AN, D.K. A near-infrared diffuse reflectance analysis method for the noninvasive quantitative analysis of ambroxol hydrochloride tablets.
Yao Xue Xue Bao, Peking, v.39, n.1, p.60-63, 2004.
SUTTER, J.M.; KALIVAS, J.H. Comparison of Forward Selection, Backward Elimination, and Generalized Simulated Annealing for Variable Selection. Microchem. J., New York, v.47, n.1-2, p.60-66, 1993.
SWIERENGA, H.; DE WEIJER, A.P.; VAN WIJK, R.J.; BUYDENS, L.M.C., Strategy for constructing robust multivariate calibration models. Chemometr. Intell. Lab.
UNITED States Pharmacopeia. 25.ed. Rockille: United States Pharmacopeial Convention, 2002. p.1388-1389.
WOLD, S. Cross-Validatory Estimation of the Number of Components in Factor and Principal Components Models,
Technometrics, Washington, v.20, n.4, p.397-405, 1978.
YANG, H.; IRUDAYARAJ, J. Rapid determination of vitamin C by NIR, MIR and FT-Raman techniques. J. Pharm.
Pharmacol., London, v.54, n.9, p.1247-1255, 2002.
YOON, K.H.; KIM, H.J.; LEE, S.Y.; KIM, W.; PARK, J.S. Simultaneous determination of amoxicillin and clavulanic acid in human plasma by HPLC–ESI mass spectrometry.
J. Chromatogr., B, Biomed. Sci. Appl., Amsterdam, v.813,
n.1-2, p.121-127, 2004.