*Corresponding author:
E-mail: [email protected]
Received: September 19, 2015
Approved: February 29, 2016
How to cite: Nonaka AG, Batista MA, Inoue TT, Costa ACS. Thermal Transformation and Characterization of Synthetic Al-Substituted Maghemites
(γ-Fe2-xAlxO3). Rev Bras Cienc
Solo. 2016;40:e0150314.
Copyright: This is an open-access article distributed under the terms of the Creative Commons Attribution License, which permits unrestricted use, distribution, and reproduction in any medium, provided that the original author and source are credited.
Thermal Transformation and
Characterization of Synthetic
Al-Substituted Maghemites
(γ-Fe
2-x
Al
x
O
3
)
Adriele Galeti Nonaka(1), Marcelo Augusto Batista(2)*, Tadeu Takeyoshi Inoue(2) and
Antonio Carlos Saraiva da Costa(2)
(1)
Universidade Estadual de Maringá, Departamento de Agronomia, Programa de Pós-graduação em Agronomia, Maringá, Paraná, Brasil.
(2)
Universidade Estadual de Maringá, Departamento de Agronomia, Maringá, Paraná, Brasil.
ABSTRACT: Burning is a common practice in tropical areas and related changes in mineralogy
might affect the chemical and physical behavior of soils. Maghemite is a common iron
oxide in soils formed from basic rocks in tropical regions. This mineral and hematite are the main pigments in these soils and exhibit high magnetization stemming from the precursor magnetite formed during the weathering process of primary minerals. The objective of the present study was to analyze changes in color, magnetic suceptibility values, Fourier transform infrared spectroscopy (FTIR) spectra, and available Fe and Al contents extracted with 1 mol L-1 KCl during the process of thermal transformation of synthetic Al-maghemites
into Al-hematites. Synthetic substituted maghemites with different degrees of Al-substitution
(0.0, 1.0, 2.0, 2.9, 3.8, 5.6, 6.7, 10.0, 12.0, and 17.1 mol% Al) were subjected to a temperature of 500 ± 10 °C for 0, 5, 10, 16, 64, 128, 192, 360, 720, 2160, 3600, 5040 and 6480 min.
The color of the samples was analyzed by a Munsell system in a colorimeter. Mass-specific magnetic susceptibility (χLF) was measured at low-frequency. Available Fe and Al contents were
estimated by a 1 mol L-1 KCl solution. Fourier transform infrared spectroscopy (FTIR) spectra were obtained through use of a Bruker Vertex 70X FTIR spectrophotometer at a spectral resolution of 4 cm-1. Contents of Fe and Al extracted by 1 mol L-1 KCl in Al-hematites were not detected. All samples analyzed exhibited YR hue. Hue proportion decreased with increased heating time, and color changed from brown to red. The increase in isomorphic substitution (IS) led to increased hue values from maghemite to hematite, and the latter then became
yellower. The χLF values decreased with an increase in heating time, indicating transformation
from a ferrimagnetic phase (maghemite) to an antiferrimagnetic phase (hematite). With
increasing IS, the maghemite χLF values decreased. Bands of the initial members (time 0) in
the FTIR spectra were indexed as maghemites. The end members after completion of the
heat treatment were identified as hematites. The IS of Fe by Al in maghemite influenced the thermal transformation to hematite, as well as the color and χLF of the minerals. The χLF
proved to be very efficient in detecting maghemites remaining after thermal processing.
Fe and/or Al were not ejected from the hematite crystalline structure after heat treatment.
Keywords: Fourier Transform Infrared Spectroscopy, color, Mass Specific Magnetic
Susceptibility, KCl.
INTRODUCTION
Iron oxides constitute an important assemblage most of the minerals that compose Brazilian soils. Generally, tropical soils basic volcanic rocks contain a high concentration of magnetic and non-magnetic Fe oxides (Resende et al., 1988). According to Souza Júnior et al. (2010), soils with high magnetic susceptibility are correlated with good agricultural potential, and they occupy 5 % of Brazilian territory. The most important ferrimagnetic minerals in soils and sediments are magnetite (Fe3O4) and maghemite (γ-Fe2O3) (Mullins, 1977; Jong et al.,
2000; Grimley et al., 2004).
Maghemite is a secondary Fe oxide, and it is easily identified in a clay fraction with a
hand magnet (Schwertmann and Taylor, 1989). Particles larger than 10 nm are completely organized in a magnetic way at ambient temperatures, whereas smaller particles are said to be superparamagnetic (Coey and Khalafalla, 1972; Dearing, 1994).
Many authors have observed the effect of isomorphic substitution on magnetic susceptibility
in synthetic (Batista et al., 2008; 2010; 2013) and natural minerals (Costa et al., 1999; Silva et al., 2010). In general, increasing isomorphic substitution (IS) (i.e. Al3+) decreases
mass-specific magnetic susceptibility. This property has been used to quantify and qualify
magnetic minerals in the soil.
Hematite is paramagnetic above 956 K (682.85 °C) (Cornell and Schwertmann, 1996). At ambient temperatures, it is weakly ferromagnetic, and at 260 K (-3.15 °C), it undergoes a phase transition to an antiferromagnetic state. The magnetic behavior of hematite depends on particle size, crystallinity, and isomorphic substitution (IS), mainly by Al, Ga, Cr, In, Mn, Sn, and Ti (Cornell and Schwertmann, 1996).
Another reliable indicator of the presence of Fe oxides is soil color (Resende, 1976;
Schwertmann, 1993). In the Brazilian Soil Classification System (Santos et al., 2013), color is used as a differential property at the second categorical level. Color measures may be collected using different scales, but the Munsell scale is commonly used in Brazil. Along with organic matter, Fe oxides are the most important color agents: red (α-Fe2O3),
yellow (α-FeOOH), brown (γ-Fe2O3), and black (Fe3O4) (Costa and Bigham, 2009). Color
may also vary according to the particle size and shape of minerals, chemical composition, and type and level of IS (Costa and Bigham, 2009).
Soils developed from mafic rocks in tropical regions tend to be more reddish (richer in
hematite) (Resende et al., 2007). Maghemite is an Fe oxide common in soils developed
from basic effusive magmatic rocks and tends to constitute up to 50 % of the Fe oxides
present in soils developed from these rocks (Costa et al., 1999). Maghemite can transform into hematite by heating above 500 °C (Bigham et al., 2002).
Changes in the color of Fe oxide because of IS of Fe3+ by other metallic cations have
been observed by some researchers (Scheinost et al., 1999; Batista et al., 2010). The
color of Al-substituted maghemite (γ-Fe2-xAlxO3) observed by Batista et al. (2010) ranged
from 4.8YR to 7.1YR. Torrent and Barrón (2003) observed that the color of synthetic and natural Al-substituted hematite ranged from 9.5P to 5.3YR. The presence of Mn in the structure of hematite leads to a darker color, close to black (Cornell and Scwhertmann, 1996). In contrast, the presence of Al reduces the crystal size of hematite and goethite and increases their value in the Munsell system, and they become lighter in color (Barrón and Torrent, 1984; Kosmas et al., 1986). Red hematite heated to temperatures above 800 °C becomes purple, due to increasing particle size (Steinwehr, 1969).
The isomorphic substitution and thermal reaction can cause changes in mineralogical and chemical attributes of maghemite and hematite. The objective of the present study was to
evaluate the influence of IS of Fe by Al after the thermal transformation of Al-maghemites into Al-hematites by analyzing mass-specific magnetic susceptibility, color, available Fe
and Al in 1 mol L-1 KCl, and Fourier transform infrared spectroscopy (FTIR).
MATERIALS AND METHODS
Maghemite synthesis
Aluminous maghemites were prepared by the oxidation of Al-magnetites, synthesized by co-precipitation in alkaline KNO3 solutions containing FeSO4.7H2O with stoichiometric
amounts of Al2(SO4)3.7H2O, according to the procedure described by Schwertmann
and Cornell (1991) and Batista et al. (2010). Magnetite synthesis was performed in a N2 atmosphere over 2 h periods to assess the impact of equilibration time on Al
substitution. Following the oxidation and co-precipitation reactions, a hand magnet easily and completely attracted all the magnetite formed. This material was washed several times with distilled water to remove excess salts. It was frozen using liquid nitrogen, and dried in a lyophilizer. The magnetite was then heated in a furnace at 250 °C for 4 h, where it was converted to yellowish red maghemite, which was also attracted by a magnet. In order to purify the maghemites, poorly crystalline materials were selectively removed by one 4 h treatment with acid (pH 3.0) ammonium-oxalate (2.0 mol L-1) in the
dark using a sample to solution ratio of 1:1000, according to the procedure described by McKeague and Day (1966).
Duplicates of the powdered, purified materials (~200 mg) were weighed into 50 mL
polypropylene tubes; 3 mL of concentrated HCl was then added and the samples were
allowed to rest for ~48 h until complete dissolution was achieved. Total Al and Fe contents
were subsequently determined using a GBC 932AA atomic absorption spectrometer. Observed Al and Fe contents were calculated based on the amounts of Al and Fe obtained in total chemical analysis. The isomorphic substitutions (IS) observed in synthetic substituted maghemites were 0.0, 1.0, 2.0, 2.9, 3.8, 5.6, 6.7, 10.0, 12.0, and 17.1 mol% Al.
X rays diffraction (XRD)
The powdered material was analyzed on a Shimadzu XRD-6000 diffractometer using CuKα radiation (35 kv, 20 mA) with a Ni filter in a step-scanning mode (0.01 °2θ s-1
). An
internal standard was not added. Identification of the mineral species in the samples was made from X rays diffractions (XRDs) according to the position and intensity of the diffraction planes (Whittig and Allardice, 1986; Schwertmann and Taylor, 1989).
Maghemite-to-hematite transformation
Synthetic maghemites with different degrees of IS were placed on mullite rectangular boats in a muffle furnace pre-heated to a temperature of 500 ± 10 °C. This temperature was chosen based on differential thermal analysis (DTA) and on literature results (Sidhu, 1988). The
mullite refractories were placed on a steel tray and then heated. The samples remained in
the furnace for different times: 0, 5, 10, 16, 64, 128, 192, 360, 720, 2160, 3600, 5040, and
6480 min. After that, they were withdrawn and immediately cooled (the tray was placed on ice) to interrupt further reactions (Sidhu, 1988) and then kept in plastic containers.
Available Fe and Al in 1 mol L-1 KCl
Approximately 0.40 g of the heated material was placed in 15 mL Falcon tubes. Then, 10 mL of 1 mol L-1 KCl was added (Claessen, 1997). The tubes were shaken for 10 min at
Absorption Spectroscopy (AAS) in a GBC 932 AA spectrometer. Iron was determined in
acetylene flame and Al in acetylene-nitrous oxide flame.
Mass-specific magnetic susceptibility (χLF)
Mass-specific magnetic susceptibility was determined in all samples using a Bartington
MS2 magnetic susceptibility system coupled to an MS2B sensor (Dearing, 1994). This dual
frequency meter exposed the sample to a weak alternating magnetic field of ~80 A m-1.
The MS2B sensor has both low- (0.47 kHz) and high-frequency settings (4.7 kHz). Powdered samples (10 cm3) were weighed into 20 cm3 plastic vials. Volumetric magnetic susceptibility
(k) was measured only at low-frequency settings, and low-frequency mass susceptibility
(χLF) was calculated as follows (Dearing, 1994): χLF = (10 κLF m
-1), where m is the mass
(g) and κLF is the volumetric magnetic susceptibility measured by the equipment. Fourier transform infrared spectroscopy (FTIR)
The infrared (IR) spectra were recorded using a Bruker Vertex 70X FTIR spectrophotometer at a spectral resolution of 4 cm-1. Each spectrum was obtained after acquiring 128 scans.
Approximately 2 mg of each sample, plus 200 mg of KBr, were weighed and ground with an agate mortar and pestle until a homogeneous mixture was obtained, which was then pressed into disc-shaped pellets. The FTIR spectra from the pellets were recorded over the range of 400-4,000 cm-1 and then analyzed using Origin® 8.0 software. FTIR bands
were identified as suggested by Waldron (1955), White and De Angelis (1967), (Wilson
et al., 1981), Cornell and Schwertmann (1996), and Socrates (2001).
Color determination
Color was determined from powdered samples with Konica Minolta CR-400 equipment set up for the Munsell scale (hue, value, and chroma). The amount available of each sample was placed on gloss paper positioned on a workbench lined with black poster paper and then measured.
RESULTS AND DISCUSSION
X rays diffraction (XRD)
The XRD reflections showed only the presence of the two phases in all materials analyzed:
maghemite, Al-maghemite, hematite and/or Al-hematite (data not shown). For example,
figure 1 shows XRD spectra of Al-maghemites with 3.8 mol% isomorphic substitution (IS)
without heating and Al-hematite with IS of 3.8 mol% Al that was heated for 6480 min. Those samples were arbitrarily chosen.
Available Fe and Al in 1 mol L-1
KCl
Iron and Al content extracted by 1 mol L-1 KCl solution was not detected in Al-hematites
in any degree of IS. Element migration in mineral structures and element ejection have
been observed by different authors. Landers et al. (2009) observed Ni migration in
natural goethite samples because of thermal treatment. In contrast, Sidhu et al. (1980) emphasized that during thermal transformation of maghemite into hematite, element ejection mainly occurs with divalent ions that exhibit a lower valence and larger ionic radii than Fe3+, a situation not observed in this experiment.
Color
Differences in particle size, morphology, and chemical composition may cause variations
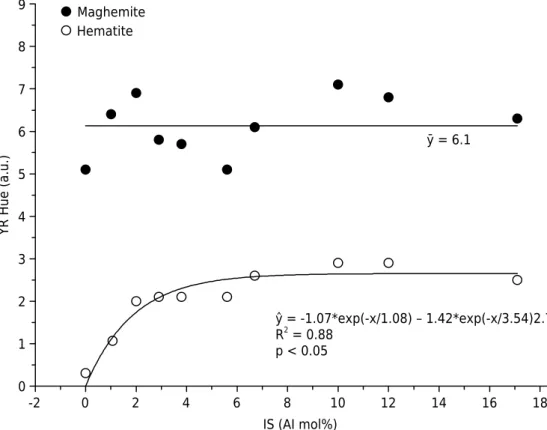
in mineral structure and behavior (Cornell and Schwertmann, 1996). The maghemite hue values (Figure 2) tend to increase with increasing isomorphic substitution (IS) but without
and this relationship was best represented by an exponential regression model (R² = 0.88). Therefore, hematite showed greater changes in color at lower degrees of IS, becoming yellower. Color stabilization in hematite samples was achieved at hue 2.76YR.
10 20 30 40 50 60 70 80 90
˚2θ (CuKα)
(533)
(620)
(440)
(511)
(422)
(400)
(311)
(220)
(211)
(210)
(012)
(104)
(110)
(024)
(113)
(116)
(018)
(214) (300)
(101) (220)
Al-hematite
Al-maghemite
Figure 1. X rays diffraction of Al-maghemite (not heated) and Al-hematite (heated for 3,680 min) with 3.8 mol% Al.
-2 0 2 4 6 8 10 12 14 16 18
YR Hue (a.u.)
0 1 2 3 4 5 6 7 8
9 Maghemite
Hematite
ӯ = 6.1
IS (AI mol%)
ŷ = -1.07*exp(-x/1.08) – 1.42*exp(-x/3.54)2.76 R2 = 0.88
p < 0.05
The Fe-to-Al isomorphic substitution effect on mineral color is difficult to detect because
Al substitution reduces particle size and changes chemical composition, which might also change mineral color (Batista et al., 2010). Maghemite and hematite hues ranged from 5.1YR to 7.1YR, and from 0.3YR to 2.9YR, respectively. Hue values observed for maghemite were higher than the values suggested by Bigham et al. (2002) (2.5YR to
5YR). The hue values of hematite were also different from those proposed by Cornell and Schwertmann (1996) (5R to 2.5YR). Bhuiyan et al. (2007) verified that hematite
substituted by Nd³+ exhibited a brighter yellowish-red color compared to the pure phase.
The behavior of chroma and value data did not show significant correlation (p>0.05) with the different degrees of IS. For Barrón and Torrent (1984) and Kosmas et al. (1986), structural Al seems not to significantly influence the hue and chroma of synthetic
Al-hematites, although the crystals became lighter (increasing value).
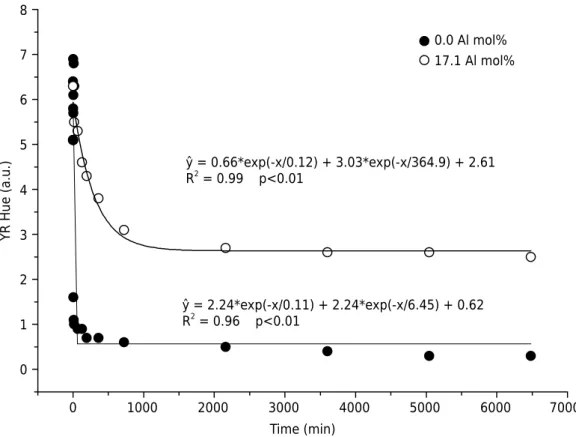
Increased heating time led to a reduction in the proportion of the YR hue for all the degrees of substitution studied (Figure 3); i.e., the samples became redder. The Munsell hue values were higher for the highest Al contents. As previously observed, change in color with heating time is due to the maghemite-to-hematite transformation; i.e., the color changes from brown (maghemite) to red (hematite). The samples that were a mix of maghemite and hematite showed intermediate values between maghemite with no substitution and maghemite with 17.1 mol% Al. Al-free maghemites showed an abrupt change in color compared to Al-substituted maghemites. Thus, a higher IS led to a slower transformation rate. In other words, the higher the content of chemical elements, the higher the energy necessary to eject or redistribute them in the mineral crystalline
structure. When samples with different IS are exposed to the same temperature, the
sample that has higher IS will transform slower (Sidhu et al., 1980).
A 90 % color change in Al-free and in 17.1 mol% Al maghemites was observed after heating for 10 and 768 min, respectively. This increasing resistance to color change
with increasing IS and the differences in the initial (maghemite) and final (hematite)
colors follow the same reasoning used to explain phase alteration. It is evident that
Time (min)
0 1000 2000 3000 4000 5000 6000 7000
YR Hue (a.u.)
0 1 2 3 4 5 6 7 8
0.0 Al mol% 17.1 Al mol%
ŷ = 0.66*exp(-x/0.12) + 3.03*exp(-x/364.9) + 2.61
R2
= 0.99 p<0.01
ŷ = 2.24*exp(-x/0.11) + 2.24*exp(-x/6.45) + 0.62
R2
= 0.96 p<0.01
higher temperatures (Sidhu, 1988) or longer heating periods are necessary for the solid state maghemite-to-hematite transformation when the minerals have undergone isomorphic substitution.
Burning, which is still widely used for land clearing in tropical regions, may also change soil color. The maximum temperature and duration of the exposure are important indicators
of fire severity (Wells et al., 1979). Low severity fires (short exposure to <250 °C) have shown to temporarily affect biological and chemical properties of soil. More severe burning
may alter fundamental properties as texture, mineralogy, and cation exchange capacity (Sertsu and Sanchez, 1978; Ulery and Graham, 1993; Ulery et al., 1996; Ketterings et al., 2000).
Some properties of Indonesian soils were studied by Ketterings and Bigham (2000) and they observed that surface burning tends to reduce the value and chroma, observing that above 600 °C, a pronounced reddening may occur that would indicate the thermal conversion of goethite (yellow) to maghemite (reddish brown) and to hematite (red). Lugassi et al. (2009) observed this reddening at 300 °C in Israeli soils (loess). Therefore, the temperature of change in soil colors is dependent on the mineralogy.
Mass specific magnetic susceptibility
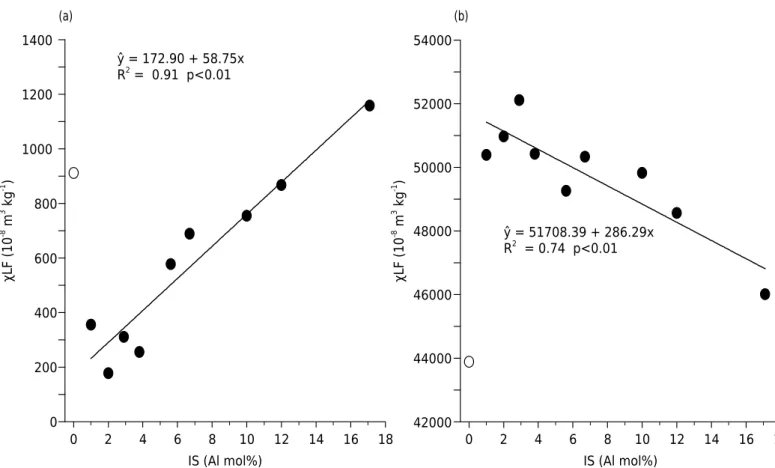
For the Al-substituted maghemites, χLF values ranged from 44,000 (0.0 mol% Al) to
52,968 (2.9 mol% Al) × 10-8 m3 kg-1, and for the Al-substituted hematites, χ
LF values ranged
from 166 (2.0 mol% Al) to 1,270 (17.1 mol% Al) × 10-8 m³ kg-1. Dearing (1994) established
values ranging from 41,000 to 44,000 × 10-8 m3 kg-1 for maghemite (ferrimagnetic) and
from 27 to 169 × 10-8 m3 kg-1 for hematite (antiferrimagnetic) (Figure 4); i.e., our values
are higher than those registered by Dearing (1994) and similar to those obtained by Batista et al. (2010; 2013) for synthetic maghemites.
0
0 2 4 6 8 10 12 14 16 18
200 400 600 800 1000 1200 1400
IS (Al mol%) IS (Al mol%)
42000
0 2 4 6 8 10 12 14 16 18
44000 46000 48000 50000 52000 54000 ŷ = 172.90 + 58.75x
R2
= 0.91 p<0.01
ŷ = 51708.39 + 286.29x
R2 = 0.74 p<0.01
(a) (b)
χLF (1
0
-8 m 3 kg -1 )
χLF (1
0
-8 m 3 kg -1 )
Figure 4. Mass specific magnetic susceptibility (χLF) values to synthetic Al-substituted maghemites (a) and hematites (b) samples.
With increasing IS, χLF values decreased (Figure 4b) since Al3+ is a paramagnetic ion
(Cullity, 1972; Wolska, 1990) and has a similar dilution effect on magnetization, as observed previously for Zn (Batista et al., 2008). The dilution effect might be associated
with i) partial relocation of the vacancies from octahedral to tetrahedral sites in the mineral structure (Wolska, 1990; Takei and Chiba, 1966) and ii) breaking down the order of both cation and vacancy distributions in the octahedral sub-lattice (Gillot et al., 1982). However, this decrease is not linear (Gillot et al., 1982).
The behavior of hematites was opposite to maghemites (Figure 4a). An increase in Al
substitution causes an increase in χLF values. However, this result is contrary to the
results of Murad and Schwertmann (1986). Increasing χLF values may be due to remnant
maghemite components that maintain magnetism, although XRD data only points to the presence of hematite. Increasing Al IS changes the temperature of the solid phase thermal transformation from maghemite to hematite (Sidhu, 1988); therefore even long exposure of maghemites to 500 °C temperature was not able to completely transform
maghemite to hematite, and this effect was more pronounced as IS increased.
If χLF values were used to calculate maghemite content in the samples (Figure 4a), there
would be less than 2 %, with this value hardly being detectable by the XRD technique
using a standard configuration (0.06 °2Ɵ, 0.6 s).
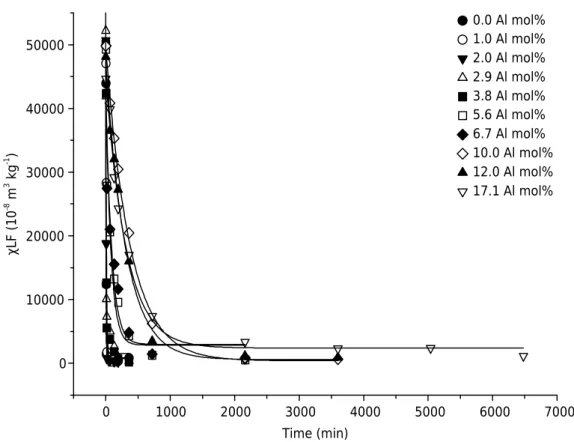
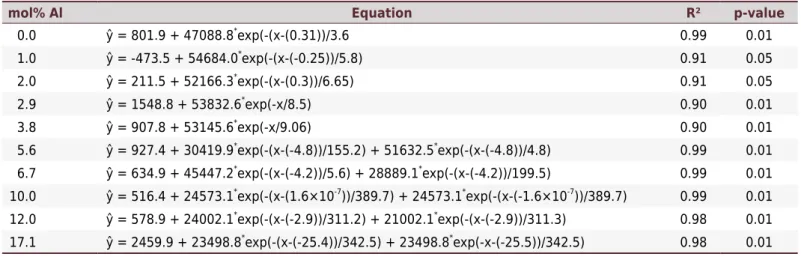
With increasing heating time, χLF values of synthetic Al-maghemites decreased
exponentially, indicating a solid state thermal transformation of a ferrimagnetic phase (maghemite) into an antiferrimagnetic one (hematite) (Figure 5). Equations concerning the adjustments are presented in table 1. To have a 90 % reduction
in χLF values, it would be necessary to heat for 23 and 1774 min for Al-free and
17.1 mol% Al, respectively.
Maghemites with a low degree of crystallinity and with IS (especially for Al, Ga, Cr, Mn, Sn, and
Ti) exhibit modified magnetic behavior (Cornell and Schwertmann, 1996). These two factors are interdependent, and it is hard to separate the substitution effect from the crystallite size effect on χLF. Hematite synthesis, for example, influences both factors. Therefore, low crystallinity
Time (min)
0 1000 2000 3000 4000 5000 6000 7000
0 10000 20000 30000 40000 50000
0.0 Al mol% 1.0 Al mol% 2.0 Al mol% 2.9 Al mol% 3.8 Al mol% 5.6 Al mol% 6.7 Al mol% 10.0 Al mol% 12.0 Al mol% 17.1 Al mol%
χLF (1
0
-8 m 3 kg -1 )
Figure 5. Mass specific magnetic susceptibility (χLF) values to synthetic Al-substituted maghemites
and Al substitution allow the coexistence of ferrimagnetic and antiferrimagnetic phases above
specific temperatures in an apparent homogeneous sample (Murad and Johnston, 1987).
Fourier transform infrared spectroscopy (FTIR) spectra
Bands of the initial members (time 0) of the FTIR spectra in figure 6 have been indexed as
maghemites by the interpretation proposed by Waldron (1955) and White and De Angelis
(1967). The end members after heat treatment (360 and 3600 min times, figures 6a and
Table 1. Fitting of equations for the mass specific magnetic susceptibility (LF) values for synthetic Al-substituted maghemites subjected
to different heating times at 500 °C
mol% Al Equation R² p-value
0.0 ŷ = 801.9 + 47088.8*
exp(-(x-(0.31))/3.6 0.99 0.01
1.0 ŷ = -473.5 + 54684.0*
exp(-(x-(-0.25))/5.8) 0.91 0.05
2.0 ŷ = 211.5 + 52166.3*
exp(-(x-(0.3))/6.65) 0.91 0.05
2.9 ŷ = 1548.8 + 53832.6*
exp(-x/8.5) 0.90 0.01
3.8 ŷ = 907.8 + 53145.6*
exp(-x/9.06) 0.90 0.01
5.6 ŷ = 927.4 + 30419.9*
exp(-(x-(-4.8))/155.2) + 51632.5*
exp(-(x-(-4.8))/4.8) 0.99 0.01
6.7 ŷ = 634.9 + 45447.2*
exp(-(x-(-4.2))/5.6) + 28889.1*
exp(-(x-(-4.2))/199.5) 0.99 0.01
10.0 ŷ = 516.4 + 24573.1*
exp(-(x-(1.6×10⁻⁷
))/389.7) + 24573.1*
exp(-(x-(-1.6×10⁻⁷
))/389.7) 0.99 0.01
12.0 ŷ = 578.9 + 24002.1*
exp(-(x-(-2.9))/311.2) + 21002.1*
exp(-(x-(-2.9))/311.3) 0.98 0.01
17.1 ŷ = 2459.9 + 23498.8*
exp(-(x-(-25.4))/342.5) + 23498.8*
exp(-x-(-25.5))/342.5) 0.98 0.01
Figure 6. FTIR spectra of synthetic Al-substituted maghemite with 0.0 (a) and 12.0 (b) mol% Al in the range 370 - 800 cm-1
. a.u. = arbitrary unit.
800 750 700 650 600 550 500 450 400 800 750 700 650 600 550 500 450 400
0 128
Wavenumbers (cm-1)
Wavenumbers (cm-1)
192 2160 3600
5 10
0 64 192 360
Absorbance (a.u.)
Absorbance (a.u.)
Ti
me (min
)
Ti
me (min
)
539.6 470.9
378.0
395.0
421.8
442.4
480.3
558.0
583.4
636.5
695.4
726.5 739.7
703.6
645.9
588.4 568.2
484.7 447.5 404.4
(a) (b)
544.7
478.6
6b, respectively) were identified as hematite (Wilson et al., 1981). In the FTIR spectra
for the intermediate heating times, a mixture of maghemite and hematite characteristic bands was observed. The samples with shorter and longer heating times were similar to the spectra of hematite and maghemite, respectively.
Fourier transform infrared spectroscopy bands that shifted to higher frequency indicate an increase in the bond energies within the maghemite structure. Therefore, if the observed
shifts are not artifacts of the method, then Al substitution introduces a significant strain
into the octahedral and tetrahedral sites associated with the Fe-O vibrations, as reported by Batista et al. (2010) for Zn-substituted maghemites.
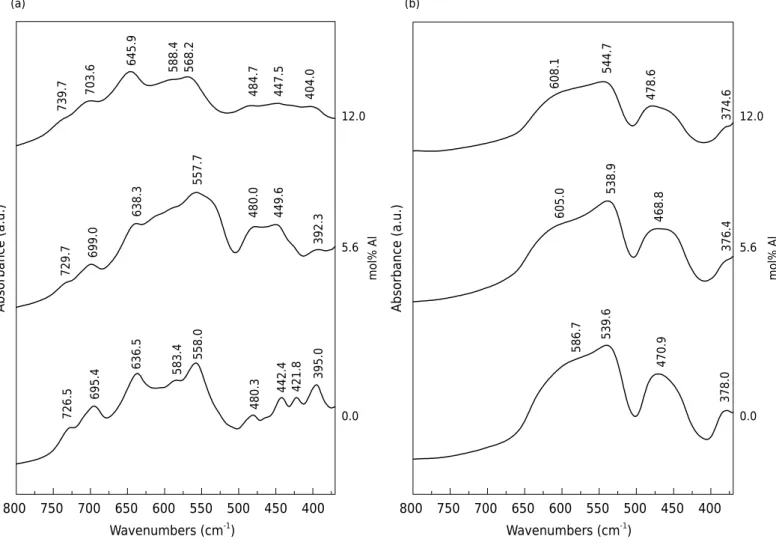
With increasing IS, the maghemite bands shifted to higher wavelengths, except the 558.0 cm-1 band, which shifted in the opposite way. Another trend was observed
for the 480.3 and 395.0 cm-1 bands,which shifted to shorter wavelengths initially
(5.6 mol% Al) and then to longer wavelengths (12.0 mol% Al). The 583.4 and 421.8 cm-1 bands disappeared with increasing IS (Figure 7a). The FTIR bands of the hematite samples shifted to shorter wavelengths initially (5.6 mol% Al) and then to longer wavelengths (12.0 mol% Al), except the 378.0 cm-1 band, which shifted to shorter
wavelengths with increasing IS (Figure 7b).
The strongest bands in hematite occur due to light scattering by the crystallites (Fysh
and Fredericks, 1983). They identified two bands (550 and 470 cm-1
) that show some change in position with increasing Al content. Accordingly, in this study, the 470 cm-1
band changed its position with IS (Figure 7b). The IR spectrum of hematite depends on
Figure 7. FTIR spectra of synthetic Al-substituted maghemite (a) and Al-hematite (b) in the range 370 - 800 cm-1
. a.u.: arbitrary unit.
800 750 700 650 600 550 500 450 400
Wavenumbers (cm-1)
800 750 700 650 600 550 500 450 400
Wavenumbers (cm-1)
726.5
695.4
636.5 583.4 558.0
480.3
442.4 421.8
395.0
392.3
557.7
638.3
699.0
729.7
739.7
703.6
645.9
588.4 568.2
484.7 447.5 404.0 608.1
544.7
478.6
374.6
376.4
468.8
538.9
605.0
586.7
539.6
470.9
378.0
12.0
5.6
0.0
12.0
5.6
0.0
Absorbance (a.u.)
Absorbance (a.u.)
(a) (b)
mol% Al mol% Al
particle shape (Serna et al., 1982). According to Barrón et al. (1984), Al substitution produces shifts in the frequencies by as much as 10 to 15 cm-1.
CONCLUSIONS
The Fe and Al contents analyzed by 1 mol L-1 KCl solution did not suggest Al migration
to hematite borders or ejection from the mineral structure.
The values of the Munsell YR hue decreased with increasing heating time, changing from brown (5.1-7.1YR) to red (0.3-2.9YR) colors.
Increasing IS led to increasing hematite and maghemite hue values; thus, the former became yellower.
The χLF values decreased with increasing heating time, indicating the transformation
of a ferrimagnetic phase (maghemite) into an antiferrimagnetic one (hematite). With
increasing IS, maghemite and hematite χLF values decreased and increased, respectively.
In maghemites, the χLF valuesranged from 44,000 (0.0 mol% Al) to 52,968 × 10 -8
m3 kg-1 (2.9 mol% Al), whereas for hematites, these values ranged from 166 (2.0 mol% Al) to 1,270 (17.1 mol% Al) × 10-8 m3 kg-1.
Bands of the initial members (time 0) in the FTIR spectra have been indexed as maghemites.
The end members after completion of the heat treatment were identified as hematite.
In the FTIR spectra for the intermediate heating times, a mixture of maghemite and hematite characteristic bands was observed.
REFERENCES
Barrón V, Rendón JL, Torrent J, Serna, CJ. Relation of infrared, crystallochemical, and morphological properties of Al-substituted hematites. Clay Clay Miner. 1984;32:475-9. doi:10.1346/CCMN.1984.0320605
Barrón V, Torrent J. Influence of aluminum substitution on the color of synthetic hematites. Clay
Clay Miner. 1984;32:157-8. doi:10.1346/CCMN.1984.0320211
Batista MA, Costa ACS, Bigham JM, Paesano Júnior A, Berndt G, Inoue TT, Nonaka AG. Structural and magnetic characterization of maghemite prepared from Al-substituted magnetites. Rev Bras Cienc Solo. 2013;37:1569-75. doi:10.1590/S0100-06832013000600013
Batista MA, Costa ACS, Bigham JM, Santana H, Zaia DAM, Souza Júnior IG. Mineralogical, chemical, and physical characterization of synthetic Al-substituted maghemites. Clay Clay Miner.2010;58:451-61. doi:10.1346/CCMN.2010.0580401
Batista MA, Costa, ACS, Souza Júnior IG, Bigham JM. Cristallochemical characterization of
synthetic Zn-substituted maghemites (γ-Fe2-xZnxO3). Rev Bras Cienc Solo. 2008;32:561-8.
doi:10.1590/S0100-06832008000200011
Bhuiyan TI, Nakanishi M, Fujii T, Takada J. Structure, morphology and color tone properties of the Neodymium substituted hematite. Mem Fac Eng Oka Uni. 2007;41:93-8.
Bigham JM, Fitzpatrick RW, Schulze D. Iron oxides. In: Dixon JB, Schulze DG, editors. Soil mineralogy with environmental applications. Madison: Soil Science Society of America; 2002. p.323-66. (Book series, 7).
Claessen MEC, organizador. Manual de métodos de análise de solo. 2a ed. Rio de Janeiro: Centro Nacional de Pesquisa de Solos; 1997.
Coey JMD, Khalafalla D. Superparamagnetrtic ɤ-Fe2O3. Phys Status Solidi(a). 1972;11:229-41.
doi:10.1002/pssa.2210110125
Costa ACS, Bigham JM, Rhoton FE, Traina SJ. Quantification and characterization of maghemite
in soils derived from volcanic rocks in southern Brazil. Clay Clay Miner. 1999;47:466-73. doi:10.1346/CCMN.1999.0470408
Costa ACS, Bigham JM. Óxidos de ferro. In: Melo VF, Alleoni LRF, editores. Química e mineralogia do solo. Conceitos básicos. Viçosa, MG: Sociedade Brasileira de Ciência do Solo; 2009. p.505-73. Cullity BD. Introduction to magnetic materials. Reading: Addison-Wesley; 1972.
Dearing J. Environmental magnetic susceptibility. Using the Bartington MS2 system. Kenilworth: Chi Publications; 1994.
Fysh SA, Fredericks PM. Fourier transform infrared studies of aluminous goethites and hematites. Clay Clay Miner. 1983;31:377-82. doi:10.1346/CCMN.1983.0310507
Gillot B, Jemmali F, Chassagneux F, Rousset A. Availability of Fe ions in Cr- or Al-substituted magnetites with relevance of the process of oxidation in defect phase. J Solid State Chem. 1982;45:317-23. doi:10,1016 / 0022-4596 (82) 90177-3
Grimley DA, Arruda NK, Bramsted MW. Using magnetic susceptibility to facilitate more rapid, reproducible and precise delineation of hydric soils in the midwestern USA. Catena. 2004;58:183-213. doi:10.1016/j.catena.2004.03.001
Jong E, Pennock DJ, Nestor PA. Magnetic susceptibility of soils in different slope positions in
Saskatchewan. Catena. 2000;40:291-305. doi:10.1016/S0341-8162(00)00080-1
Ketterings QM, Bigham JM, Laperch V. Changes in soils mineralogy and texture caused by
slash-and-burn fires in Sumatra, Indonesia. Soil Sci Soc Am J. 2000;64:1108-17. doi:10.2136/sssaj2000.6431108x Ketterings QM, Bigham JM. Soil color as an indicator of slash-and-burn fire severity and soil fertility
in Sumatra, Indonesia. Soil Sci Soc Am J. 2000;64:1826-33. doi:10.2136/sssaj2000.6451826x Kosmas CS, Franzmeier DP, Schulze DG. Relationship among derivative spectroscopy, color, crystallite dimensions, and Al substitution of synthetic goethites and hematites. Clay Clay Miner. 1986;34:625-34. doi:10.1346/CCMN.1986.0340602
Landers M, Gilkes RJ, Wells MA. Rapid dehydroxylation of nickelliferous goethite in lateritic
nickel ore: X-ray diffraction and TEM investigation. Clay Clay Miner. 2009;57:751-70.
doi:10.1346/CCMN.2009.0570608
Lugassi R, Ben-Dor E, Eshel G. Heat induced soil mineralogical changes and its corresponding spectral properties changes. In: 6th
EARSeL SIG Imaging Spectroscopy Work; 2009; Tel Aviv. Tel Aviv: Tel Aviv University; 2009.
Mckeague JA, Day JH. Dithionite- and oxalate-extractable Fe and Al as aids in differentiating
various classes of soils. Can J Soil Sci. 1966;46:13-22. doi:10.4141/cjss66-003
Mullins BA. Magnetic susceptibility of the soil and its significance in soil science. Eur J Soil Sci.
1977;28:223-46. doi:10.1111/j.1365-2389.1977.tb02232.x
Murad E, Johnston JH. Iron oxides and oxyhydroxides. In: Long G, editor.Mössbauer spectroscopy applied to inorganic chemistry. 2nd ed. New York: Plenum Publishing Corporation; 1987. p.507-82.
Murad E, Schwertmann U. Influence of Al substitution and crystal size on the
room-temperature Mössbauer spectrum of hematite. Clay Clay Miner. 1986;34:1-6. doi:10.1346/CCMN.1986.0340101
Resende M, Curi N, Rezende SB, Corrêa GF. Pedologia: Bases para distinção de ambientes. Lavras: Universidade Federal de Lavras; 2007.
Resende M, Santana DP, Rezende SB. Susceptibilidade magnética em Latossolos do Sudeste e
do Sul do Brasil. In: Anais da 3ª. Reunião de Classificação, Correlação de Solos e Interpretação
de Aptidão Agrícola; 1988; Rio de Janeiro. Rio de Janeiro: Empresa Brasileira de Pesquisa Agropecuária - SNLCS/SBCS; 1988. p.233-58.
Resende M. Mineralogy, chemistry, morphology and geomorphology of some soils of Central Plateau of Brazil [thesis]. West Lafayette: Purdue University; 1976.
Santos HG, Jacomine PKT, Anjos LHC, Oliveira VA, Oliveira JB, Coelho MR, Lumbreras JF, Cunha
Scheinost AC, Schulze DG, Schwertmann U. Diffuse reflectance spectra of Al substituted goethite: A ligand field approach. Clay Clays Miner. 1999;47:156-64.
doi:10.1346/CCMN.1999.0470205
Schwertmann U, Cornell RM. Iron oxides in the laboratory - Preparation and characterization. Weinheim: Verlagsgesellschaft; 1991.
Schwertmann U, Taylor RM. Iron oxides. In: Dixon JB, Weed SB, editors. Minerals in soil environments. 2nd
ed. Madison: Soil Science Society of America; 1989. p.379-438.
Schwertmann U. Relations between iron oxides, soil color, and soil formation. In: Bigham JM, Ciolkosz EJ, editors. Soil color. Madison: Soil Science Society of America; 1993. p.51-69. (Special publication, 31).
Serna CJ, Rendón JL, Iglesias JE. Infrared surface modes in corundum-type microcrystalline oxides. Spectrochim Acta. 1982;38A:797-802. doi:10.1016/0584-8539(82)80070-6
Sertsu MS, Sanchez PA. Effects of heating on some changes in soil properties in
relation to an Ethiopian land management practice. Soil Sci Soc Am J. 1978;42:940-4. doi:10.2136/sssaj1978.03615995004200060023x
Sidhu PS, Gilkes RJ, Posner AM. The behavior of Co, Ni, Zn, Cu, Mn and Cr in magnetite during alteration to maghemite and hematite. Soil Sci Soc Am J. 1980;44:135-8. doi:10.2136/sssaj1980.03615995004400010028x
Sidhu PS. Transformation of trace element-substituted maghemite to hematite. Clay Clay Miner. 1988;36:31-8. doi:10.1346/CCMN.1988.0360105
Silva AR, Souza Júnior IG, Costa ACS. Suscetibilidade magnética do horizonte B de solos do Estado do Paraná. Rev Bras Cienc Solo. 2010;34:329-38. doi:10.1590/S0100-06832010000200006
Socrates G. Infrared and Raman characteristic group frequencies: tables and charts. 3rd ed. London: John Wiley & Sons; 2001.
Souza Júnior IG, Costa ACS, Vilar CC, Hoepers, A. Mineralogia e susceptibilidade magnética dos óxidos de ferro do horizonte B de solos do Estado do Paraná. Cienc Rural. 2010;40:513-9. doi:10.1590/S0103-84782010000300003
Steinwehr HE. The pigment in red beds - a geological thermometer. Naturwissenschaften. 1969;56:513-4. doi:10.1007/BF00601971
Takei H, Chiba S. Vacancy ordering in an epitaxially grown single crystal of γFe2O3. J Phys Soc
Japan. 1966;21:1255-63. doi:10.1143/JPSJ.21.1255
Torrent J, Barrón V. The visible diffuse reflectance spectrum in relation to the color and crystal
properties of hematite. Clay Clay Miner. 2003;51:309-17. doi:10.1346/CCMN.2003.0510307
Ulery AL, Graham RC, Bowen LH. Forest fire effects on soil phyllosilicates in California. Soil Sci
Soc Am J. 1996;60:309-15. doi:10.2136/sssaj1996.03615995006000010047x
Ulery AL, Graham RC. Forest fire effects on soil color and texture. Soil Sci Soc Am J.
1993;57:135-40. doi:10.2136/sssaj1993.03615995005700010026x Waldron RD. Infrared spectra of ferrites. Phys Rev. 1955;99:1727-35. doi:10.1103/PhysRev.99.1727
Wells CG, Campbell RE, Debano LF, Lewis C, Fredrikicsen RL, Franklin EC, Froelich RC, Dunn PH.
Effects of fire on soil. Washington, DC: 1979. (Gen Tech Rep., WO-7, U.S. For. Serv.).
White WB, De Angelis BA. Interpretation of the vibrational spectra of spinels. Spectrochim Acta.
1967;23A:985-95. doi:10.1016/0584-8539(67)80023-0
Whittig LD, Allardice WR. X Ray diffraction techniques. In: Klute A, editor. Methods of soil analysis.
Physical and mineralogical methods. Madison: American Society of Agronomy; 1986. Pt.1. p.331-62. Wilson MJ, Russell JD, Tait JM, Clark DR, Fraser AR, Stephen I. A swelling hematite/layer-silicate complex in weathered granite. Clay Miner. 1981;16:261-77.