Article
J. Braz. Chem. Soc., Vol. 22, No. 2, 279-285, 2011. Printed in Brazil - ©2011 Sociedade Brasileira de Química
0103 - 5053 $6.00+0.00
A
*e-mail: [email protected], [email protected]
A Multicommuted Flow Analysis Method for the Photometric Determination of
Amoxicillin in Pharmaceutical Formulations using a Diazo Coupling Reaction
Sueny K. B. Freitas,a Valdinete Lins da Silva,b Alberto N. Araújo,c Maria Conceição B. S.
M. Montenegro,c Boaventura F. Reisd and Ana Paula S. Paim*,a
aDepartamento de Química Fundamental,Universidade Federal de Pernambuco,
Av. Prof. Luiz Freire, s/n, Cidade Universitária, 50740-550 Recife-PE, Brazil
bDepartamento de Engenharia Química, Universidade Federal de Pernambuco,
Av. Prof. Artur de Sá, s/n, Cidade Universitária, 50740-521 Recife-PE, Brazil
cFaculdade de Farmácia, Universidade do Porto, Rua Aníbal Cunha, 164, 4099-030 Porto, Portugal
dCentro de Energia Nuclear na Agricultura, Universidade de São Paulo,
CP 96, 13400-970 Piracicaba-SP, Brazil
Neste trabalho foi proposto um método de análise em luxo por multicomutação para a determinação de amoxicilina em formulações farmacêuticas. O método proposto é baseado na
reação de diazotização da o-nitroanilina com amoxicilina em meio alcalino, produzindo um
composto amarelo que foi monitorado em 435 nm. As características do método foram: faixa linear
de 25 até 400 mg L-1 de amoxicilina, limite de detecção de 5,1 mg L-1, frequência analítica de 50
determinações por hora e desvio padrão relativo inferior a 3,9% (n = 10) para uma amostra típica
de 100 mg L-1 amoxicilina. Para veriicar a exatidão do método, as amostras foram analisadas
empregando um método independente e aplicando-se o teste-t pareado não houve diferença
signiicativa no nível de coniança de 95%.
A multicommuted low analysis method for the spectrophotometric determination of amoxicillin in pharmaceutical formulations is reported. The proposed method is based on the reaction of
diazotised o-nitroaniline with amoxicillin in an alkaline medium, producing a yellow compound
that was monitored at 435 nm. The main features of the method were: a linear relationship with
amoxicillin concentration ranging from 25 to 400 mg L-1; a detection limit of 5.1 mg L-1; an
analytical throughput of 50 determinations per hour; and a relative standard deviation lower than
3.9% for a typical amoxicillin sample with concentration of 100 mg L-1 (n = 10). To verify the
accuracy of the method, samples were also analyzed employing an independent method, and
applying the paired t-test to the results no signiicant difference at the 95% conidence level was
observed.
Keywords: amoxicillin, multicommuted low analysis, photometry, diazo coupling reaction,
o-nitroaniline
Introduction
Amoxicillin, or hydroxyl ampicillin, is a phenolic
β-lactam antibiotic with signiicant activity against both
Gram-positive and Gram-negative bacteria.1 This antibiotic
is widely used to treat infectious diseases in humans and
animals, and to enhance both growth and yield in agriculture.2
Its widespread use, however, has led to a potential health risk,
since amoxicillin is a class of penicillin and runs the risk of
hypersensitivity reactions in some individuals.3
The therapeutic importance of amoxicillin requires the
development of a sensitive and rapid methodfor industrial
quality control and clinical monitoring. The United States
Pharmacopeia (USP) 314 suggests a high-performance
sample preparation.5 A comprehensive review of the
literature indicates a number of analytical methods for the determination of amoxicillin. These include methods based on
spectrophotometry,6-12 chemiluminescence,3,13 luorometry,14,15
polarography,16 and mass spectrometry.17,18 Electrophoresis
capilar,5,19 and HPLC20,21 are included when separation
techniques are used.
The low injection analysis (FIA) process has been widely used in order to automation/mechanization of chemical analysis, presenting among its main features versatility, high sampling throughput and minimal requirement of sample
manipulation.22 These features have been exploited to develop
analytical procedures for the determination of amoxicillin in pharmaceutical formulations employing different detection
techniques.23-26
The multicommutation process27-29 has been used as an
eficient tool to handle solutions. The system manifold is
constituted of a set of solenoid valves,29,30 and a peristaltic
pump or several solenoid micro-pumps employed to propel
the solutions.31-33 The manifold, constituted of solenoid valves30
or solenoid mini-pumps,31-33 is controlled by a microcomputer
in order to insert the sample slugs and the reagent solution into the analytical path. This resource was used in order to reduce both reagent consumption and waste generation. This was accomplished without any signiicant loss of sensitivity and accuracy of results.
The diazo coupling reaction with o-nitroaniline resulting in
the diazotized o-nitroaniline was employed as a chromogenic
reagent for the photometric determination of phenolic
β-lactam antibiotics.6
To our knowledge no method based on low injection
analysis has been proposed to determine phenolic β-lactam
antibiotics using this reagent. Thus, in this work we intended to develop a method based on multicommuted low analysis for the photometric determination of amoxicillin in pharmaceutical preparation. The method selected was based on the reaction
of diazotized o-nitroaniline and amoxicillin in an alkaline
medium, producing a yellow compound monitored at 435 nm. The low system module comprising solenoid valves and a mixing chamber was designed based on the multicommutation process in order to implement the analytical method using the
low-batch approach.29,34 Photometric detection was carried
out using a homemade LED-based photometer designed to be coupled to a low-batch chamber.
Experimental
Reagents and solutions
All solutions were prepared with analytical grade chemicals. Puriied water presenting electric conductivity
lower than 0.1 µS cm−1 was used throughout. Amoxicillin
trihydrate (Sigma, Germany) was used for preparing the working standard solutions without further puriication.
A 1000 mg L-1 amoxicillin stock solution was prepared
by dissolving 100 mg of solid amoxicillin (Sigma) in 100 mL water. Working standard solutions with
concentrations between 25 to 400 mg L-1 amoxicillin were
prepared by dilution of the stock solution.
A 0.75 mol L-1 hydrochloric acid solution was prepared
by the addition of 37.0 mL HCl concentrated (Merck, Germany) to water and the volume was made up to
500 mL. A 1.5 mol L-1 sodium hydroxide solution was
prepared by dissolving 15.0 g NaOH (Merck) in 250 mL water. A 3.0% m/v sodium nitrite solution was prepared by
dissolving 7.5 g NaNO2 (Vetec, Brazil) in 250 mL water.
A 1.0 mg mL-1 o-nitroaniline solution was prepared by
dissolving 100 mg o-nitroaniline (Fluka, Switzerland) in
0.75 mL of a 0.75 mol L-1 HCl solution. After dissolution,
the volume was completed to 100 mL with water.
Pharmaceutical formulations
The following pharmaceutical preparations were analyzed: Amoxicillin generic, Amoximed, Amoxina, Neo Moxilin, and Ocylin. All samples were in capsule
form, containing 100 or 400 mg of amoxicillin per
capsule.
The contents of 10 capsules of each drug were homogenized and 100 or 400 mg of the powder was dissolved in water, the solution was stirred during 15 min and transferred into each 100 mL calibrated lask.
Instrumentation
The equipment set up consisted of a microcomputer equipped with an electronic interface card (PCL711S, American Advantech Corp., San Jose, CA, USA), and running with a software written in Quick BASIC 4.5; an IPC4 Ismatec peristaltic pump furnished with a Tygon
pumpingtube; three three-way solenoid valves (161T031,
NResearch, West Caldwell, NJ, USA); one double pinch solenoid valve (NResearch, 161P011); two solenoid micro-pumps (Biochem valve, 090SP, Morris County, NJ,
USA), with a nominal volume of 8 µL per stroke; a low
line of polyethylene tubing (0.8 mm i.d.); an electronic interface with power and current intensity suficient to
drive the valves and micro-pumps;29-33 a homemade reaction
chamber; two glass-cylinders, 20 mm long with a diameter
of 2.0 mm; one blue LED (λ= 435 nm); a photodiode (Burr
Brown©, OPT301, Tucson, AZ, USA); transistor BD547;
The low system and the photometer
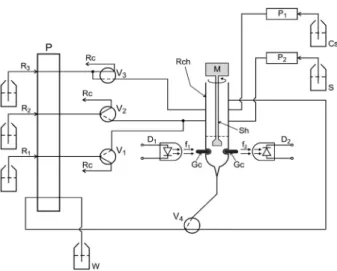
The diagram of the proposed setup is shown in Figure 1. The reaction chamber (Rch) was machined from a Telon block and its form was similar to that which had been
used in an earlier work.29 Comprised of a cylindrical hole
perforated at the longitudinal axis of the Telon block with a 10 mm inner diameter and a 40 mm height. The radiation
beam (f1) emitted by the LED (D1) crossed the reaction
chamber (Rch) towards the photodiode (D2).
The electronic diagram of the photometer is shown
in Figure 2. The difference in electric potential (S0) has a
linear relationship to the intensity of the radiation beam (f2).
Therefore, when a solution in the chamber absorbs
radiation, the intensity of the beam f2 becomes lower than
that of beam f1. The signal S0 generated by a photodetector
is directly related to the variation of the intensity of f2.
The micro-pumps P1 and P2 can deliver a solution
volume of 8 µL per stroke. When they were used, a
pulsation frequency of 5 Hz was maintained to switch them ON/OFF.
The sequence of events carried out by the microcomputer to implement the proposed analytical method under development is shown in Table 1. When the software was run, the values of time and cycles columns were displayed on the screen of the microcomputer, thus their values could be kept current.
Prior to beginning the analytical run, the following steps were implemented by computer: steps one, two and three (Table 1) illing the low lines with solutions, washing
Table 1. Sequence of events carried out when the software was run
Step Event V1 V2 V3 V4 P1 P2 M time cycles
1 Filling low lines 1 1 1 1 1/0 1/0 0 0.1/0.1 30
2 Washing chamber 0 0 0 0 1/0 0 1 0.1/0.1 50
3 Emptying chamber 0 0 0 1 0 0 1 50
-4 Inserting water 0 0 0 0 1/0 0 0 0.1/0.1 50
5 Photometer calibration 0 0 0 0 0 0 0 0
-6 Emptying Chamber 0 0 0 1 0 0 0 50
-7 Inserting Reagent R1 1 0 0 0 0 0 0 5 3
8 Inserting Reagent R2 0 1 0 0 0 0 1 2
9 Inserting sample 0 0 0 0 0 1/0 0 0.1/0.1 25
10 Solutions mixing 0 0 0 0 0 0 1 10
-11 Inserting reagent R3 0 0 1 0 0 0 1 12
-12 Solutions mixing 0 0 0 0 0 0 1 10
-13 Reading signal 0 0 0 0 0 0 0 15
-The notations “0” and “1” indicate that the corresponding device is switched OFF or ON, respectively. -The notation “0.1/0.1” indicate that the time interval for switching ON/OFF the mini-pumps were both of 0.1 s.
Figure 1. Diagram of the low system. S = sample; Cs = washing luid (water); R1 = sodium nitrite solution (3.0% m/v), 1.0 mg mL-1, low rate 1.0 mL min-1;
R2 = ortho-nitroaniline solution, 1.0 mg mL-1, low rate 1.0 mL min-1; R3 = sodium
hydroxide solution, 1.5 mol L-1, low rate 1.0 mL min-1; P = peristaltic pump;
V1, V2 and V4 = three-way solenoid valves; V3 = double pinch solenoid valve; P1 and P2 = solenoid micro-pumps; Rch = reaction chamber; M = mini-motor, 12 V DC ; Sh = PVC mixing stem; D2 = photodetector; D1 = light emitting diode (LED), λ = 435 nm; W = waste; f1 and f2 = light beams; Gc = glass cylinders;
Rc = recycle of solutions. The continuous and interrupted lines in the valves symbols indicate the solutions pathway through the valves when each one is switched OFF or ON, respectively.
Figure 2. Diagram of the photometer. LED = light emitting diode,
and emptying the reaction chamber (Rch). The computer made these by sending a set of electric pulses through the output port of the PCL 711 S interface card to switch on the solenoid valves and micro-pumps, following the sequence indicated in the Table 1. Afterwards, the photometer calibration (steps 4 and 5) was carried out manually by
turning the variable resistor (5 kΩ) wired to the base of the
transistor (Figure 2) until the signal (S0) generated by the
photodetector attained 2000 mV. This signal was used by the microcomputer as a reference to calculate absorbance. Afterwards, the chamber was emptied by switching ON the
valves V4 (step 6). After this step, the system was ready to
carry out the analytical run, which was made by performing the sequence of events indicated in Table 1.
The microcomputer read the signal through the analog input of the PCL 711S interface card, which converted the information to digital. After the conversion, the microcomputer calculated the absorbance using the
following equation: Absorbance = – log (S/S0), where S
is the read signal and S0 is the reference measurement
achieved at the point when the photometer calibration step was performed. The measurement was saved as an ASCII ile to allow further treatment. While the analytical run progressed, a plot of the generated signal was displayed on the microcomputer screen to allow its visualization in the real time. After the signal reading event (step 13), the software execution returned to the step 6 in order to empty the chamber, thus beginning the next analytical run.
The variables investigated to develop the analytical
method were volumes of sample, and reagents R1, R2 and
R3 inserted into the reaction chamber. After establishing
the best operating conditions, a set of pharmaceutical formulation samples were analyzed. To test the accuracy of the assessment, the samples were also analyzed employing an independent method.
Results and Discussion
In this work, the development of the reaction occurs
in two steps: in the irst step the reaction of o-nitroaniline
with sodium nitrite occurs in an acid medium producing the diazo compound. In the second, the diazo compound in alkaline medium coupled with the amoxicillin and produced
a compound that was monitored at 435 nm.6 The reaction
involving diazotized o-nitroaniline as the chromogenic
reagent for the determination of amoxicillin is shown below (Scheme 1).
The irst assays were carried out using a common low injection system, and an excess of gas bubbles from the sample zone was observed. This effect made the low system impractical. To overcome this drawback, the low
system module was re-designed to use the low-batch
approach.29,34,35 The open chamber and the eficient mixing
obtained using a mini-motor removed the gas bubbles from the bulk of the sample solution in the reaction chamber.
The factors that could affect the reaction of diazotised
o-nitroaniline and amoxicillin in alkaline medium, and as
well as the stability of the compound formed were studied. The control parameters of the low system designed for the photometric determination of amoxicillin were optimized by an univariate method, which was carried out using a
solution 100 mg L-1 amoxicillin.
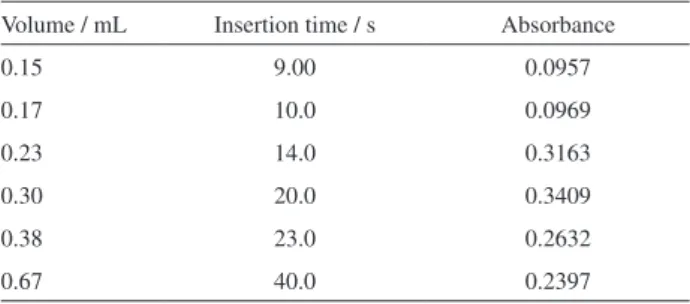
Effect of the o-nitroaniline solution volume
The inluence of the o-nitroaniline (R2) solution volume
was studied by varying the aliquot volume between 0.15 and 0.67 mL, which was accomplished by varying the
time interval to maintain valve V2 (Figure 1) switched ON
between 9.0 and 40.0 s (Table 2). When solution volumes higher than 0.30 mL were used, a decrease in sensitivity was observed. This effect could be caused by the dilution of the sample bulk, thus to prevent sensitivity hampering the volume of 0.30 mL was selected.
Effect of the NaOH volume
The effects of the sodium hydroxide solution volume on the analytical signal were investigated by varying the volumes from 0.20 to 0.77 mL, which was carried out by
Scheme 1. Reaction of diazo coupling of amoxicillin with o-nitroaniline.
NO2
NH2
NaNO2/HCl
NO2
N2
OH
CH
NH2
CONH
N
O
S CH3
CH3
COOH OH
NO2
R O
O2N
R = C
NH2
CONH
N
O
S CH3
CH3
COOH
varying the time interval which kept the valve V3 switched
ONfrom 12.0 to 46.0 s. The results are shown in Table 3
and it may be seen that solution volume of 0.20 mL NaOH gave the highest absorbance. Thus this volume was selected for further assays.
Effect of sample volume
The effect of the sample volume on sensitivity was studied by varying the volume between 0.08 and 0.25 mL, yielding the results shown in Table 4. As we can see, when sample volume varied from 0.08 up to 0.20 mL, the analytical signal underwent a signiicant increase. When compared with signals related to the volumes 0.20 and 0.25 mL, we can observe that the increase of the signal was less than 5.0%. Therefore, the volume of 0.20 mL was selected as a compromise between sensitivity, sampling throughput and waste generation.
Optimization of reagents concentration
The chemical variables studied included different concentrations of hydrochloric acid, sodium hydroxide
and sodium nitrite solution. The o-nitroaniline solution was
prepared in an acid medium. The effect of the hydrochloric acid concentration was investigated with solutions varying
from 0.50 to 1.50 mol L-1. It may be seen in Table 5 that
acidity of the medium exerts a strong inluence on the analytical signal (absorbance). Since a better response was
achieved when the acid concentration was 0.75 mol L-1, this
concentration was selected.
The effect of the sodium hydroxide solution concentration was investigated by varying its concentration
from 0.1 to 2.0 mol L-1, yielding the results shown in
Table 6. As we can see, a better result was obtained when the
sodium hydroxide concentration was 1.5 mol L-1. Analyzing
these results we can observe that reaction development was inhibited, when the concentration of the sodium hydroxide
solution was lower or higher than 1.5 mol L-1. Considering
this observation, 1.5 mol L-1 NaOH solution was selected.
The concentration of sodium nitrite solution was varied from 1.0 to 3.5% m/v, yielding the results shown in Table 7.
Table 2. Effect of the o-nitroaniline diazotized solution volume on the analytical signal
Volume / mL Insertion time / s Absorbance
0.15 9.00 0.0957
0.17 10.0 0.0969
0.23 14.0 0.3163
0.30 20.0 0.3409
0.38 23.0 0.2632
0.67 40.0 0.2397
Results are the average of four consecutive determinations, which were obtained by processing amoxicillin standard solution containing 250 mg L-1.
Table 3. Effect of the NaOH solution volume on the analytical signal
Volume / mL Insertion time / s Absorbance
0.20 12.0 0.3566
0.37 22.0 0.3224
0.43 26.0 0.3157
0.48 29.0 0.2612
0.77 46.0 0.2706
Results are the average of four consecutive determinations, which were obtained by processing amoxicillin standard solution containing 250 mg L-1.
Table 4. Effect of sample volume on the analytical signal
Volume / mL Number of Pulses Absorbance
0.08 10 0.1902
0.12 15 0.2616
0.16 20 0.3409
0.20 25 0.4656
0.25 31 0.4856
Results are average of four consecutive determinations, which were obtained by processing amoxicillin standard solution containing 250 mg L-1. Volumes of NaOH and o-nitroaniline diazotized solution were
maintained at 0.20 mL and of 0.30 mL, respectively.
Table 5. Effect of hydrochloric acid concentration
Concentration / (mol L-1) Absorbance
0.50 0.0395
0.75 0.1860
1.00 0.0822
1.50 0.0747
Results are the average of four consecutive determinations, which were obtained by processing standard amoxicillin standard solution containing 250 mg L-1.
Table 6. Effect of the NaOH concentration
Concentration / (mol L-1) Absorbance
0.1 0.0156
0.5 0.0295
1.0 0.1860
1.5 0.2105
2.0 0.0404
These results demonstrate that the increase in absorbance tends to have a constant value for the sodium nitrite solution concentration equal to or higher than 3.0% m/v, so this concentration was selected in order to ensure an excess of reagent in the reaction chamber to guarantee the reaction development.
Potential interferences
Interference studies were carried out in order to investigate the effect of some compounds such as starch, croscarmellose sodium, talc, magnesium stearate, sodium laurilsulphate, silicon dioxide usually found in the amoxicillin formulations. The tolerance limit was taken as the amount that caused a relative error of ± 5.0% in peak height. The results are shown in Table 8. As it can be seen, the tolerance limits were: 100-fold for starch, croscarmellose sodium, magnesium stearate and sodium laurilsulphate; and 5-fold for talc and silicon dioxide.
Figures of merit and accuracy
The analytical curve was linear within the range
of 25 to 400 mg L-1 amoxicillin presenting a typical
equation y = (0.05762 ± 0.00536) + (0.00127 ± 0.00536)x
(R = 0.9997), where y = absorbance and x = mg L-1
amoxicillin concentration. The relative standard deviation was 3.9% (n = 10), estimated by processing a typical
sample containing 100 mg L-1 amoxicillin. Other favorable
characteristics include: a reagent consumption of 7.5 mg sodium nitrite, 12 mg sodium hydroxide and 1.0 mg
o-nitroaniline per determination; a sampling throughput of
50 determinations per hour; a detection limit of 5.1 mg L-1
amoxicillin estimated according to the recommendation
of IUPAC36 (three times of the blank standard deviation
divided by the slope of the analytical calibration curve);
and a quantiication limit of 17.1 mg L-1 estimated as
recommended by IUPAC.36
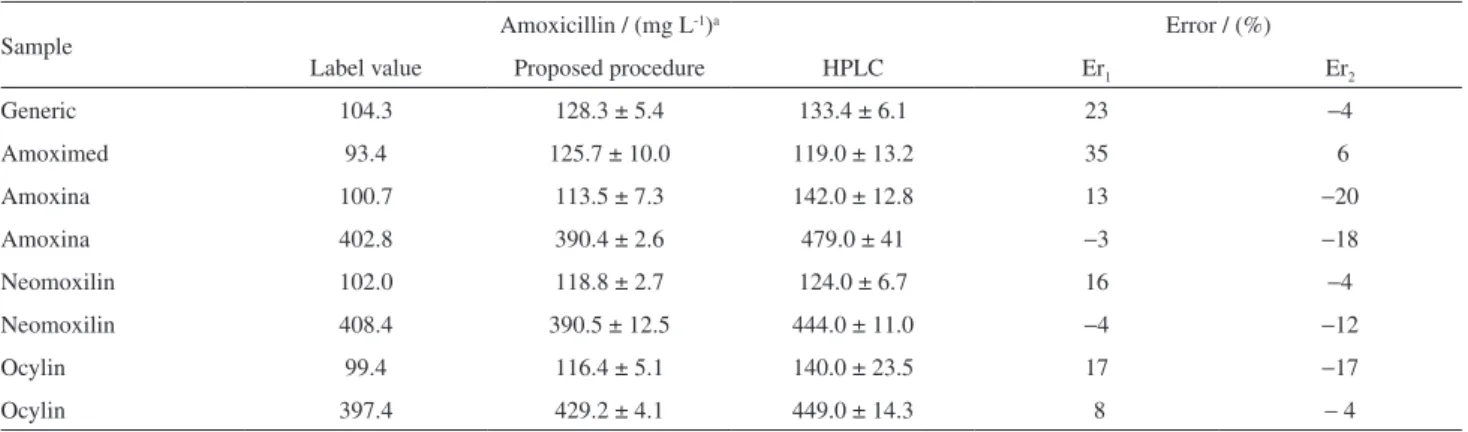
The proposed flow system was applied under optimized conditions to determine amoxicillin in commercial formulations. Aiming at an accurate assessment, samples were also analyzed employing
HPLC with a UV-Vis detection method.6 The results are
shown in Table 9. Applying the paired t-test between
the results for a 95% conidence level, it was found that
t0.05 = 0.8947, while the theoretical value is t0.05 =4.303.
Since the experimental value is lower than the theoretical value, there is no signiicant difference between results at 95% conidence level.
Table 7. Effect of the NaNO2 concentration
Concentration / (%, m/v) Absorbance
1.0 0.1607
1.5 0.1765
2.0 0.1815
3.0 0.1860
3.5 0.1850
Results are the average of four consecutive determinations, which were obtained by processing amoxicillin standard solution containing 250 mg L-1.
Table 8. Tolerance concentration ratio (interferent/amoxicillin) of several species in the determination of amoxicillin (200 mg L-1 amoxicillin)
Foreign species Tolerated concentration*
Croscarmellose sodium, sodium laurilsulphate, magnesium stearate and starch
100a
Talc and silicon dioxide 5a
*Data are interferent/analyte concentration ratios, in mg L-1. aMaximum
tested ratio.
Table 9. Amoxicillin determination in pharmaceuticals formulations employing the low system developed and the reference HPLC method4
Sample Amoxicillin / (mg L
-1)a Error / (%)
Label value Proposed procedure HPLC Er1 Er2
Generic 104.3 128.3 ± 5.4 133.4 ± 6.1 23 −4
Amoximed 93.4 125.7 ± 10.0 119.0 ± 13.2 35 6
Amoxina 100.7 113.5 ± 7.3 142.0 ± 12.8 13 −20
Amoxina 402.8 390.4 ± 2.6 479.0 ± 41 −3 −18
Neomoxilin 102.0 118.8 ± 2.7 124.0 ± 6.7 16 −4
Neomoxilin 408.4 390.5 ± 12.5 444.0 ± 11.0 −4 −12
Ocylin 99.4 116.4 ± 5.1 140.0 ± 23.5 17 −17
Ocylin 397.4 429.2 ± 4.1 449.0 ± 14.3 8 − 4
aMean ± standard deviation; Er
Conclusions
The use of the flow-batch approach avoided the drawback that would be caused by the gas bubbles entering into the sample bulk. Its implementation employing the multicommutation process made it possible to obtain an analytical method simple to operate, with high sensitivity, low consumption of the sample and the reagents, high throughput, accuracy and precision.
The long-term stability of the proposed setup is satisfactory. This was ascertained by running the process several days for a time period of at least of 3 h. No signiicant variations of baseline and noise level were observed. In this sense, we can afirm that the proposed setup together with the proposed method could be employed to carry out large scale analysis.
Acknowledgments
Financial support from, CAPES/GRICES, FACEPE and CNPq is gratefully acknowledged. The authors are grateful to Severino Granjeiro Junior (LAFEPE and UFPE) to help in HPLC analyses.
References
1. Remers, W. A.; Delgado, J. N.; Wilson and Gisvold´s Textbook of Organic Medicinal and Pharmaceutical Chemistry, 9th ed.,
J. B. Lippincott: New York, 1991.
2. Gilman, A. G.; Goodman, L. S.; Gilman, A. Z.; Goodman and Gilman’s, the Pharmacological Basis of Therapeutics, 9th ed.,
McGraw-Hill: New York, 1995.
3. Li, Y.; Lu, J.; Luminescence 2006, 21, 251.
4. USP 31; The United States Pharmacopeia, 31st ed., Rockville,
2008.
5. Pajchel, G.; Pawlowski, K.; Tyski, S.; J. Pharm. Biomed. Anal.
2002, 29, 75.
6. Salem, H.; Saleh, G. A.; J. Pharm. Biomed. Anal.2002, 28, 1205.
7. Salem, H.; Anal. Chim. Acta 2004, 515, 333.
8. Belal, F.; El- Kerdawy, M. M.; El-Ashry, S. M.; El-Wasseef, D. R.; Farmaco 2000, 55, 680.
9. Pasamontes, A.; Callao, M. P.; Anal. Chim. Acta 2004, 515, 159.
10. Li, Q.; Yang, Z.; Anal. Lett. 2006, 39, 763.
11. Fatibello-Filho, O.; Vieira, H. J.; Ecl. Quim. 2008, 33, 47. 12. Suarez, W. T.; Madi, A. A.; Figueiredo-Filho, L. C. S.;
Fatibello-Filho, O.; J. Braz. Chem. Soc. 2007, 18, 1215. 13. Liu, W.; Zhang, Z.; Liu, Z.; Anal. Chim. Acta 2007, 592, 187. 14. Muñoz de La Peña, A.; Acedo-Valenzuela, M. I.; Espinosa-Mansilla, A.; Sánchez-Maqueda, R.; Talanta 2002, 56, 635.
15. Bebawy, L. I.; El Kelani, K.; Abdel Fattah, L.; J. Pharm. Biomed. Anal. 2003, 32, 1219.
16. Gaber, A. A. A.; Ghandour, M. A.; El-Said, H. S.; Anal.Lett.
2003, 36, 1245.
17. Li, B.; Zhang, T.; Xu, Z.; Fang, H. H. P.; Anal. Chim. Acta 2009,
645, 64.
18. Kantiani, L.; Farré, M.; Sibum, M.; Postigo, C.; López de Alda, M.; Barceló, D.; Anal. Chem. 2009, 81, 4285.
19. Santos, S. M.; Henriques, M.; Duarte, A. C.; Esteves, V. I.;
Talanta 2007, 71, 731.
20. Benito-Peña, E.; Urraca, J. L.; Moreno-Bondi, M. C.; J. Pharm. Biomed. Anal. 2009, 49, 289.
21. Liu, H.; Wang, H.; Sunderland, V. B.; J. Pharm. Biomed. Anal.
2005, 37, 395.
22. Al-Momani, I. F.; Anal. Lett. 2004, 37, 2099.
23. Ruiz-Medina, A.; Fernandez-de Cordova, M. L.; Diaz, A. M.;
Anal. Lett. 1999, 32, 729.
24. Chivulescu, A. I.; Danet, A. F.; Kalinowski, S.; Rev. Chim. 2005,
56, 695.
25. Altiokka, G.; Can, N. O.; Aboul-Enein, H. Y.; J. Liq. Chromatogr. Relat. Technol., 2007, 30, 1333.
26. Molina-Garcia, L.; Llorent-Martinez, E. J.; Fernandez-de Cordova, M. L.; Ruiz-Medina, A.; Spectrosc. Lett. 2010, 43, 60. 27. Reis, B. F.; Gine, M. F.; Zagatto, E. A. G.; Lima, J. L. F. C.;
Lapa, R. A.; Anal. Chim. Acta 1994, 293, 129.
28. Pires, C. K.; Martelli, P. B.; Reis, B. F.; Lima, J. L. F. C.; Saraiva, M. L. F. S.; J. Autom. Methods Manage. Chem. 2003, 25, 109. 29. Garcia, A. J. C.; Reis, B. F.; J. Autom. Methods Manage. Chem.
2006, Article ID 83247; DOI 10.1155/JAMMC/2006/83247. 30. Feres, M. A.; Reis, B. F.; Talanta 2005, 68, 422.
31. Lavorante, A. F.; Pires, C. K.; Reis, B. F.; J. Pharm. Biomed. Anal. 2006, 42, 423.
32. Meneses, S. R. P.; Marques, K. L.; Pires, C. K.; Santos, J. L. M.; Fernandes, E.; Lima, J. L. F. C.; Zagatto, E. A. G.; Anal. Biochem. 2005, 345, 90.
33. Lavorante, A. F.; Morales-Rubio, A.; de la Guardia, M.; Reis, B. F.; Anal. Bioanal. Chem. 2005, 381, 1305.
34. Honorato, R. S.; Araújo, M. C. U.; Lima, R. A. C.; Zagatto, E. A. G.; Lapa, R. A. S.; Lima, J. L. F. C.; Anal. Chim. Acta 1999,
396, 91.
35. da Silva, M.; dos Anjos, E.; Honorato, R. S.; Pimentel, M. F.; Paim, A. P. S.; Anal. Chim. Acta 2008, 629, 98.
36. Recommendations for the deinition, estimation and use of the detection limit, Analyst 1987, 112, 199.
Submitted: May 14, 2010 Published online: September 30, 2010