Erratum
Revista de Saúde Pública Volume 34(4), 2000
Tabela 3/ Table 3 - Página/ Page 384
Os valores da segunda e terceira coluna da Tabela 3 foram copiados por engano da Tabela 4. Substituir a Tabela
conforme a seguir / Values of the second and third columns on Table 3 were miscopied from Table 4. Please
replace the Table as follows:
Rev Saúde Pública 2006;40(3):558
Tabela 3 antiga/ Former Table 3:
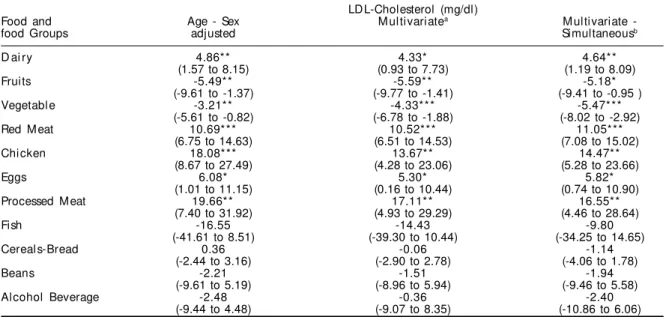
Tabela 3 atual/ Correct Table 3:
Table 3 – Regression coefficients - β1 (95% confidence interval) of food frequency consumption of food groups in linear models
with LDL-Cholesterol as dependent variable.
Food and food Groups
Dairy
Fruits
Vegetable
Red meat
Chicken
Eggs
Processed Meat
Fish
Cereals-Bread
Beans
Alcohol Beverage
Age – Sex adjusted
4.86**
(1.57 to 8.15) -5.49**
(-9.61 to -1.37) -3.21**
(-5.61 to -0.82) 10.69***
(6.75 to 14.63) 18.08***
(8.67 to 27.49) 6.08*
(1.01 to 11.15) 19.66**
(7.40 to 31.92) -16.55 (-41.61 to 8.51)
0.36 (-2.44 to 3.16)
-2.21 (-9.61 to 5.19)
-2.48 (-9.44 to 4.48)
Multivariatea
-0.57 (-1.62 to 0.52)
-0.17 (-1.48 to 1.14)
-0.25 (-1.04 to 0.46)
0.26 (-0.99 to 1.51)
-1.05 (-3.94 to 1.84)
-1.45 (-3.03 to 0.13)
-2.06 (-5.81 to 1.69)
-3.09 (-10.72 to 4.54)
-1.07*
(-1.94 to -0.20) -3.33**
(-5.61 to -1.05) 6.95***
(4.32 to 9.58)
Multivariate
-simultaneousb
-0.31 (-1.39 to 0.77)
-0.13 (-1.48 to 1.22)
0.01 (-0.79 to 0.81)
0.25 (-0.99 to 1.49)
-0.56 (-3.44 to 2.32)
-1.39 (-2.97 to 0.19)
-2.67 (-6.44 to 1.10)
-4.75 (-12.38 to 2.88)
-0.65 (-1.56 to 0.26)
-3.22**
(-5.57 to -0.87) 7.23***
(4.59 to 9.87) HDL-Cholesterol
(mg/dl)
a Model includes age (continuous variable); sex (male=1); body mass index/standard deviation (continuous variable); waist to hip
ratio/standard deviation (continuous variable); educational level (five categories); family income (four categories); physical activity
(three categories); smoking habits (smoker > 10 cigarettes per day); Ethylism (alcoholic by CAGE questionnaire13).
b Additionally adjusted for food frequency consumption of food and food groups (continuous variable).
* p < .05; ** p < .01; *** p < .001
Table 3 - Regression coefficients - β1 (95% confidence interval) of food frequency consumption of food groups in linear models with LDL-Cholesterol as dependent variable.
LD L-Cholesterol (mg/dl)
Food and Age - Sex M ultivariatea M ultivariate
-food Groups adjusted Simultaneousb
D ai ry 4.86** 4.33* 4.64**
(1.57 to 8.15) (0.93 to 7.73) (1.19 to 8.09)
Fruits -5.49** -5.59** -5.18*
(-9.61 to -1.37) (-9.77 to -1.41) (-9.41 to -0.95 ) Vegetabl e -3.21** -4.33*** -5.47***
(-5.61 to -0.82) (-6.78 to -1.88) (-8.02 to -2.92) Red M eat 10.69*** 10.52*** 11.05***
(6.75 to 14.63) (6.51 to 14.53) (7.08 to 15.02) Chi cken 18.08*** 13.67** 14.47**
(8.67 to 27.49) (4.28 to 23.06) (5.28 to 23.66)
Eggs 6.08* 5.30* 5.82*
(1.01 to 11.15) (0.16 to 10.44) (0.74 to 10.90) Processed M eat 19.66** 17.11** 16.55**
(7.40 to 31.92) (4.93 to 29.29) (4.46 to 28.64)
Fish -16.55 -14.43 -9.80
(-41.61 to 8.51) (-39.30 to 10.44) (-34.25 to 14.65)
Cereal s-Bread 0.36 -0.06 -1.14
(-2.44 to 3.16) (-2.90 to 2.78) (-4.06 to 1.78)
Beans -2.21 -1.51 -1.94
(-9.61 to 5.19) (-8.96 to 5.94) (-9.46 to 5.58) Alcohol Beverage -2.48 -0.36 -2.40
(-9.44 to 4.48) (-9.07 to 8.35) (-10.86 to 6.06)
aModel includes age (continuous variable); sex (male=1); body mass index/standard deviation (continuous variable); waist to
hip ratio/standard deviation (continuous variable); educational level (five categories); family income (four categories); physical activity (three categories); smoking habits (smoker >10 cigarettes per day); Ethylism (alcoholic by CAGE questionnaire13). bAdditionally adjusted for food frequency consumption of food and food groups (continuous variable).