Sandhi Maria BarretoI Roberta Carvalho de FigueiredoII
I Departamento de Medicina Preventiva e Social. Faculdade de Medicina (FM). Universidade Federal de Minas Gerais (UFMG). Belo Horizonte, MG, Brasil II Programa de Pós-Graduação em Saúde
Pública. FM-UFMG. Belo Horizonte, MG, Brasil
Correspondence: Sandhi Maria Barreto
Av. Alfredo Balena 190, sala 814 30130-100 Belo Horizonte, MG, Brasil E-mail: [email protected] Received: 11/28/2008
Revised: 7/27/2009 Approved: 8/19/2009
Chronic diseases, self-perceived
health status and health risk
behaviors: gender differences
ABSTRACT
OBJECTIVE: To assess the association between chronic diseases and health risk behaviors and self-perceived health status by gender.
METHODS: A total of 39.821 adults (30+ years old) who participated in the
system Vigilância de Fatores de Risco e Proteção para Doenças Crônicas por
Inquérito Telefônico (VIGITEL – Telephone-Based Surveillance of Risk and Protective Factors for Chronic Diseases) carried out in 27 Brazilian capitals in 2006 were included in the study. The dependent variable was medical diagnosis reporting of diabetes, hypertension and myocardial infarct or stroke. Respondents were grouped into three categories: no disease; one chronic disease; and two or more. The associations between the dependent variable and sociodemographic characteristics, behavioral risk factors (smoking, consumption of fatty meat and whole milk, leisure-time physical inactivity, low fruit and vegetable intake and intake of added salt) and self-perceived health status were assessed in men and women using multinomial logistic regression.
RESULTS: Chronic disease reporting was higher among older men and women
with lower schooling, BMI≥30kg/m2 and who were on a diet. There was an
inverse association between number of risk behaviors and two or more chronic diseases (OR: 0.64; 95% CI: 0.54;0.76 among men and OR: 0.86; 95% CI: 0.77;0.97 among women). Those men (OR: 33.61; 95% CI: 15.70;71.93) and women (OR: 13.02; 95% CI: 6.86;24.73) who self-perceived their health as poor reported more chronic diseases. There was no statistical interaction between self-perceived health status and gender.
CONCLUSIONS: An inverse association between number of risk behaviors and reporting of two or more chronic diseases suggests a reverse causality and/or higher survival rates among those who take better care of themselves. Men seem to have poorer perception of their health status compared to women, after adjustment for confounders.
a Ministério da Saúde. VIGITEL Brasil 2006. Vigilância de fatores de risco e proteção para doenças crônicas por inquérito telefônico: estimativas sobre freqüência e distribuição sócio-demográfi ca de fatores de risco e proteção para doenças crônicas nas capitais dos 26 estados brasileiros e no Distrito Federal em 2006. Brasília; 2007.
Chronic non-communicable diseases (CNCD) account for almost 60% of deaths worldwide.21 A mortality study
conducted in Brazilian capitals between 1930 and 1980 reported a shift in the mortality trends from the mid-1960s with marked reduction of mortality rates due to infectious and parasitic diseases and increased CNCD including cardiovascular diseases and diabetes.9
Self-reported morbidity has been an approach used in health surveys such as the Brazilian National House-hold Survey (PNAD) and the National Health and Nutrition Examination Survey in the United States. Besides providing information on CNCD, many pop-ulation-based surveys also provide data on prevalence of modifi able risk factors for CNCD, which enables to monitor them and identify shifts over time.
From early 1980s, longitudinal studies have sup-ported the predictive ability of self-perceived health status on ensuing mortality in adults and functional decline in elderly populations. Answers in a Likert-type scale to questions about one’s own health status compared to same-age individuals are better predic-tors of mortality than objective health assessments, refl ecting that people have an integrated perception of their own health, including biological, psychologi-cal, and social dimensions.12,16
The magnitude of association between self-perceived health status and chronic diseases, limited daily ac-tivities due to health conditions and health behaviors
seems to vary according to gender.18 In Canada, a
study investigating the association between self-per-ceived health status and chronic diseases showed that social and psychosocial determinants have a stronger impact on women’s health while behavioral determi-nants play a major role on men’s health.3 While men
are less likely to report health conditions than women, they more often perceive their health as poor.11
The objective of the present study was to analyze the association between chronic disease reporting and risk behaviors and self-perceived health status,
strati-fi ed by gender.
METHODS
The Brazilian Ministry of Health implemented in 2006 the Telephone-Based Surveillance of Risk and
Protec-tive Factors for Chronic Diseases (VIGITEL).a This
system allows ongoing monitoring of prevalence and distribution of risk and protective factors for chronic diseases in 26 Brazilian capitals and Federal District.
INTRODUCTION
VIGITEL sampling comprised a systematic drawing of 5,000 telephone lines per city, followed by redraw-ing of telephone lines in each city and groupredraw-ing into 25 replicates of 200 lines. All active home telephone lines were eligible to participate in the study. All in-dividuals aged ≥18 years living in the household were listed and one of them was drawn to be interviewed. VIGITEL has set a minimum sample of 2,000 individ-uals per city to estimate the prevalence of risk factors
for CNCD in adults with 95% confi dence and
maxi-mum error of two percent points. Data was collected through computer-assisted telephone interviews in probabilistic samples of adult population living in households with fi xed telephone lines.
Of 76,330 telephone calls made, 54,369 interviews were complete (71%) with response rates ranging be-tween 64.4% (Porto Alegre, RS) and 81.0% (Palmas, TO). Unanswered calls were due to permanently busy lines, lines connected to fax or answering machines or impossibility to locate the adult selected from a household after 10 attempts. Refusal rate was 9.1%, ranging from 5.4% (Palmas) to 15.0% (Porto Alegre). Of 54,369 respondents, 21,294 were males and 33,075 were females. Detailed survey methods were described by Moura et al (2008) and published elsewhere.14
Telephone interviews took on average 7.4 minutes (median 6.9 minutes, standard deviation 3.3 minutes) and a structured questionnaire was applied. The pres-ent study included 39,821 adults (15,033 men and
24,788 women) aged ≥30 years. The dependent
vari-able was medical diagnosis reporting of diabetes, hy-pertension, myocardial infarction and/or stroke, which are all conditions with common behavioral risk fac-tors. The respondents were divided into three groups: no chronic diseases; one chronic disease; and two or more chronic diseases.
The independent variables were sociodemographic and behavioral factors, and health indicators. Sociode-mographic variables included gender, age (30–39; 40– 49; 50–59; 60–69; and ≥70 years old), self-referred skin color/race (white; black; mixed; Asian; and in-digenous), marital status (married; single; separated; divorced and widowed), and schooling (0–8, 9–11, and ≥12 years).
at least 30 minutes a day in fi ve or more days a week; or vigorous activity for at least 20 minutes a day in three or more days a week); current smoking regardless of the amount consumed; and practice to add salt to pre-pared food. Health indicators included body mass index (BMI), calculated using self-referred weight and height and categorized into <25 kg/m², 25–29 kg/m², and ≥30 kg/m2; currently on a diet (no/yes); and self-perceived
health status (excellent, good, fair, and poor).
Risk behaviors were scored in a 0–6 scale correspond-ing to the sum of conditions: smokcorrespond-ing, consumption of fatty red meat and/or poultry with skin, consump-tion of whole milk, leisure-time physical inactivity, fruit and vegetable intake less than fi ve times a week, and intake of added salt. This continuous variable was also used to test the modifying effect of health perception on the relationship between risk profi le and presence of chronic disease.
Pearson’s chi-square test was performed to compare chronic disease reporting and age between men and women. The association between chronic diseases and independent variables was assessed through multinomial logistic regression. Considering that variables in the same domain are more likely to act as confounders, an intermediate multivariate analysis was performed within each block, including all vari-ables associated at a level of signifi cance of p<0.20 in the univariate analysis.
Only those variables included in the three intermediate models were tested in the fi nal multivariate analysis at a 5% level of signifi cance. Risk behavior was includ-ed in the fi nal model as a continuous variable instead of individual behavioral variables. In the analysis, the reference category was having no chronic diseases. The magnitude of association was verifi ed using odds ratios (OR) and 95% confi dence intervals. The inter-actions between self-perceived health status and risk behaviors were tested by including interaction terms in the fi nal model stratifi ed by gender.
All analyses were conducted using Stata (version 9.2). To correct for the probability of selecting households with more than one telephone line and number of
people living in the same household, different weights
were assigned to each respondent. Given that fi xed
telephone coverage is not universal, a weighting factor was used to approach the sample’s sociodemographic composition to that of those aged 18 years and more in each city. Additionally, a second weighting was applied to take into account differences between populations of each city and number of individuals selected per city.
As this was a telephone survey, an oral consent from all respondents was obtained at the time of phone
contact. VIGITEL was approved by the Comissão
Nacional de Ética em Pesquisa para Seres Humanos
(Human Research Ethics Committee) of the Brazilian Ministry of Health.
RESULTS
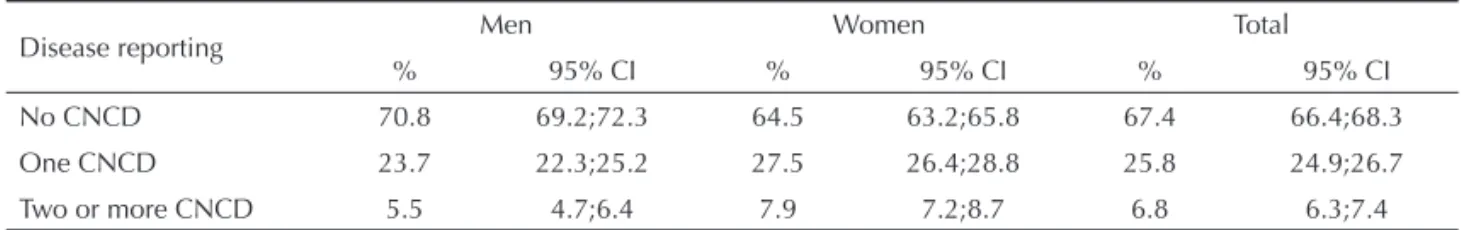
The prevalences of people with one or two or more
CNCD were signifi cantly higher among women
(Ta-ble 1).
The bivariate analysis showed that men with one or
two or more CNCD were older, had ≤12 years of
schooling and were mostly single, divorced, separated or widowed. Reporting two or more CNCD was about
22 times more common among men aged ≥70 years
than those aged 30–39. Skin color did not show any as-sociation with CNCD reporting among men (Table 2).
Reporting one or two or more CNCD was signifi
-cantly higher among older women, and reporting two or more CNCD were 62 times more common among
women aged ≥70 years compared to those aged 30–
39. CNCD reporting was more frequently seen among women with lower schooling, who were single, di-vorced, separated or widowed. Skin color was also not associated with CNCD reporting (Table 2).
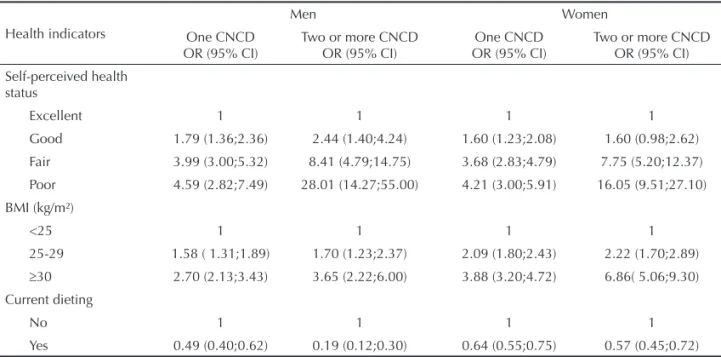
Men with one CNCD were almost fi ve times more
likely to perceive their health as poor compared to those reporting no chronic diseases. And men with two or more CNCD were 28 times more likely to per-ceive it as poor. BMI ≥30 kg/m² was associated with one (OR=2.70; 95% CI: 2.13;3.43) and two or more
Table 1. Distribution of men and women (aged ≥30 years) according to chronic non-communicable disease reporting. Brazil, 2006.
Disease reporting Men Women Total
% 95% CI % 95% CI % 95% CI
No CNCD 70.8 69.2;72.3 64.5 63.2;65.8 67.4 66.4;68.3
One CNCD 23.7 22.3;25.2 27.5 26.4;28.8 25.8 24.9;26.7
Two or more CNCD 5.5 4.7;6.4 7.9 7.2;8.7 6.8 6.3;7.4
Pearson’s chi-square test, Pr=0.000 CNCD: Chronic non-communicable disease
a Weighed percent to adjust the sociodemographic distribution of VIGITEL sample to entire adult population from 2000
CNCD reporting (OR=3.65; 95% CI: 2.22;6.00). Among men, there was an inverse association be-tween being on a diet and one reporting one CNCD (OR=0.49; 95% CI: 0.40;0.62) or two or more CNCD (OR=0.19; 95% CI: 0.12;0.30) (Table 3).
The prevalence of poor self-perceived health status was four times higher among women with one CNCD than in those who reported no chronic disease, and about 16 times higher among those with two or more CNCD.
Women with BMI ≥30 kg/m² were almost four times
more likely to report one CNCD, and almost seven times more likely to report two or more CNCD. Being on a diet was inversely associated with reporting of one CNCD (OR=0.64; 95% CI: 0.55;0.75) and two or more CNCD (OR=0.57; 95% CI: 0.45;–0.72). (Table 3)
The consumption of fatty red meat or poultry was in-versely associated to reporting of one CNCD (OR=0.71; 95% CI: 0.60;0.83) and two or more CNCD (OR=0.33; 95% CI: 0.24;0.45) among men. Added salt to prepared food showed an inverse association (OR=0.82; 95% CI: 0.70;0.96) with reporting of one chronic disease
among men, but it was not associated with reporting of two or more chronic diseases. Fruit and vegetable in-take was lower (OR= 0.51; 95% CI: 0.35;0.75) among those with two or more CNCD (Table 4).
As for leisutime physical activity, men who re-ported having two or more CNCD were more active (OR= 0.56; 95% CI: 0.35;0.90) than those who re-ported no CNCD. Consumption of whole milk and having at least one risk behavior were inversely as-sociated with reporting of one or two or more CNCD among men (Table 4).
The consumption of fatty red meat among wom-en was inversely associated with reporting of one CNCD (OR=0.78; 95% CI: 0.67;0.91) and two or more CNCD (OR=0.60; 95% CI: 0.46;0.80). Adding salt to prepared food showed an inverse association (OR=0.79; 95% CI: 0.70;0.90) with reporting of one CNCD, but was not associated with reporting of two or more CNCD. Women who reported CNCD were less active than those who reported no CNCD. Con-sumption of whole milk and having at least one risk
Table 2. Odds ratioaof chronic non-communicable diseases reporting among men and women (aged ≥30 years) according to
sociodemographic characteristics.b Brazil, 2006.
Sociodemographic characteristic
Men Women
One CNCD OR (95% CI)
Two or more CNCD OR (95% CI)
One CNCD OR (95% CI)
Two or more CNCD OR (95% CI)
Age (years) 1.06 (1.05;1.06) 1.09 (1.07;1.10) 1.05 (1.05;1.06) 1.09 (1.08;1.10)
Age groups (years)
30-39 1 1 1 1
40-49 2.05 (1.59;2.63) 1.38 (0.57;3.38) 1.76 (1.43;2.18) 5.75 (2.85;11.62)
50-59 4.26 (3.27;5.56) 6.59 (2.80;15.53) 3.88 (3.11;4.84) 22.95 (11.89;44.31)
60-69 6.22 (4.62; 8.38) 13.58 (5.70;32.33) 7.55 (5.98;9.53) 59.97 (31.18;115.32)
≥70 8.37 (6.15;11.38) 21.58 (9.17;50.79) 7.91 (6.25;10.02) 61.71 (32.20;118.26)
Schooling (years)
0-8 1 1 1 1
9-11 0.86 (0.72;1.02) 0.44 (0.32;0.61) 0.50 (0.44;0.57) 0.33 (0.26;0.43)
≥12 0.88 (0.73;1.07) 0.66 (0.46;0.94) 0.38 (0.32;0.45) 0.17 (0.12;0.24)
Marital status
Married 1 1 1 1
Single 1.88 (1.47;2.39) 1.77 (0.79;3.98) 1.18 (0.98;1.41) 2.28 (1.66;3.12)
Divorced./Separated/
Widowed 2.49 (1.76;3.52) 3.32 (1.41;7.81) 2.18 (1.79;2.65) 5.26 (3.84;7.20)
Skin color
White 1 1 1 1
Black 1.43 (0.99;2.07) 1.11 (0.57;2.14) 1.63 (1.24;2.14) 1.68 (1.12;2.51)
Mixed 0.93 (0.78;1.09) 0.87 (0.62;1.22) 1.09 (0.96;1.24) 0.96 (0.77;1.19)
Asian 0.53 (0.12;2.39) 11.99 (3.92;36.64) 1.27 (0.57;2.83) 0.93 (0.29;2.94)
Indigenous 1.28 (0.31;5.21) 0.98 (0.20;4.70) 0.67 (0.13;3.41) 0.07 (0.01;0.58)
a Weighed percent to adjust the sociodemographic distribution of VIGITEL sample to entire adult population from 2000
Population Census in each city.
behavior were inversely associated with reporting of both one and two or more CNCD (Table 4).
In the multivariate analysis, 9–11 years of schooling
among men and ≥12 years of schooling among women
remained inversely associated with reporting of one or
two or more CNCD. BMI of 25–29 kg/m2 and ≥30 kg/
m2 remained associated with reporting of one or two
or more CNCD in both men and women. Being on a diet and number of risk behaviors remained inversely associated with reporting one or two or more CNCD in both men and women. The variable self-perceived health status remained associated with reporting of one or two or more CNCD in both men and women. It was also found that the inclusion of self-perceived health status in the model did not change the association with risk behaviors. Poor self-perceived health sta-tus remained associated with reporting of one CNCD (OR=4.41 in men and OR=3.32 in women) and two or more CNCD, being the magnitude of association among men (OR= 33.61) greater than the magnitude among women (OR=13.02). However, this variation in the magnitude of self-perceived health status by gender was no statistically different (Table 5).
The interaction between self-perceived health status and risk behaviors was not statistically signifi cant.
DISCUSSION
The present study showed an inverse association be-tween chronic disease reporting and risk behaviors but this association is not affected by self-perceived health status. Men and women with CNCD had poor-er ppoor-erception of their health, but thpoor-ere was no statisti-cal interaction between self-perceived health status and gender.
Epidemiological studies are commonly based on self-reported information as it is a relatively simple and low-cost approach to data collection. However, quality of reporting varies depending on the condi-tion studied.2,10,a Cardiovascular diseases and diabetes
seem to be adequately reported in Brazil due to its uni-versal health coverage.14
The prevalence of CNCD reporting increased with age and the magnitude of this association was greater among women. This remarkable increase was also
de-scribed in the 2003 PNAD study and other studies.8,b
Longer life span is parallel to increasing disease bur-den and social impact of CNCD.
The inverse association found between schooling and chronic disease reporting corroborates data from the 2003 PNAD, which showed a prevalence of CNCD 62% higher among adults with lower schooling.
Table 3. Odds ratioa of chronic non-communicable disease reporting among men and women (aged ≥30 years) according to
health indicators. Brazil, 2006.b
Health indicators
Men Women
One CNCD OR (95% CI)
Two or more CNCD OR (95% CI)
One CNCD OR (95% CI)
Two or more CNCD OR (95% CI)
Self-perceived health status
Excellent 1 1 1 1
Good 1.79 (1.36;2.36) 2.44 (1.40;4.24) 1.60 (1.23;2.08) 1.60 (0.98;2.62)
Fair 3.99 (3.00;5.32) 8.41 (4.79;14.75) 3.68 (2.83;4.79) 7.75 (5.20;12.37)
Poor 4.59 (2.82;7.49) 28.01 (14.27;55.00) 4.21 (3.00;5.91) 16.05 (9.51;27.10)
BMI (kg/m²)
<25 1 1 1 1
25-29 1.58 ( 1.31;1.89) 1.70 (1.23;2.37) 2.09 (1.80;2.43) 2.22 (1.70;2.89)
≥30 2.70 (2.13;3.43) 3.65 (2.22;6.00) 3.88 (3.20;4.72) 6.86( 5.06;9.30)
Current dieting
No 1 1 1 1
Yes 0.49 (0.40;0.62) 0.19 (0.12;0.30) 0.64 (0.55;0.75) 0.57 (0.45;0.72)
a Weighed percent to adjust the sociodemographic distribution of VIGITEL sample to entire adult population from 2000
Population Census in each city.
b Reference category: no chronic disease.
BMI: Body mass index.
a Ministério da Saúde. Inquérito domiciliar sobre comportamentos de risco e morbidade referida de doenças e agravos não transmissíveis: Brasil, 15 capitais e Distrito Federal, 2002-2003. Rio de Janeiro: INCA; 2004
Higher prevalence of CNCD has also been reported in other countries in individuals with lower schooling or income.8,10
CNCD reporting was more commonly seen among non-married respondents. This fi nding corroborates
that reported in a study by GAZEL13 that reported
higher number of diseases in those living alone com-pared to those living with a partner. This association seems to be due to greater exposure of non-married individuals to behavioral risk factors for CNCD.7 In
the present study, this association was seen in the uni-variate analysis but it disappeared in the fi nal model.
Higher rates of CNCD reporting seen in men and
women with BMI ≥30kg/m² support an association
between weight gain, abdominal obesity, and devel-opment of diabetes and cardiovascular diseases.21
The present study showed that CNCD was associated to poor self-perceived health status in both men and women. However, men were over two times more
likely to perceive their health as poor, although the gender difference was not statistically signifi cant. Even though men tend to report less health conditions than women, they seem to have a poorer perception of
their health when they are diagnosed with CNCD.3,19
Studies on health-related gender differences in indus-trialized countries showed that, although women live longer than men, they tend to report more health con-ditions and psychological problems and utilize more health services. This apparent contradiction is attenu-ated by different age-relattenu-ated disease patterns.17,19
Our results show that respondents who reported CNCD consumed less added salt and whole milk and smoked less. A similar association was seen between risk behaviors and CNCD reporting, suggesting prob-ably a reverse causality. Cross-sectional studies have demonstrated that this fi nding largely refl ects lifestyle changes because of disease and/or longer survival of those who report fewer risk behaviors. Individu-als with CNCD tend to utilize more health services and thus are advised to change their behaviors
includ-Table 4. Odds ratioaof chronic non-communicable disease reporting among men and women (aged ≥30 years) according to
selected risk behaviors. Brazil, 2006.b
Variable
Men Women
One CNCD OR (95% CI)
Two or more CNCD OR (95% CI)
One CNCD OR (95% CI)
Two or more CNCD OR (95% CI)
Consumption of fatty red meat or poultry
No 1 1 1 1
Yes 0.71 (0.60;0.83) 0.33 (0.24;0.45) 0.78 (0.67;0.91) 0.60 (0.46;0.80)
Intake of added salt
Não 1 1 1 1
Sim 0.82 (0.70;0.96) 1.02 (0.76;1.38) 0.79 (0.70;0.90) 1.02 (0.83;1.25)
Current smoking
No 1 1 1 1
Yes 0.85 (0.69;1.04) 0.42 (0.28;0.64) 0.72 (0.59;0.88) 0.66 (0.45;0.98)
Low fruit and vegetable intakec
No 1 1 1 1
Yes 0.85 (0.71;1.02) 0.51 (0.35;0.75) 0.95 (0.83;1.08) 1.30 (0.94;1.77)
Leisure-time physical inactivityd
No 1 1 1 1
Yes 0.91 (0.79;1.21) 0.56 (0.35;0.90) 0.90 (0.76;1.08) 1.43 (1.14;1.80)
Consumption of whole milk
No 1 1 1 1
Yes 0.84 (0.72;0.99) 0.51 (0.38;0.69) 0.81 (0.72;0.92) 0.67 (0.54;0.82)
Risk behaviore 0.85 (0.79;0.91) 0.59 (0.52;0.68) 0.86 (0.81;0.90) 0.85 (0.78;0.93)
a Weighed percent to adjust the sociodemographic distribution of VIGITEL sample to entire adult population from 2000
Population Census in each city.
b Reference category: no chronic disease.
c Consumption less than fi ve days a week.
d Inadequate leisure-time physical activity: no leisure-time physical activity; no mild or moderate activity for at least 30 minutes
a day in fi ve or more days a week; or no intense activity for at least 20 minutes a day in three or more days a week.
ing dietary changes and smoking cessation as these positive changes can delay or prevent complications commonly associated to CNCD mortality. An inverse association is a positive indicator especially among men with medical conditions because it suggests bet-ter care of their health.
The present study did not fi nd an interaction between poor self-perceived health status and risk behaviors, suggesting a need for longitudinal studies to further investigate whether poor self-perceived health status is associated to health behavioral changes. Health self-perception can infl uence behaviors that may have a late effect on health; individuals who self-perceive their health as poor tend to have more risk behaviors.6
A longitudinal study conducted in Russia15 showed
that smoking was signifi cantly associated to mortal-ity, but not with poor health perception. The results of the present study suggest that poor self-perceived health status can be correlated to lower prevalence of risk behaviors among those with CNCD, especially in men with two or more CNCD, compared to those reporting no CNCD. A nested case-control study con-ducted in adults who had myocardial infarction found a relationship between poor self-perceived health sta-tus and number of risk factors.20 Another case-control
study on risk factors for stroke identifi ed a higher, though not statistically signifi cant, positive interaction between poor self-perceived health status and
smok-ing in men compared to women.4 This assumption
may explain the apparent paradox seen in the present study, but it needs to be further investigated in longi-tudinal studies.
The present study design does not allow to making any causal or temporal inferences on the associations
found. Self-reported information may be infl uenced
by access to health services and recall bias. However, studies carried out in Brazil and other countries have demonstrated the validity of self-reported informa-tion with good sensitivity and specifi city to detect health conditions. 9,16
The main advantages of telephone-based surveys compared to face-to-face interviews is that the former are less costly and time-consuming and potentially have greater coverage of areas for data collection. Nonetheless, even in countries with wide telephone coverage, respondents of telephone surveys have dif-ferent characteristics compared to general population, especially regarding income and schooling. The same is true in Brazil, where access to fi xed telephone line
Table 5. Factors statistically associated to one or two or more chronic disease reporting among men and women (aged ≥30
years) in the multivariate analysis. Brazil, 2006.a
Variable
Men Women
One CNCD
ORb(95% CI Two or more CNCDORb (95% CI) OROne CNCDb(95% CI) Two or more CNCDORb (95% CI)
Age (years) 1.06 (1.05;1.07) 1.09 (1.07; 1.10) 1.05 (1.05;1.06) 1.09 (1.08;1.10)
Schooling (years)
0-8 1 1 1 1
9-11 1.13 (0.93; 1.38) 0.64 (0.43;0.95) 0.69 (0.59;0.82) 0.64 (0.48;0.85)
≥12 1.01 (0.81;1.26) 0.68 (0.43;1.08) 0.55 (0.46;0.67) 0.37 (0.26;0.53)
BMI (kg/m²)
<25 1 1 1 1
25-29 1.63 (1.34;1.99) 1.78 (1.23;2.63) 1.59 (1.35;1.88) 1.55 (1.17;2.07)
≥30 2.58 (2.01;3.31) 3.26 (2.03;5.23) 2.77 (2.23;3.44) 3.98 (2.79;5.68)
Current dieting
No 1 1 1 1
Yes 0.64 (0.49;0.83) 0.25 (0.17;0.39) 0.77 (0.63;0.92) 0.57 (0.42;0.78)
Risk behavior 0.89 (0.82;0.96) 0.64 (0.54;0.76) 0.86 (0.80;0.92) 0.86 (0.77;0.97)
Self-perceived health status
Excellent 1 1 1 1
Good 1.70 (1.26;2.30) 2.43 (1.33;4.33) 1.50 (1.09;2.06) 1.44 (0.80;2.57)
Fair 3.61 (2.62;4.98) 7.83 (4.21;14.58) 3.11 (2.24;4.32) 6.58 (3.74;11.57)
Poor 4.41 (2.56;7.58) 33.61 (15.70;71.93) 3.32 (2.17;5.09) 13.02 (6.86;24.73)
a Reference category: no chronic disease.
b Weighed percent to adjust the sociodemographic distribution of VIGITEL sample to entire adult population from 2000
a Ministério da Saúde. VIGITEL Brasil 2006. Vigilância de fatores de risco e proteção para doenças crônicas por inquérito telefônico: estimativas sobre freqüência e distribuição sócio-demográfi ca de fatores de risco e proteção para doenças crônicas nas capitais dos 26 estados brasileiros e no Distrito Federal em 2006. Brasília; 2007.
is determined by socioeconomic factors. Therefore, poor populations are usually underrepresented in the samples while those with higher purchase power are overrepresented as they may have more than one phone line at home.1,8
A recent study based on PNAD data found that the existence of a subgroup of people living in households with no telephone lines and having different sociode-mographic and geographical characteristics can be a source of error and may affect the predefi ned level of confi dence for the estimates found. An approach com-monly applied to counterbalance errors resulting from the exclusion of households with no fi xed telephone lines is to adjust the distribution of the sample with telephone lines to that of the entire population accord-ing to telephone line-related characteristics.5 Thus,
potential distortions associated to the inferences made are expected to be reduced.
In Brazil, fi xed telephone coverage is estimated be-tween 31.4% and 89.9% in the lowest and highest quintiles of per capita family income distribution of
households in 27 cities included in VIGITEL.a
De-spite these differences, VIGITEL had a high response rate (71.1%), which contributed to improved data
quality, allied to weighting factors applied to reduce
bias.14 The number of male respondents (n=15,033)
was much lower than female respondents (n=24,788) in this study, suggesting a differential participation rate by gender. However, this may not affect the as-sociations studied because the analysis was stratifi ed by gender and there is no indication that participation was related to the variables included in the analysis.
Albeit men and women take into account the same factors while assessing their own health,18 the
diag-nosis of CNCD seems to have a different impact on
self-perceived health status.9 Men who have been
1. Bernal R, Silva NN. Cobertura de linhas telefônicas residenciais e vícios potenciais em estudos
epidemiológicos. Rev Saude Publica. 2009;43(3):421-6.
DOI:10.1590/S0034-89102009005000024 1 2. De Bruin A, Picavet HS, Nossikov A. Health interview
surveys. Towards international harmonization of
methods and instruments. WHO Reg Publ Eur Ser.
1996;58:i-xiii,1-161. 2
3. Denton M, Prus S, Walters V. Gender differences in health: a Canadian study of the psychosocial, structural and behavioural determinants of health.
Soc Sci Med. 2004;58(12):2585-600. DOI:10.1016/j. socscimed.2003.09.008 3
4. Emmelin M, Weinehall L, Stegmayr B, Dahlgren L, Stenlund H, Wall S. Self-rated ill-health strengthens the effect of biomedical risk factors in predicting stroke, especially for men - an incident case
referent study. J Hypertens. 2003;21(5):887-96.
DOI:10.1097/00004872-200305000-00012 5 5. Groves RM, Biemer PP, Lyberg LE, Massey JT, Nicholls
II WL, Waksberg J. Telephone survey methodology. New York: John Wiley & Sons; 2001.
6. Idler EL, Benyamini Y. Self-rated health and mortality:
a review of twenty-seven community studies. J Health
Soc Behav. 1997;38(1):21-37. DOI:10.2307/2955359 7
7. Joung IM, van de Mheen H, Stronks K, van Poppel FW, Mackenbach JP. Differences in self-reported morbidity
by marital status and by living arrangement. Int J
Epidemiol.1994;23(1):91-7. DOI:10.1093/ije/23.1.91
8. Lethbridge-Cejku M, Schiller JS, Bernadel L. Summary health statistics for US adults: National
Health Interview Survey, 2002. Vital Health Stat 10.
2004;(222):1-151. 8
9. Lima-Costa MF, Peixoto SV, Firmo JOA. Validade da hipertensão arterial auto-referida e seus determinantes
(projeto Bambuí). Rev Saude Publica.
2004;38(5):637-42. DOI:10.1590/S0034-89102004000500004 9
10. Macintyre S, Der G, Norrie J. Are there socioeconomic differences in responses to a commonly used self
report measure of chronic illness? Int J Epidemiol.
2005;34(6):1284-90. DOI:10.1093/ije/dyi200 10
11. Macintyre S, Ford G, Hunt K. Do women “over-report” morbidity? Men’s and women’s responses to structured prompting on a standard question on long standing
illness. Soc Sci Med. 1999;48(1):89-98. DOI:10.1016/
S0277-9536(98)00292-5 11
12. Martin LM, Leff M, Calonge N, Garrett C, Nelson DE. Validation of self-reported chronic conditions and
health services in a managed care population. Am J
Prev Med. 2000;18(3):215-8. DOI:10.1016/S0749-3797(99)00158-0 12
13. Metzger MH, Goldberg M, Chastang JF, Leclerc A, Zins M. Factors associated with self-reporting of chronic
health problems in the French GAZEL cohort. J Clin
Epidemiol. 2002;55(1):48-59. DOI:10.1016/S0895-4356(01)00409-7 13
14. Moura EC, Morais Neto OL, Malta DC, Moura L, Silva NN, Bernal R, et al. Vigilância de fatores de risco para doenças crônicas por inquérito telefônico nas capitais dos 26 estados brasileiros e no Distrito Federal
(2006). Rev Bras Epidemiol. 2008;11(supl 1):20-37.
DOI:10.1590/S1415-790X2008000500003 14
15. Perlman F, Bobak M. Determinants of self-rated health
and mortality in Russia - are they the same? Int J Equity
Health. 2008;25:7-19. 15
16. Quesnel-Vallée A. Self-rated heatlh: caught in the
crossfi re of the quest for “true”health? Int J Epidemiol.
2007; 36(6):1161-4. DOI:10.1093/ije/dym236 16
17. Schulz R, Mittelmark M, Kronmal R, Polak J, Hirsch F, German CH, et al. Predictors of perceived health status in elderly men and women. The Cardiovascular
Health Study. J Aging Health. 1994;6(4):419-47.
DOI:10.1177/089826439400600401 17
18. Udén AL, Elofsson S. Do different factors explain
self-rated in men and women? Gend Med.
2006;3(4):295-308. DOI:10.1016/S1550-8579(06)80218-4 18
19. Verbrugge LM. The Twain meet: empirical explanations
of sex differences in health and mortality. J Health Soc
Behav. 1989;30(3):282-304. DOI:10.2307/2136961 19
20. Weinehall L, Johnson O, Jansson JH, Boman K, Huhtasaari F, Hallmans G, et al. Perceived health modifi es the effect of biomedical risk factors in the prediction of acute myocardial infarction. An incident case-control study from northern Sweden. J Intern Med. 1998;243(2):99-107. DOI:10.1046/j.1365-2796.1998.00201.x 20
21. World Health Organization. The world health report 2002: reducing risks, promoting healthy life. Geneva; 2002. 21
REFERENCES
SM Barreto was supported by a research grant from the Conselho Nacional de Desenvolvimento Científi co e Tecnológico (CNPq – National Council for Scientifi c and Technological Development) (Protocol Nr. 300159/99-4).
This article underwent the peer review process adopted for any other manuscript submitted to this journal, with anonymity guaranteed for both authors and reviewers. Editors and reviewers declare that there are no confl icts of interest that could affect their judgment with respect to this article.