Original article
screening scores among infants
O efeito da pobreza no escore de triagem do desenvolvimento de lactentes
Giselle Souza de Paiva
I, Ana Cláudia Vasconcelos Martins de Souza Lima
II, Marilia de Carvalho Lima
III, Sophie Helena Eickmann
IVPostgraduate Program on Child and Adolescent Health, Universidade Federal de Pernambuco (UFPE), Recife, Pernambuco, Brazil
IMSc. Physiotherapist, Universidade Estadual de Ciências da Saúde de Alagoas (UNCISAL), Maceió, Alagoas, Brazil.
IIOT, PhD. Associate professor, Department of Occupational Therapy, Universidade Federal de Pernambuco (UFPE), Recife, Pernambuco, Brazil. IIIMD, PhD. Associate professor, Department of Maternal and Child Health, Universidade Federal de Pernambuco (UFPE), Recife, Pernambuco, Brazil.
ABSTRACT
CONTEXT AND OBJECTIVE: Child development is negatively inluenced by multiple risk factors associated with poverty, thus indicating the importance of identifying the most vulnerable groups within populations that are apparently homogeneous regarding their state of socioeconomic deprivation. This study aimed to identify different levels of poverty in a population of low socioeconomic condition and to ascertain their inluence on infants’
neuropsychomotor development.
DESIGN AND SETTING: Cross-sectional study conducted at four Family Health Units in the Health District IV in the city of Recife, Brazil.
METHODS: The sample comprised 136 infants aged 9 to 12 months, which represented 86% of all the infants in this age group, registered at the units studied. Socioeconomic status was assessed through a speciic index and child development through the Bayley III screening test.
RESULTS: Around 20% of the families were in the lowest quartile of the socioeconomic level index and these presented the highest frequency of infants with suspected delay in receptive communication. Maternal and paternal unemployment negatively inluenced receptive communication
and cognition, respectively. Not possessing a cell phone (a relection of low socioeconomic status) was associated with worse cognitive performance and gross motricity. Male infants showed a higher frequency of suspected delay in receptive communication.
CONCLUSIONS: Infants of more precarious socioeconomic status more frequently present suspected developmental delay. Development monitoring and intervention programs should be encouraged for this subgroup, thereby providing these children with a better chance of becoming productive
citizens in the future.
RESUMO
CONTEXTO E OBJETIVO: O desenvolvimento infantil é inluenciado negativamente por múltiplos fatores de risco associados à pobreza, tornando
relevante a identiicação de grupos mais vulneráveis numa população aparentemente homogênea quanto à sua condição de privação socioeconômica. O objetivo deste estudo foi identiicar diferentes níveis de pobreza em uma população de baixa condição socioeconômica e veriicar sua inluência
no desenvolvimento neuropsicomotor de lactentes.
DESENHO E LOCAL DO ESTUDO: Estudo transversal realizado em quatro Unidades de Saúde da Família do Distrito Sanitário IV da cidade do Recife,
Brasil.
MÉTODOS: Amostra constou de 136 crianças entre 9 e 12 meses de vida, representando 86% dos lactentes cadastrados nesta faixa etária nas
unidades estudadas. A condição socioeconômica foi avaliada segundo um índice de medição especíico e o desenvolvimento através do teste de triagem da Bayley III.
RESULTADOS: Cerca de 20% das famílias encontravam-se no quartil inferior do índice do nível socioeconômico, e apresentaram frequência mais elevada de crianças com suspeita de atraso na comunicação receptiva. O desemprego materno e paterno inluenciou negativamente a comunicação
receptiva e cognição, respectivamente. Não possuir telefone celular, reletindo o baixo nível socioeconômico, esteve associado a um pior desempenho cognitivo e da motricidade grossa. As crianças do sexo masculino apresentaram maior frequência de suspeita de atraso na comunicação receptiva.
CONCLUSÕES: Lactentes com condições socioeconômicas mais precárias apresentam mais frequentemente suspeita de atraso no desenvolvimento. A vigilância ao desenvolvimento e programas de intervenção deve ser enfatizada para este subgrupo, proporcionando-lhes maior chance de se
tornarem cidadãos produtivos no futuro.
KEY WORDS:
Child development.
Socioeconomic factors. Poverty.
Primary health care. Infant.
PALAVRAS-CHAVE:
Desenvolvimento infantil. Fatores socioeconômicos.
Pobreza.
Atenção primária à saúde.
Lactente.
INTRODUCTION
With infant mortality rates on the decline over the last few decades, greater attention has been paid to observing biopsychosocial risk factors among children, thus emphasizing early detection of delayed neuropsy-chomotor development, especially in low socioeconomic groups.1
A recent study estimated that more than 200 million children under the age of ive years may not achieve their full cognitive de-velopmental potential due to poverty, precarious health and nutri-tional conditions and lack of environmental stimulation.2 Children
on neuropsychomotor development.3-9 During the irst years of life,
the impact of these factors becomes even more signiicant, since dur-ing this period there is rapid brain growth and intensive development of cognitive and motor skills. his is a time when the central nervous system is extremely vulnerable to environmental inluences.3
A number of authors have studied the mechanisms through which poverty may inluence infant development.3,4,6-13 hese
ind-ings have suggested that delayed neuropsychomotor development is more serious and most probably occurs when children are obliged to live under conditions of extreme poverty for long periods of their lives.7,13,14 Poverty limits children’s access to stimulation and learning,
due to the lack of available material resources.4,6,7,11,13,15 It also exposes
them to stressful conditions, of both physical4,11-14 and psychosocial
nature.4,9,12,13,15,16 here is evidence that these factors may lead to
de-lays in cognitive, socioemotional and linguistic development among children.2,4,5,9,10,13
However, since poverty is such a complex theme, many of these issues have still not been well established. he majority of studies in-vestigating this ield have grouped individuals together in a broad cat-egory of low socioeconomic conditions, and have not taken into con-sideration the diferent levels of poverty and the possible concentra-tion of risk factors at some of these levels.10,14,17
Recognizing that poverty is a more predominant feature in devel-oping countries such as Brazil, and that the northeastern city of Rec-ife portrays profound inequalities within its regional health districts, and consequently presents multiple risk factors for neuropsychomotor development, it would be of great importance to identify the groups most vulnerable to developmental delay. hrough such indings, it might be possible to emphasize the importance of public policies that provide continuous and efective monitoring of infant development, and send any children at risk to referral centers as promptly as possi-ble, thus favoring their future as productive citizens.
OBJECTIVE
he aim of this study was to identify the diferent levels of poverty in a population of low socioeconomic level and to ascertain the inlu-ence of poverty on the neuropsychomotor development of infants at-tended within the Family Health Program.
METHODS
Study design and setting
A cross-sectional study with an analytical component was con-ducted in four Family Health Units located in Microregion 4.2 of Re-gional Health District IV in the city of Recife. he total population of this District is 271,200 inhabitants,18 and the population of
Microre-gion 4.2 is 42,950 inhabitants.Microregion 4.2 was selected because, according to data from the Recife city authorities,19 it is
predominant-ly made up of areas with low-income communities, and it is consid-ered to be particularly precarious in terms of health determinants for both women and infants.
Population and sample
All children aged between 9 and 12 months who were registered at the Family Health Units between February and August 2008 were con-sidered eligible for the study. hose with severe neurological abnormalities (severe sensory disorders, cerebral palsy or mental deiciency) were exclud-ed, leaving a total of 159 children. During data collection, 19 children (12%) either did not attend the evaluation even after being summoned for a second time, or their parents/caretakers refused to participate in the study. he study sample was therefore composed of 136 children.
Socioeconomic status and biological condition of the children
Data were gathered between February and August 2008 by seven research assistants, who were all students from the Physiotherapy and Occupational herapy courses at the Federal University of Pernambu-co. he data gathering method consisted of interviews with either the mothers or the caregivers, at the Family Health Units, using a struc-tured form with closed-end precoded questions.
he socioeconomic status of the family was assessed according to a measuring instrument that contained 13 items: parents’ schooling and occupations, number of people living in the home, paternal cohabita-tion, type of housing and ownership, number of people who slept in the house in relation to the number of beds available, the condition of the running water, sanitation, garbage collection, electricity, separation of the kitchen and ownership of household goods (refrigerator, televi-sion, cooker and radio). Each item received one point, and the sum of the points established the socioeconomic level of the family, with a pos-sible range from 6 to 52 points. he present study used the instrument created by Alvarez et al.,20 which had been adapted to Brazilian realities
by Issler and Giugliani.17 In this, the families are grouped in quartiles
according to the inal index obtained by the instrument. hus, it may be considered that the lowest quartile of this instrument corresponds to the lowest socioeconomic level of the population.
Aditionally to the items of the instrument, other socioeconomic indicators were also gathered, such as: per capita family monthly in-come, possession of a DVD player, conventional and cell telephones, number of children under ive years of age, and the age of the mother or caregiver. In relation to the characteristics of the child, the variables studied were: sex, age, duration of exclusive breastfeeding and any pre-vious occurrence of hospitalization.
Anthropometric assessment
he anthropometric assessment (weight, length and head circum-ference) was conducted by the principal investigator by means of stan-dard equipment and techniques, as established by the World Health Organization (WHO).21 WHO standard references were adopted
(WHO Anthro 2006, version 2.0), in order to assess the nutritional state, in terms of weight-for-age, length-for-age and head circumfer-ence-for-age expressed as mean z-scores.
Assessment of neuropsychomotor development
III Edition22 (Bayley III). his test was developed to identify the risk
of developmental delays among children between the ages of 1 and 42 months, as well as to assist professionals in determining the need for further assessment of a broader nature. he test is subdivided into ive subtests: Cognition, Receptive Communication, Expressive Commu-nication, Fine Motor Skills and Gross Motor Skills. he points system of the subtests produces the scores, thus making it possible for the ex-aminer to determine a cutof point for each subtest administered in diferent age ranges. hese cutof points are used to determine into which category the infant may be placed: “Competent” (shows com-petence in tasks suitable for the age range); “Emerging” (reveals that abilities are still emerging, and is considered to be at risk of develop-mental delay); or “At Risk” (in need of further, more comprehensive evaluation in order to identify the developmental delay).22
Each test lasted approximately 15 to 20 minutes and followed the exact speciications of the application rules contained within the origi-nal manual of the Bayley III Screening Test. All data were registered on the appropriate report forms. Tests were performed at the Family Health Units by a duly trained researcher who was qualiied in the ield of in-fant development. In order to ensure quality control, inter-observer as-sessment was carried out by another author who is also a specialist in child development, and 9% of the tests were scored independently. Rat-er agreement (kappa index) of 0.63 was found for the Fine Motor Skills subtest, and it was greater than 0.90 for the remaining subtests.
Data processing and analysis
he questionnaires were checked regularly for consistency, and data processing and analysis were performed using the Epi Info statis-tical software, version 6.04. Double data entry was used, with veriica-tion for consistency and validity.
Since undernutrition (< -2 z-scores) was only found in two and three children assessed using weight-for-age and length-for-age, re-spectively, the nutritional variables were grouped into two categories: well nourished (> -1 z-score) and at nutritional risk/undernourished (≤ -1 z-score). he Fine Motor and Expressive Communication sub-tests were excluded from the analysis because of the low numbers of children in the “Emerging” and “At risk” categories. his was also the reason for combining the “Emerging” and “At Risk” categories in the Gross Motor assessment.
Diferences between the groups were assessed using the chi-square test with Yates correction and the Fisher exact test when indicated. he statistical signiicance level was taken to be P ≤ 0.05.
Ethical issues
his study was approved by the Research Ethics Committee of the Agamenon Magalhães Hospital, in accordance with Resolution 196/96 of the National Commission for Research Ethics of the Na-tional Health Council. All the mothers/caregivers agreed to partici-pate in the study by means of signing the written informed consent statement.
RESULTS
he sample was composed of 136 infants, of which 57% were male. Two thirds (62%) had been exclusively breastfed for three months or more. he percentages of infants at nutritional risk/un-dernourished through weight-for-age and length-for-age were 7.5% and 22%, respectively, although of these, only two (1.5%) and three (2.2%) were malnourished, respectively.
he family socioeconomic status index ranged from 30 to 51 points, with a median value of 45 points (25th to 75th percentile range
= 40-49). Most of the families were living in reasonable housing conditions and possessed several household goods. However, it was conirmed that the majority of this population was poor, such that around 78% of the sample received an income below the poverty line (≤ 0.5 minimum salary per capita/month) and 20% were in the lowest quartile of the socioeconomic status index.
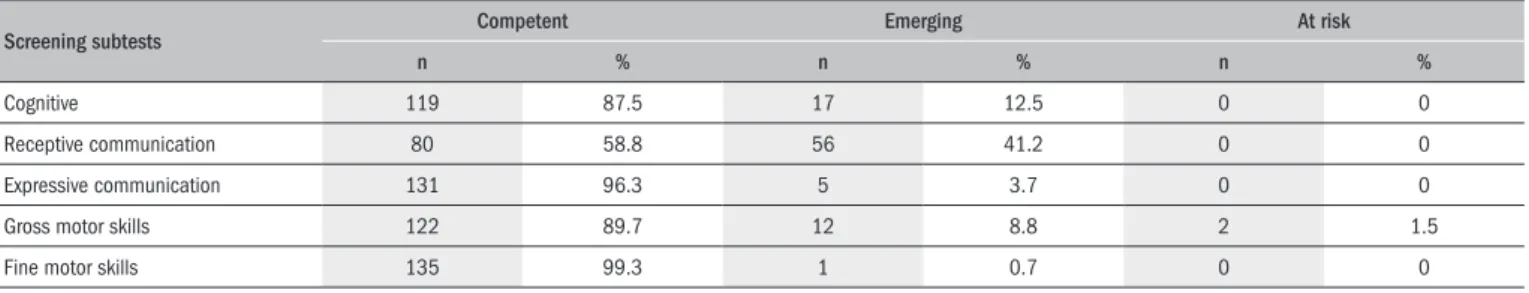
In Table 1, it can be seen that most of the infants were in the “Competent” category, for all the developmental domains studied. However, in relation to receptive communication a high percentage of the infants (41%) was in the “Emerging” category, unlike the other domains, in which this percentage varied between 1 and 12%. Only two infants (1.5%) were placed in the “At Risk” category in the gross motor domain.
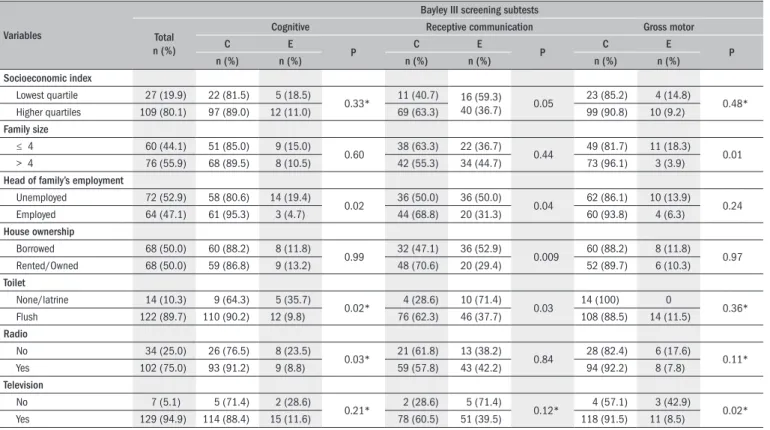
Table 2 shows that the infants within the lowest quartile of the so-cioeconomic status index presented a higher percentage of suspected delay than did those in the other levels, with a statistically signiicant diference only in the receptive communication domain. he same trend was observed for the infants whose families had a lower per capi-ta family income, although this diference was borderline (Table 3).
From analysis on some of the indicators that make up the socioeco-nomic status index (Table 2), it can be seen that the number of people living in the home, the profession of the head of the family, the type of house ownership, type of sanitation and possession of radio and televi-sion had a signiicant inluence over the development of the infants.
Table 1. Bayley III screening subtest scores among infants
Screening subtests Competent Emerging At risk
n % n % n %
Cognitive 119 87.5 17 12.5 0 0
Receptive communication 80 58.8 56 41.2 0 0
Expressive communication 131 96.3 5 3.7 0 0
Gross motor skills 122 89.7 12 8.8 2 1.5
Table 2. Socioeconomic index and some of its indicators that were associated with Bayley III screening subtest scores among infants
Variables
Bayley III screening subtests Total
n (%)
Cognitive Receptive communication Gross motor
C E
P C E P C E P
n (%) n (%) n (%) n (%) n (%) n (%)
Socioeconomic index
Lowest quartile 27 (19.9) 22 (81.5) 5 (18.5)
0.33* 11 (40.7) 16 (59.3)
40 (36.7) 0.05
23 (85.2) 4 (14.8)
0.48* Higher quartiles 109 (80.1) 97 (89.0) 12 (11.0) 69 (63.3) 99 (90.8) 10 (9.2)
Family size
≤ 4 60 (44.1) 51 (85.0) 9 (15.0)
0.60 38 (63.3) 22 (36.7) 0.44 49 (81.7) 11 (18.3) 0.01 > 4 76 (55.9) 68 (89.5) 8 (10.5) 42 (55.3) 34 (44.7) 73 (96.1) 3 (3.9)
Head of family’s employment
Unemployed 72 (52.9) 58 (80.6) 14 (19.4)
0.02 36 (50.0) 36 (50.0) 0.04 62 (86.1) 10 (13.9) 0.24 Employed 64 (47.1) 61 (95.3) 3 (4.7) 44 (68.8) 20 (31.3) 60 (93.8) 4 (6.3)
House ownership
Borrowed 68 (50.0) 60 (88.2) 8 (11.8)
0.99 32 (47.1) 36 (52.9) 0.009 60 (88.2) 8 (11.8) 0.97 Rented/Owned 68 (50.0) 59 (86.8) 9 (13.2) 48 (70.6) 20 (29.4) 52 (89.7) 6 (10.3)
Toilet
None/latrine 14 (10.3) 9 (64.3) 5 (35.7)
0.02* 4 (28.6) 10 (71.4) 0.03 14 (100) 0 0.36* Flush 122 (89.7) 110 (90.2) 12 (9.8) 76 (62.3) 46 (37.7) 108 (88.5) 14 (11.5)
Radio
No 34 (25.0) 26 (76.5) 8 (23.5)
0.03* 21 (61.8) 13 (38.2) 0.84 28 (82.4) 6 (17.6) 0.11* Yes 102 (75.0) 93 (91.2) 9 (8.8) 59 (57.8) 43 (42.2) 94 (92.2) 8 (7.8)
Television
No 7 (5.1) 5 (71.4) 2 (28.6)
0.21* 2 (28.6) 5 (71.4) 0.12* 4 (57.1) 3 (42.9) 0.02* Yes 129 (94.9) 114 (88.4) 15 (11.6) 78 (60.5) 51 (39.5) 118 (91.5) 11 (8.5)
C = Competent; E = Emerging; *Fisher exact test.
Table 3 presents correlations between infant development and other socioeconomic and demographic variables that do not form part of the socioeconomic status index. A tendency towards an association between paternal schooling and the development of receptive com-munication was identiied, but the maternal schooling variable did not show any signiicant impact on the infant developmental domains studied. It can also be seen that maternal and paternal unemployment had negative impacts on the receptive communication and cognitive domains. In families with more than one child under the age of ive, there was a tendency towards lower achievement in receptive com-munication.
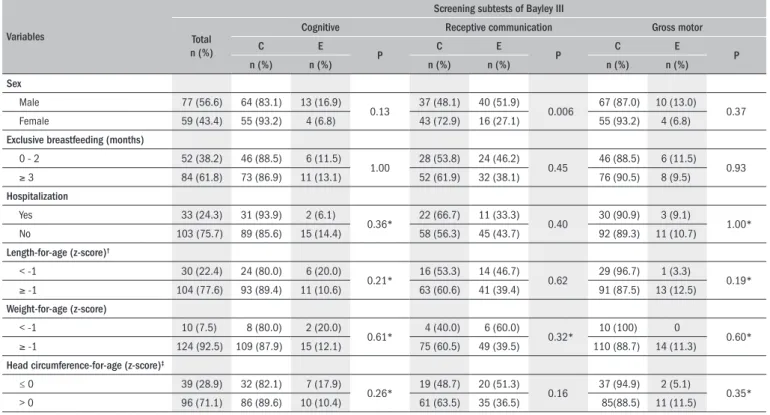
In relation to biological and nutritional characteristics (Table 4), it was seen that there was a signiicantly higher frequency of male in-fants in the “Emerging” category (suspected delay), in the receptive communication domain. Infant development did not show any sig-niicant associations with exclusive breastfeeding, occurrences of pre-vious hospitalization or nutritional indexes.
DISCUSSION
he results from the present study suggest that infants between the ages of 9 and 12 months living under conditions of lower socio-economic status showed a risk of delayed development when assessed using the Bayley III screening test, especially in relation to the devel-opment of receptive communication. Within the context of poverty, the unfavorable socioeconomic conditions expressed through mater-nal and patermater-nal unemployment and the unavailability of household
goods (radio, cell phone and television) had a negative impact on dif-ferent subtests of this scale.
Because of the dynamic, multifactorial nature of poverty and in-fant development, attempting to compare the results from studies that have illustrated an association between these two phenomena proves to be a complex matter. In addition, these studies have also used dif-ferent methods, not only to assess socioeconomic status3,4,9,10 but also
to evaluate infant development.3,10,23,24
In the present study, the instrument for measuring socioeconomic status had the advantage of not including the per capita family income. Although this parameter has been used by several authors,4,10,24,25
accu-rate igures for this are somewhat diicult to obtain, especially in com-munities with low socioeconomic status, thus rendering data from the literature conlicting and hard to interpret.7,9
Moreover, it is important to highlight that a relationship between monthly per capita family income, which was speciically investigated among the participants in this study, and socioeconomic status ana-lyzed using the instrument was observed. his means that the fami-lies in the lowest quartile of this index had in fact lower monthly per capita income, thus conirming the coherence between the index used and the purchasing power of the population, as revealed by the family income (data not shown).
here is substantial evidence in the literature concerning the short3,4 and long-term2,8,10,12 negative impacts of poverty on infant
communi-Table 3. Socioeconomic and demographic conditions associated with Bayley III screening subtest scores among infants
Variables
Bayley III screening subtests Total
n (%)
Cognitive Receptive communication Gross motor
C E
P C E P C E P
n (%) n (%) n (%) n (%) n (%) n (%)
Per capita family income (MS)*
≤ 0.50 91 (78.4) 81 (89.0) 10 (11.0)
1.00† 51 (56.0) 40 (44.0) 0.08 81 (89.0) 10 (11.0) 0.45
> 0.50 25 (21.6) 23 (92.0) 2 (8.0) 19 (76.0) 6 (24.0) 24 (96.0) 1 (4.0)
Maternal age (years)
≤ 19 32 (23.5) 26 (81.3) 6 (18.8)
0.23† 16 (50.0) 16 (50.0) 0.34 29 (90.6) 3 (9.4) 1.00† ≥ 20 104 (76.5) 93 (89.4) 11 (10.6) 64 (61.5) 40 (38.5) 93 (89.4) 11 (10.6)
Maternal schooling (years)
≤ 4 15 (11.0) 13 (86.7) 2 (13.3)
1.00† 7 (46.7) 8 (53.3) 0.46 15 (100) 0 (0.0) 0.36† ≥ 5 121 (89.0) 106 (87.6) 15 (12.4) 73 (60.3) 48 (39.7) 107 (88.4) 14 (11.6)
Paternal schooling (years)‡
≤ 7 36 (37.1) 55 (90.2) 6 (9.8)
0.35† 17(47.2) 19 (52.8) 0.06 32 (88.9) 4 (11.1) 0.46† ≥ 8 61 (62.9) 30 (83.3) 6 (16.7) 42 (68.9) 19 (31.1) 57 (93.4) 4 (6.6)
Maternal employment
Housewife 112 (82.4) 96 (85.7) 16 (14.3)
0.31† 60 (53.6) 52 (46.4) 0.01 99 (88.4) 13 (11.6) 0.46†
Employed 24 (17.6) 23 (95.8) 1 (4.2) 20 (83.3) 4 (16.7) 23 (95.8) 1 (4.2)
Paternal employment§
Unemployed 41 (41.8) 32 (78.0) 9 (22.0)
0.03 21 (51.2) 20 (48.8) 0.13 37 (90.2) 4 (9.8) 0.72†
Employed 57 (58.2) 54 (94.7) 3 (5.3) 39 (68.4) 18 (31.6) 53 (93.0) 4 (7.0)
Children under ive
> 1 97 (71.3) 35 (89.7) 4 (10.3)
0.78† 18 (46.2) 21 (53.8) 0.09 34 (87.2) 5 (12.8) 0.54†
1 39 (28.7) 84 (86.6) 13 (13.4) 62 (63.9) 35 (36.1) 88 (90.7) 9 (9.3)
Cell phone
No 26 (19.1) 19 (73.1) 7 (26.9)
0.02† 11 (42.3) 15 (57.7) 0.09 20 (76.9) 6 (23.1) 0.03†
Yes 110 (80.9) 101 (90.9) 10 (9.1) 69 (62.7) 41 (37.3) 102 (92.7) 8 (7.3)
C = Competent; E = Emerging; MS = Minimum salary (1 MS = R$ 415.00); *missing information in 20 cases; †Fisher exact test; ‡missing information in 39 cases; §missing information in 38 cases.
Table 4. Biological and nutritional characteristics of infants that were associated with Bayley III screening subtest scores among infants
Variables
Screening subtests of Bayley III Total
n (%)
Cognitive Receptive communication Gross motor
C E
P C E P C E P
n (%) n (%) n (%) n (%) n (%) n (%)
Sex
Male 77 (56.6) 64 (83.1) 13 (16.9)
0.13 37 (48.1) 40 (51.9) 0.006 67 (87.0) 10 (13.0) 0.37 Female 59 (43.4) 55 (93.2) 4 (6.8) 43 (72.9) 16 (27.1) 55 (93.2) 4 (6.8)
Exclusive breastfeeding (months)
0 - 2 52 (38.2) 46 (88.5) 6 (11.5)
1.00 28 (53.8) 24 (46.2) 0.45 46 (88.5) 6 (11.5) 0.93
≥ 3 84 (61.8) 73 (86.9) 11 (13.1) 52 (61.9) 32 (38.1) 76 (90.5) 8 (9.5)
Hospitalization
Yes 33 (24.3) 31 (93.9) 2 (6.1)
0.36* 22 (66.7) 11 (33.3) 0.40 30 (90.9) 3 (9.1) 1.00* No 103 (75.7) 89 (85.6) 15 (14.4) 58 (56.3) 45 (43.7) 92 (89.3) 11 (10.7)
Length-for-age (z-score)†
< -1 30 (22.4) 24 (80.0) 6 (20.0)
0.21* 16 (53.3) 14 (46.7) 0.62 29 (96.7) 1 (3.3) 0.19*
≥ -1 104 (77.6) 93 (89.4) 11 (10.6) 63 (60.6) 41 (39.4) 91 (87.5) 13 (12.5)
Weight-for-age (z-score)
< -1 10 (7.5) 8 (80.0) 2 (20.0)
0.61* 4 (40.0) 6 (60.0) 0.32* 10 (100) 0 0.60*
≥ -1 124 (92.5) 109 (87.9) 15 (12.1) 75 (60.5) 49 (39.5) 110 (88.7) 14 (11.3)
Head circumference-for-age (z-score)‡
≤ 0 39 (28.9) 32 (82.1) 7 (17.9)
0.26* 19 (48.7) 20 (51.3) 0.16 37 (94.9) 2 (5.1) 0.35* > 0 96 (71.1) 86 (89.6) 10 (10.4) 61 (63.5) 35 (36.5) 85(88.5) 11 (11.5)
cation. he same tendency was also observed among families with low
per capita incomes. hese results corroborate those of Najman et al.,10
in a cohort study to evaluate the efects of low socioeconomic status on cognitive and emotional development. he group of mothers liv-ing under conditions of poverty durliv-ing pregnancy was twice as likely to have children who, at ive years of age, would present delayed ver-bal comprehension, even after adjustment for other socioeconomic variables.
he mechanism through which the association between poverty and infant development occurs has still not been well established in the literature. With regard to language, several studies have indicated that families with higher socioeconomic status tend to read more to their children,7,9 engage their children in richer discourse and provide
more complex verbal strategies.26 Deprived of these stimuli, children
from families of low socioeconomic status run a greater risk of delayed language development.7,9
he present study found a signiicant association between the type of house occupancy and possession of household goods (radio, cell phone and television) and diferent aspects of infant development. Lack of these material goods relected families’ lower socioeconomic status,4,14 thus having a negative impact on children’s overall
develop-ment. Possession of household goods, as an expression of socioeco-nomic status, has also been cited by other authors.4,15 Similarly, living
in houses with poor sanitation, which had a negative impact on difer-ent domains of infant developmdifer-ent within the presdifer-ent study, is a com-mon characteristic of the most underprivileged housing areas and of the populations with the least community representation.4
Within this context, some authors have conirmed that the relation-ship between socioeconomic status and children’s cognitive and linguis-tic acquisition is permeated by stimulation from within the home and is associated with the degree of agglomeration within the household and the number of siblings living in the home.7,9,16,25 he indings from the
present study showed a tendency towards delayed receptive communi-cation when there was more than one child under the age of ive years in the family. his efect may be related to the fact that parents are less available to provide their children with the due attention, thus reducing the opportunities for stimulation.7,11
Hence, it was observed that infants living in a family environment surrounded by large numbers of people achieved better performances in the gross motor skill domain. he greater adult/child proportion may have led to closer contact with a reference individual, thereby en-abling more appropriate stimulation with positive repercussions on neuropsychomotor development.
he positive role of environmental stimulation in relation to in-fant development has been well documented in the literature. Experi-ments both with animals and with children have demonstrated that secure attachment and an enriched environment for development are protective factors.9,15,27-30 By means of a psychosocial stimulation
pro-gram aimed at mothers, Eickmann et al.15 recorded a signiicant
in-crease in the mental and motor development indexes, as assessed using Bayley II at 18 months, in the group that received the intervention, compared with the control group.
With regard to maternal employment, it was seen that this was associated with higher frequency of suspected delayed receptive com-munication development. Some authors have cited that economic in-stability at home, resulting from unemployment and a reduction in family income, constitutes an important risk factor whereby parents become more punitive and less communicative and responsive to the needs of the child,13,27 thus compromising linguistic stimulation.
Moreover, low income also prevents any access to the means for recreation and learning, which are considered to be materials for cog-nitive stimulation (books, newspapers, magazines and toys).7
here-fore, these factors may also be related to cognitive development, which is in accordance with the results of this study, in which paternal unem-ployment presented a negative impact on the cognitive domain.
Although there is evidence in the literature that good maternal schooling has positive repercussions on infant development,9,25,27 this
characteristic was not found within the study population, probably due to the small sample size. On the other hand, there was an associa-tion between paternal schooling and receptive communicaassocia-tion perfor-mance (borderline statistical signiicance, P = 0.06), which could be related to higher income and to stimulation within the home.
In relation to the biological and nutritional variables studied, it was observed that male infants obtained lower results in the domain of receptive communication than did females, which agrees with the indings of other authors.3,4,28 here is evidence that male children
have lower cognitive performance during infancy,4 and this domain is
considerably related to language. However, the mechanisms through which this association occurs are still not well established.
Although there is evidence that biological and environmental fac-tors inluence infant development in an interactive, cumulative man-ner, the environmental impact has featured heavily in the literature 3,4,7-15,24-31 over the last decade. In a cohort study on 12 month-old infants
in northeastern Brazil, Lima et al.4 found that environmental risk
fac-tors relating to poverty had a greater impact on infant development than did biological risk factors.
With regard to the instrument used in the present study for eval-uating development, as far as we know, this was the irst study to use the Bayley III screening test to evaluate the development of infants of low socioeconomic status. his test is a recently developed instrument, and it can be applied quickly and cheaply. Its validity, accuracy and trustworthiness have been tested on both normal and high-risk chil-dren in the United States.22
However, although the data were gathered as accurately as pos-sible, including the care taken to evaluate the inter-examiner agree-ment, a discrepancy was encountered in the domain of receptive communication in relation to the other domains studied. While the proportion of the infants in the “Emerging” category was 41% for the receptive communication domain, this percentage was lower in the other domains, ranging from 1 to 12%. he literature indicates a higher frequency of false-positive results in screening tests32 than
simi-lar results are available in the literature, in studies that use screening tests for infant development.
It may be that these indings relate to certain recently undertaken adaptations to the instrument in question. Although the Bayley III screening test uses items from the Bayley III evaluation scale, which is considered to be the gold standard in this ield, the evaluation of the scores is carried out in a diferent manner, thereby establishing cutof points and categories. According to Drachler,33 the use of cutof points
in screening scales makes information gathering more diicult with re-gard to the variability of infant development, whereas this does not oc-cur in evaluation scales with continuous indexes.
It is possible to correlate the high levels of suspected delay in re-ceptive communication with the diiculty in accomplishing some of the items that was shown by some infants, thus making the exam-iner’s scoring subjective and leading to a lower score in this develop-mental domain. One example of this is item 7, “Responds to name”, in which, in order to score, the child is required to turn its head on the two occasions when its name is spoken, but not in response to an unfamiliar name. What may be observed here is that the child, out of curiosity, generally turns its head in response to any name called out by the examiner, thus receiving a score of “zero” for this item. Similar observations were made in item 9, “Recognizes two familiar words”. hus, failure to accomplish items such as these may lead to a lower overall score in this developmental domain.
Furthermore, it is important to highlight that the present study also observed items that were easily performed by infants within the age range of this study, in relation to the scales of expressive commu-nication and ine and gross motor skills. his may have led to higher competence scores. hus, greater tolerance was conirmed in the cutof points established by the instrument in these domains of infant devel-opment, thereby rendering it even more diicult for a child to be con-sidered as “Emerging”, since it would have to fail in a high number of items that were easy for that particular age range.
One possible limitation to the present study is the number of fam-ilies who did not attend the evaluation or who refused to participate in the study (12%), even after the second call. Melo et al.34 identiied
from observation of healthcare workers that mothers take their chil-dren for pediatric monitoring at Family Health Units only when they are sufering from some health problem, which may explain the ab-sence of some of the families that was seen during the present study.
Future longitudinal studies should analyze other issues that may inluence infant development, such as the quality of the home envi-ronmental stimulation, maternal mental health, family stress and re-silience traits within the population.
FINAL CONSIDERATIONS
he population studied, which was predominantly poor in terms of per capita family income, exhibited strata of diferent characteris-tics that caused an impact on neuropsychomotor development in a number of diferent manners. he instrument used to evaluate socio-economic status proved to be useful in identifying these strata. hese
indings reinforce the multifactorial nature of infant development and indicate the importance of providing early, continuous monitoring, especially among underprivileged populations.
Considering the discrepancy observed in the results from evaluat-ing neuropsychomotor development performed usevaluat-ing the Bayley III screening test, further studies should be carried out in an attempt to provide a better evaluation of this instrument.
CONCLUSIONS
Infants of more precarious socioeconomic status more frequently present suspected developmental delay. Development monitoring and intervention programs should be encouraged for this subgroup, there-by providing these children with a better chance of becoming produc-tive citizens in the future.
REFERENCES
1. Williams J, Holmes CA. Improving the early detection of children with subtle developmen-tal problems. J Child Health Care. 2004;8(1):34-46.
2. Grantham-McGregor S, Cheung YB, Cueto S, et al. Developmental potential in the irst 5 years for children in developing countries. Lancet. 2007;369(9555):60-70.
3. Andraca I, Pino P, La Parra A, Rivera F, Castillo M. Factores de riesgo para el desarollo psicomotor en lactantes nacidos en óptimas condiciones biológicas [Risk factors for psychomotor development among infants born under optimal biological conditions]. Rev Saúde Pública = J Public Health. 1998;32(2):138-47.
4. Lima MC, Eickmann SH, Lima ACV, et al. Determinants of mental and motor development at 12 months in a low income population: a cohort study in northeast Brazil. Acta Paedia-tr. 2004;93(7):969-75.
5. Walker SP, Wachs TD, Gardner JM, et al. Child development: risk factors for adverse outco-mes in developing countries. Lancet. 2007;369(9556):145-57.
6. Guo G, Harris KM. The mechanisms mediating the effects of poverty on children’s intellec-tual development. Demography. 2000;37(4):431-47.
7. Bradley RH, Corwyn RF. Socioeconomic status and child development. Annu Rev Psychol. 2002;53:371-99.
8. Chilton M, Chyatte M, Breaux J. The negative effects of poverty & food insecurity on child development. Indian J Med Res. 2007;126(4):262-72.
9. Miller JE. Developmental screening scores among preschool-aged children: the roles of poverty and child health. J Urban Health. 1998;75(1):135-52.
10. Najman JM, Aird R, Bor W, et al. The generational transmission of socioeconomic inequa-lities in child cognitive development and emotional health. Soc Sci Med. 2004;58(6): 1147-58.
11. Evans GW. Child development and the physical environment. Annu Rev Psychol. 2006;57:423-51.
12. Evans GW, Kim P. Childhood poverty and health: cumulative risk exposure and stress dysregulation. Psychol Sci. 2007;18(11):953-7.
13. Dearing E. Psychological costs of growing up poor. Ann N Y Acad Sci. 2008;1136: 324-32.
14. Duncan GJ, Brooks-Gunn J, Klebanov PK. Economic deprivation and early childhood deve-lopment. Child Dev. 1994;65(2 Spec No):296-318.
15. Eickmann SH, Lima AC, Guerra MQ, et al. Improved cognitive and motor development in a community-based intervention of psychosocial stimulation in northeast Brazil. Dev Med Child Neurol. 2003;45(8):536-41.
16. Sameroff AJ, Seifer R. Familial risk and child competence. Child Dev. 1983;54(5): 1254-68.
17. Issler RMS, Giugliani ERJ. Identiicação de grupos mais vulneráveis à desnutrição in-fantil pela medição do nível de pobreza [Identiication of the groups most vulne-rable to infant malnutrition through the measuring of poverty level]. J Pediatr (Rio J). 1997;73(2):101-5.
(apro-vado na 7a Conferência Municipal de Saúde). Recife saudável: inclusão social e
qualida-de no SUS. Recife: Conferência Municipal qualida-de Saúqualida-de. Recife; 2005. Available from: www. recife.pe.gov.br/noticias/arquivos/227.pdf. Accessed in 2010 (Aug 11).
20. Alvarez ML, Muzzo S, Ivanovic D. Escala para medición del nível socioeconómico, en el área de la salud [Scale for measurement of socioeconomic level, in the health area]. Rev Med Chile. 1985;113(3):243-9.
21. World Health Organization. Physical status: the use and interpretation of anthropometry. Report of a WHO Expert Committee. Geneva: World Health Organization; 1995. 22. Bayley N. Bayley scales of infant and toddler development. 3th ed. Screening test manual.
Oxford: PsychCorp; 2006.
23. Hess CR, Papas MA, Black MM. Use of the Bayley Infant Neurodevelopmental Screener with an environmental risk group. J Pediatr Psychol. 2004;29(5):321-30.
24. Barros KMFT, Fragoso AGC, Oliveira ALB, Cabral Filho JE, Castro RM. Do environmental inluences alter motor abilities acquisition? A comparison among children from day-care centers and private schools. Arq Neuropsiquiatr. 2003;61(2A):170-5.
25. Halpern R, Giugliani ERJ, Victora CG, Barros FC, Horta BL. Fatores de risco para suspei-ta de atraso no desenvolvimento neuropsicomotor aos 12 meses de vida [Risk factors for suspicion of developmental delay at 12 months old]. Rev Chil Pediatr. 2002;73(5): 529-39.
26. Hoff E. The speciicity of environmental inluence: socioeconomic status affects early vocabulary development via maternal speech. Child Dev. 2003;74(5):1368-78. 27. Garret P, Ng’andu N, Ferron J. Poverty experiences of young children and the quality of
their home environments. Child Dev. 1994;65(2 Spec No):331-45.
28. Andrade SA, Santos DN, Bastos AC, et al. Ambiente familiar e desenvolvimento cognitivo infantil: uma abordagem epidemiológica [Family environment and child’s cognitive deve-lopment: an epidemiological approach]. J Public Health. 2005;39(4):606-11. 29. Santos-Monteiro J, Guedes RCA, Castro RM, Cabral Filho JE. Estimulação psicossocial e
plasticidade cerebral em desnutridos [Psychosocial stimulation and brain plasticity in malnourished individuals]. Rev Bras Saúde Matern Infant. 2002;2(1):15-22. 30. Walker SP, Chang SM, Powell CA, Grantham-McGregor SM. Effects of early childhood
psycho-social stimulation and nutritional supplementation on cognition and education in growth-stunted Jamaican children: prospective cohort study. Lancet. 2005;366(9499):1804-7. 31. Grantham-McGregor SM, Lira PI, Ashworth A, Morris SS, Assunção AM. The development
of low birth weight term infants and the effects of the environment in northeast Brazil. J Pediatr. 1998;132(4):661-6.
32. Developmental surveillance and screening of infants and young children. Pediatrics. 2001;108(1):192-6.
33. Drachler ML. Medindo o desenvolvimento infantil em estudos epidemiológicos: diiculda-des subjacentes. J Pediatr (Rio J). 2000;76(6):401-3.
34. Mello DF, Lima RAG, Scochi CGS. Health follow-up of children in poverty situation: betwe-en the routine and evbetwe-entuality of daily care. Rev Latinoam Enferm. 2007;15(spe):820-7.
Acknowledgement: Our thanks to the Conselho Nacional de Desenvolvimento Cientíico e Tecnológico (CNPq – grant no. 307977/2009-9) for providing a research grant to Marilia Lima.
Conlict of interest: None
Sources of funding: None
Fist submission: February 2, 2010
Last received: August 24, 2010
Accepted: September 1, 2010
Address for correspondence:
Giselle Souza Paiva
Rua Deputado Cunha Rabelo, 110/404 Cidade Universitária — Recife (PE) — Brasil CEP 50740-400