INTRODUCTION
The prevalences of obesity and inflammatory bowel diseases (IBD) had a significant increase over the same period worldwide. The World Health Organization (WHO) estimates that approxi-mately 35% of the global population presents overweight and/or obesity (defined as BMI >25 kg/m2)(1). A systematic review, which enrolled 260 population-based studies, observed an estimated an-nual incidence of IBD that ranged from 10–30 cases per 100,000 people in the Western world. Moreover, approximately 0.5% of adults in the West suffer from IBD(2).
Contrary to what one should expect, 15%–40% of the individu-als with IBD individu-also present with obesity, and it is uncertain whether it might contribute to the development and evolution of IBD(3). Many IBD cohorts and adult populations showed that the prevalence of overweight/obese IBD patients is similar to the general popula-tion (20%-30%)(4-6). There are plenty of explanations regarding a possible link between IBD and obesity increased rates, such as gut microbiome alterations, changes in food intake behavior, increased consumption of industrialized food, animal fat/protein (western diet) and decreased dietary fiber intake, as well a reduction in physical exercice and increase in sedentarism.
Visceral fat is increased in individuals with
Crohn’s disease: a comparative analysis with
healthy controls
Daniéla Oliveira
MAGRO
1, Maria Rita Lazzarini
BARRETO
1, Everton
CAZZO
1, Michel Gardere
CAMARGO
1,
Paulo Gustavo
KOTZE
2and Claudio Saddy Rodrigues
COY
1Received 15/9/2017 Accepted 28/12/2017
ABSTRACT – Background – It is known that obesity is associated with a chronic inflammatory state, but few studies have evaluated visceral fat (VF)
content and its role in individuals with Crohn’s disease (CD). Objetive – To compare the nutritional status, body composition and proportion of VF between CD individuals and healthy volunteers. Methods – Cross-sectional study that enrolled individuals with Crohn’s disease and healthy controls. The stratification according to nutritional status was carried out by means of BMI. The percentage of body fat percentage (%BF) and VF were
estimated by means of DEXA. VF proportion was evaluated by means of the VF/BMI and VF/%BF ratios. Results – A total of 78 individuals were
included. The control group was comprised of 28 healthy subjects aged 35.39±10 years old (60.7% women); mean BMI=23.94±3.34 kg/m2; mean
VF=511.82±448.68 g; mean CRP=0.81±1.78 ng/mL. The CD group was comprised of 50 patients; 11 (22%) were underweight (BMI=18.20±1.97 kg/ m2;
%BF=24.46±10.01; VF=217.18±218.95 g; CRP=4.12±4.84 ng/mL); 18 (36%) presented normal weight (BMI=22.43±1.48 kg/m2; %BF=30.92±6.63;
VF=542.00±425.47 g and CRP=4.40±1.78 ng/mL); 21 (42%) were overweight or obese (BMI=29.48±3.78 kg/m2; %BF=39.91±7.33; VF=1525.23±672.7 g
and CRP=1.33±2.06 ng/mL). The VF/BMI ratio was higher in the CD group when compared to controls (32.41±24.63 vs 20.01±16.23 g per BMI point; P=0.02). Likewise, the VF/%BF was also higher in the CD group (35.21±23.33 vs 15.60±12.55 g per percentage point; P<0.001). Conclusion – Among individuals with Crohn’s disease, BMI presents a direct correlation with visceral fat content. These results indicate the presence of an adiposopathy in Crohn’s disease subjects, which is evidenced by a higher visceral fat.
HEADINGS – Crohn’s disease. Intra-abdominal fat. Body composition. Body mass index.
Declared conflict of interest of all authors: Kotze PG is a speaker and consultant for Abbvie, Ferring, Janssen and Takeda. The other authors of this study declare no competing interests. Disclosure of funding: no funding received
1 Universidade Estadual de Campinas, Faculdade de Ciências Médicas, Departamento de Cirurgia, Campinas, SP, Brasil. 2 Pontifícia Universidade Católica do Paraná, Hospital Universitário
Cajuru, Unidade de Cirurgia Colorretal, Curitiba, PR, Brasil.
Corresponding author: Daniéla Oliveira Magro. E-mail: [email protected]
A study in Crohn’s disease (CD) conducted between 1991 and 2008 observed a significant increase in the BMI of the af-fected individuals, from 20.8 kg/m2 in 1992 to 27.0 Kg/m2 in 2001, probably after the era of biological therapy(6). Antitumor necrosis factor (anti-TNF) agents are effective drugs for inducing and maintaining remission in IBD and its use may be associated with weight gain(7).
The interplay between obesity and IBD is complex and poorly understood. Several factors have been enrolled in the potentially common pathophysiological pathways which might link both condi-tions. The disproportional accumulation of visceral fat (VF) and impaired release of adipokines, such as adiponectin, disturbances in the gut microbiome, increased levels of lipopolysaccharides(8) and chronic inflammation have been enrolled as possible intercon-necting links(9). VF may play an important role in the initiation and chronic intensification of the inflammatory process in CD. Research on this topic may help to provide further insights in regards to this complex relationship.
METHODS
Study design and patient population
This was a cross-sectional single-center study, performed in individuals with previously diagnosed CD and healthy controls.
Between March and December 2015, at the IBD outpatient cli-nics of Campinas State University (Unicamp, Campinas Brazil), 78 consecutive individuals were studied. From those, 50 were patients with an established diagnosis of CD and 28 were healthy controls. The diagnosis of CD was confirmed by means of clinical, endo-scopic, and histological standard criteria. During routine visits to our clinics, patients who agreed in participating in the study signed up an informed consent form. The control group was recruited among healthy volunteers who worked or studied at the University.
Definitions and measurements
Disease activity in CD patients was assessed by the Crohn’s disease activity index (CDAI)(10). A score under 150 was considered as inactive disease (clinical remission), while a CDAI score above 150 was considered as active disease.
Patients had their anthropometric and body composition measurements collected during routine consultations in the IBD outpatient clinics. Height was determined using a stadiometer with a length of 220 cm and subdivided into 0.1 cm segments. Weight was measured on an electronic digital scale, with a maximum capacity of 150 kg and a sensitivity of 50 grams, with the subject wearing light clothing and no shoes. Body mass index (BMI) was calculated as weight (in kilograms) divided by the square of height (in meters) (Kg/m2). Nutritional status was subdivided in under-weight (BMI <18.5Kg/m2), normal weight (BMI 18.5-24.9Kg/m2) and overweight/obesity (BMI >25.0 Kg/m2)(1). The measurement of the waist circumference was performed from the midpoint between the top of the iliac crest and the lower margin of the last palpable rib in the mid axillary line. Cut-off points relative to normal waist circumference used were <102cm for men and <88cm for women(11). Body composition was assessed using whole body Dual Energy
X-Ray Absorptiometry (DEXA; DPX Bravo e Duo GE®, USA). The subjects were placed in a supine position with their arms at the side of their body. Encore software was used to estimate fat and lean masses (% and Kg) and VF (Kg). To estimate the VF proportion, we calculated the ratio of VF per BMI (VF/BMI, expressed in grams of fat per BMI) and the ratio of VF per percentage body fat (%BF) (VF/%BF, expressed in grams of fat per percentage point of BF).
C-reactive protein (CRP) levels were also determined in all subjects, using ELISA Kit (R&D Systems Inc., Minneapolis, MN).
Statistical analysis
Statistical analyses were used according to SSPS v.16.0 soft-ware (IBM Inc., Armonk, NY, USA).The results were expressed as means ± standard deviation (mean ± SD) for continuous vari-ables and as frequency for categorical varivari-ables. To compare the results obtained in two groups, Mann-Whitney test was used. For comparisons between three groups, ANOVA analysis was used for parametric variables and the Kruskal-Wallis test was used for non-parametric variables. To correlate BMI and VF with other variables, the Spearman correlation tests were used. The Spearman tests generate coefficients that vary from -1 to 1, and values next to the edges signal negative or positive correlations, respectively. Statistical significance was assumed if P<0.05 in all statistical tests.
Ethical aspects
The protocol was approved by the Institutional Ethics Review Board at Campinas State University (Unicamp), in Campinas, Brazil, under reference number 850.517/2014.
RESULTS
Baseline characteristics
A total of 78 individuals composed our study sample (50 in the CD group and 28 as healthy controls). The baseline characteristics of the CD patients, based on the nutrition status, are detailed in
TABLE 1, according to the Montreal classification(12). All patients
TABLE 1. Baseline characteristics and nutritional status of patients with Crohn’s disease.
Variable n (%) Underweight n=11 (22%) Normal weight n=18 (36%) Overweight/obesity n=21 (42%) P value
Gender (M/F) 7/4 10/8 10/11 0.81
CDAI (<150) % 54.5 88.9 88.7 <0.001**
Duration of disease (years)* 8.64±6.53 14.28±7.36 12.00±7.71 0.55
Age at diagnosis, n (%)
A1 5 (45.45) 3 (27.27) 3 (14.28) <0.001**
A2 5 (45.45) 14 (77.77) 11 (52.38) 0.15
A3 1 (9.09) 1 (5.55) 7 (33.33) <0.001**
Location of the disease, n (%)
L1 4 (36.36) 9 (50.00) 8 (38.09) 0.25
L2 6 (54.54) 8 (44.44) 13 (61.90) 0.57
L3 1 (9.09) 1 (5.55) - <0.001**
Disease phenotype, n(%)
B1 2 (18.18) 8 (44.44) 11 (52.38) 0.024*
B2 8 (72.70) 4 (22.22) 6 (28.57) <0.001**
B3 1 (9.09) 6 (33.33) 4 (19.04) <0.001**
Perianal disease, n (%) –P 4 (36.36) 7 (38.88) 11 (52.38) 0.39
with CD had their disease characteristics assessed. All subjects included in the study were non-smokers. CD patients were sublo-cated in diffrerent subgroups according to their nutritional status, based on the BMI.
Underweight CD subgroup
The underweight subgroup consisted of 7 men and 4 women, with a mean age of 30.4±14.3 years and a mean BMI of 18.20±1.97 Kg/m2. Age at diagnosis ≤16 years (A1) and between 17 and 40 years (A2) were more prevalent, and 54.4% had colonic CD (L2); most patients had stricturing phenotype (B2) and perianal disease was present in 36.6%. From those, 7 of 11 patients had been treated with anti tumor necrosis factor alpha (TNF-α) antibody therapy (5 with infliximab, in use for 2.80±2.49 years; 2 with adalimumab, in use by 1.5±0.70 years) or an immunomodulator (6 of 11 patients, in use by 1.83±2.04 years).
Normal weight CD subgroup
The normal weight subgroup consisted of 10 men and 8 women, with a mean age of 39.5±11.26 years and a mean BMI of 22.43±1.48 Kg/m2. Age at diagnosis between 17 and 40 years (A2) was more prevalent and 50.0% had a ileal CD (L1); 44.4% had in-flammatory or luminal CD phenotype (B1) and perianal disease was present in 38.8%. In this group, 11 of 18 patients had been treated with anti TNF-α antibody therapy (9 with infliximab, in use by 3.44±2.87 years; 2 with adalimumab, in use by 3.5±2.12 years) or an immunomodulator (10 of 18 patients, in use by 4.45±3.07 years).
Overweight/obesity CD subgroup
The overweight/obesity group consisted of 10 men and 11 women, with a mean age of 47.9±10.58 years and a mean BMI of 29.48±3.70 Kg/m2. Age at diagnosis between 17 and 40 years (A2)
was also more prevalent and 61.9% had colonic CD (L2); 52.3% presented luminal CD (B1) and perianal disease was present in 52.3%. In this group, 14 of 21 patients had been treated with anti TNF-α antibody therapy (11 with infliximab, in use by 3.64±3.55 years; 3 with adalimumab, in use by 3.33±3.21 years) or an immu-nomodulator (9 of 21 patients, in use by 5.11±3.06 years).
Overall, in the CD group, 64% were using anti TNF-α antibody therapy. There was no difference between the use of anti TNF-α between the 3 different BMI subgroups (P=0.093).
Control group
The control group was comprised of 11 men and 17 women, aged 33.18±8.62 years, with a mean BMI of 23.9±3.3 kg/m2 [un-derweight, n=2 (7.1%); normal weight, n=16 (57.14%); overweight/ obesity, n=10 (35.7%)] and no comorbidities.
Body compositon
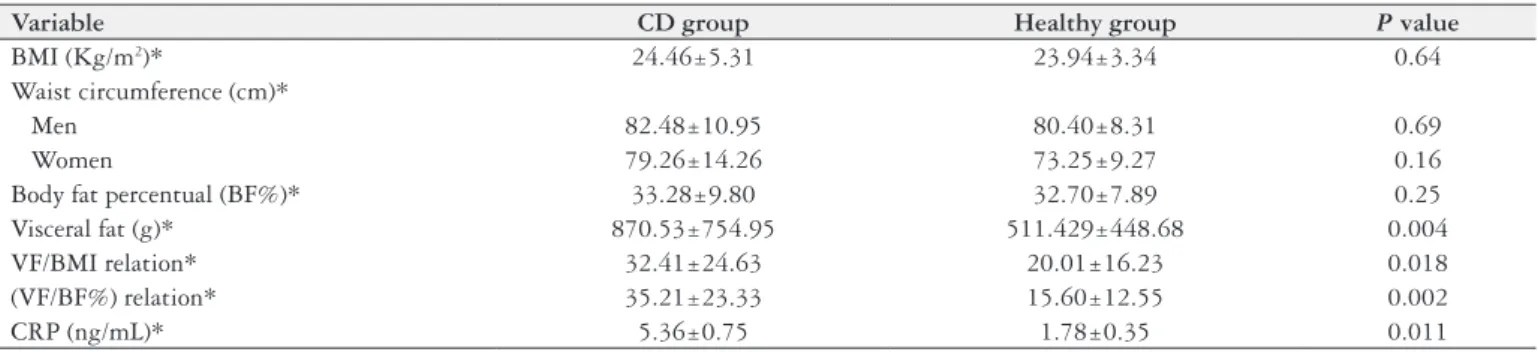
The body composition and proportion of VF among different subgroups are described in detail in TABLE 2. There was no dif-ference between the subgroups in regards to BMI (P=0.65). There
was also no difference between subgroups in waist circumference and gender (P=0.69 for men; P=0.16 for women). There was no
difference in body fat percentage between the subgroups. However, VF content was higher in the CD main group overall (P=0.004) as
well as all visceral fat percentiles (FIGURE 1). As significant results, VF/BMI and VF/BF% relations were also greater in the CD main group (P=0.018; P=0.002, respectively) as compared to controls.
The VF/BMI relation, in the CD main group, was 12.4±5.20 grams higher by BMI point as compared to healthy controls. Likewise, the VF/BF% relation, in the CD group, was 19.61±4.76 grams higher by body fat percentual point as compared to controls. Moreover, CRP was also higher in the CD group (P=0.011), as expected.
TABLE 2. Body Composition, proportion visceral fat and CRP among groups.
Variable CD group Healthy group P value
BMI (Kg/m2)* 24.46±5.31 23.94±3.34 0.64
Waist circumference (cm)*
Men 82.48±10.95 80.40±8.31 0.69
Women 79.26±14.26 73.25±9.27 0.16
Body fat percentual (BF%)* 33.28±9.80 32.70±7.89 0.25
Visceral fat (g)* 870.53±754.95 511.429±448.68 0.004
VF/BMI relation* 32.41±24.63 20.01±16.23 0.018
(VF/BF%) relation* 35.21±23.33 15.60±12.55 0.002
CRP (ng/mL)* 5.36±0.75 1.78±0.35 0.011
* Values are expressed as means ± SD; CD: Crohn’s disease; CRP: C-reactive protein. P<0.05.
In regards to BMI and CRP in CD main group (FIGURE 2), there was a significant correlation (P=0.049),but the correlation
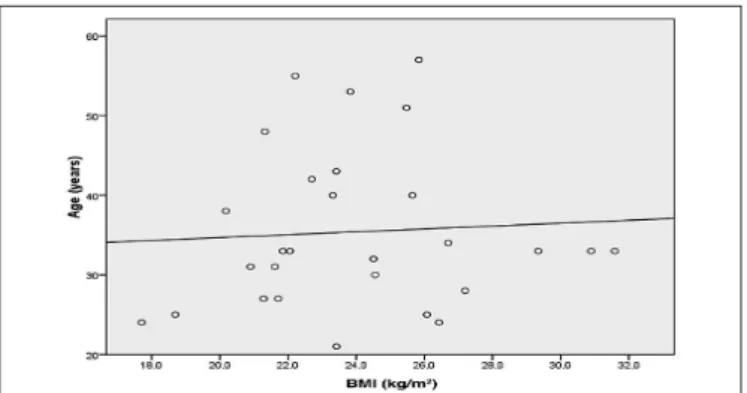
coefficient was not expressive (CC=-0.280). Moreover, BMI had significant correlations with waist circumference, VF, body fat percentage and age in the CD group (all comparisons with
P<0.001) (FIGURES 3, 4, 5 and 6). In the control group, BMI
had no significant correlation with CRP (P=0.058) (FIGURE 7),
as body fat percentage and age (P=0.073; P=0.51, respectively)
(FIGURES 8 and 9). BMI had significant correlations with waist circumference and visceral fat (P<0.001; P<0.001, respectively)
(FIGURES 10 and 11). Sedentarism was identified in 72.0% of the CD patients as compared to 53.6% in healthy group (P=0.003).
FIGURE 2. Spearman correlation between BMI and CRP in CD group.
CC=-0.280; P=0.049.
FIGURE 5. Spearman correlation between BMI and body fat percentage
in CD group. CC=0.617; P<0.001.
FIGURE 6. Spearman correlation between BMI and age in CD group.
CC=0.58; P≤0.001.
FIGURE 7. Spearman correlation between BMI and CRP in Control
Group. CC=-0.377; P=0.058.
FIGURE 8. Spearman correlation between BMI and body fat percentage
in Control Group. CC=0.344; P=0.073.
FIGURE 3. Spearman correlation between BMI and waist circumference
in CD group. CC=0.848; P<0.001.
FIGURE 4. Spearman correlation between BMI and visceral fat in CD
of the low number of obese patients in our sample (n=8). There was no correlation between obesity and disease duration or anti TNF-α antibody therapy use. Obesity was associated only with age, demonstrating that the older the individual is, the higher is the probability of presenting obesity.
In the present study, CD patients from the underweight sub-group had stricturing CD as the most prevalent phenotype and 44.5% had active disease. In a prospective cohort study (EPIC cohort) of European adults, BMI was not associated with a specific phenotype of disease behaviour or disease location(13) as in the our study. This could be explained by the chronic status of CD in patients with stenosis as compared to luminal disease, what could explain the low BMI in this specific phenotype of patients. Diet and environmental factors could also explain the differences between patients from our study as compared to Europeans.
In healthy controls, the body fat percentage was not correlated with the BMI because the fat distribution tended to be more ho-mogeneous in this group. This characteristic is also pointed as a flaw of the use of BMI to assess nutritional status in the general population, since it did not identify the differences in visceral and non-visceral fat. Thus, in clinical chronic conditions such as CD, differences in VF could be more clear than a simple weight meas-urement to state the association between obesity and CD.
Regarding the main results of our study, VF was higher in CD patients, as compared to controls. This finding may be associated with the maintenance of the inflammatory process in CD, since it is known that the increase in VF may be associated with an overexpression of pro-inflammatory adipokines, mainly TNF-α and interleukin-6 (IL-6) and (IL-1β)(14). It is known that TNF-α expression is higher in VF tissue as compared to subcutaneous fat(15). The IL-6 release by omental adipose tissue is increased as compared to subcutaneous fat, and this could explain the basal inflammatory status in obese patients(16). VF is more sensitive to lipolysis stimulation(14). Thus, it plays an important role in the inflammatory process in CD.
In our study, VF was higher in CD patients in all subgroups. This was also observed in VF/BMI and VF/BF% relationships. These findings signal the possibility that the BMI presents a more meaningful interpretation among individuals with CD, since it may be a reliable predictor of the presence of both obesity and increased VF content. This assumes a critical importance, as BMI is calculated through simple and promptly available anthropometric variables and indicates that it may be used in large-scale assessment of VF within this specific group of individuals.
Our study had some limitations that must be carefully inter-preted during the results’ analysis. The main consideration is its cross-sectional design, which avoids the complete determination of cause-effect relationships. Nonetheless, the significant associations observed present clinical and even population implications for wider application during daily practice in the IBD management, and even for planning public health interventions.
CONCLUSION
In summary, our study demonstrated that fat distribution in the CD patients was disproportional when compared to healthy controls. In CD patients, the BMI presents a direct correlation with the VF content. These results indicate the possible presence of an adiposopathy in CD subjects, which is evidenced by a higher VF tissue volume.
FIGURE 9. Spearman correlation between BMI and age in Control Group.
CC=0.128; P=0.51.
FIGURE 10. Spearman correlation between BMI and waist circumference
in Control Group. CC=0.860; P<0.001.
FIGURE 11. Spearman correlation between BMI and visceral fat in
Control Group. CC=0.740; P<0.001.
DISCUSSION
The relation of obesity and CD can be linked to fat tissue. Initiation of the inflammatory proccess in CD is usually triggered in the mesenteric fat, and other possible explanations for the in-crease in the rates of obesity and CD in parallel are still poorly understood. Several nutritional measurements could be used to study the possible relations between these two conditions, and few studies aimed to evaluate this relation. VF is a measurement that was rarely studied in this field. The results of our study indicate that VF can be higher in CD patients as compared to healthy controls, regardless of the nutritional status.
Authors’ contribution
Magro DO, Barreto MRL, Cazzo E, Camargo MG, Kotze PG, Coy CSR. Magro DO, Barreto MRL and Coy CSR designed the study. Magro DO, Barreto MRL, Camargo MG, did data
col-lection. Magro DO, Cazzo E, Coy CSR analyzed the data. DOM performed the statistical analysis. Magro DO, Coy CSR, Cazzo E and Kotze PG drafted the article.
REFERENCES
1. Mendis S, Norrving B. Organizational Update. Stroke. 2014;45:e22.
2. Singh S, Dulai PS, Zarrinpar A, Ramamoorthy S, Sandborn WJ. Obesity in IBD: epidemiology, pathogenesis, disease course and treatment outcomes. Nat Rev Gastroenterol Hepatol. 2017;14:110–21.
3. Molodecky NA, Soon IS, Rabi DM, Ghali WA, Ferris M, Chernoff G, et al. Increasing Incidence and Prevalence of the Inflammatory Bowel Diseases With Time, Based on Systematic Review. Gastroenterology. 2012;142:46–54.e42. 4. Long MD, Crandall WV, Leibowitz IH, Duffy L, del Rosario F, Kim SC, et al.
The Prevalence and Epidemiology of Overweight and Obesity in Children with Inflammatory Bowel Disease. Inflamm Bowel Dis. 2011;17:2162–8.
5. Kotze PG. Obesity and Crohn’s disease: what comes first, the egg or the chicken? Arq Gastroenterol. 2017;54:268.
6. Moran G, Dubeau M, Kaplan G, Panaccione R, Ghosh S. The increasing weight of Crohn’s disease subjects in clinical trials: a hypothesis-generatings time-trend analysis. Inflamm Bowel Dis. 2013;19:2949–56.
7. Yadav A, Foromera J, Feuerstein I, Falchuk KR, Feuerstein JD. Variations in Health Insurance Policies Regarding Biologic Therapy Use in Inflammatory Bowel Disease. Inflamm Bowel Dis. 2017;23:853-7.
8. Magro DO, Kotze PG, Martinez CAR, Camargo MG, Guadagnini D, Calixto AR, et al. Changes in serum levels of lipopolysaccharides and CD26 in patients with Crohn’s disease. Intest Res. 2017;15:352-7.
9. Nic Suibhne T, Raftery TC, McMahon O, Walsh C, O’Morain C, O’Sullivan M. High prevalence of overweight and obesity in adults with Crohn’s disease: Associations with disease and lifestyle factors. J Crohns Colitis. 2013;7:e241–8. 10. Best W, Becktel J, Singleton J, Kern FJ. Development of a Crohn’s disease activity index. National Cooperative Crohn’s Disease Study. Gastroenterology. 1976;70:439–44.
11. Stevens J, Katz EG, Huxley RR. Associations between gender, age and waist circumference. Eur J Clin Nutr. 2009;64:6–15.
12. Satsangi J, Silverberg MS, Vermeire S, Colombel J. The Montreal classification of inflammatory bowel disease: controversies, consensus, and implications. Gut. 2006;55:749–53.
13. Chan SSM, Luben R, Olsen A, Tjonneland A, Kaaks R, Teucher B, et al. Body Mass Index and the Risk for Crohn’s Disease and Ulcerative Colitis: Data From a European Prospective Cohort Study (The IBD in EPIC Study). Am J Gastro-enterol. 2013;108:575–82.
14. Bertin B, Desreumaux P, Duburquoy L. Obesity, visceral fat and Crohn’s disease. Curr Opin Clin Nutr Metab Care. 2010;13:574–80.
15. Maury E, Brichard SM. Adipokine dysregulation, adipose tissue inflammation and metabolic syndrome. Mol Cell Endocrinol. 2010;314:1–16.
16. Fried S, Bunkin D, Greenberg A. Omental and subcutaneous adipose tissues of obese subjects release interleukin-6: depot difference and regulation by gluco-corticoid. J Clin Endocrinol Metab. 1998;83:847–50.
Magro DO, Barreto MRL, Cazzo E, Camargo MG, Kotze PG, Coy CSR. Portadores de doença de Crohn apresentam maior acúmulo de gordura visceral: análise comparativa com controles saudáveis. Arq Gastroenterol. 2018;55(2):142-7.
RESUMO – Contexto – Sabe-se que a obesidade associa-se a um estado de inflamação crônica, mas faltam estudos que avaliem o conteúdo de gordura
visceral em indivíduos com doença de Crohn. Objetivo – Comparar o estado nutricional, a composição corporal e a proporção de gordura visceral
entre indivíduos com doença de Crohn (DC) e controles saudáveis (CS). Métodos – Estudo transversal com doença de Crohn e controles saudáveis.
O estado nutricional foi estratificado de acordo com o índice de massa corpórea (IMC). O percentual de gordura corporal (%GC) e a mensuração da
gordura visceral foram avaliados por DEXA. A proporção de gordura visceral (GV) foi avaliada pelas relações entre GV/IMC e GV/%GC.
Resulta-dos – Foram incluídos 78 indivíduos no estudo. O grupo CS foi constituído por 28 indivíduos saudáveis, com idade média de 35,39±10 anos; 60,7%
mulheres; IMC=23,94±3,34 kg/m2; %GC=32,7±7,89; GV=511,82±448,68 g e PCR=0,81±1,78 ng/mL. O grupo DC foi composto por 50 indivíduos,
destes, 11 (22%) desnutridos (IMC=18,20±1,97 kg/m2; %GC 24,46±10,01; GV=217,18±218,95 g; PCR=4,12±4,84 ng/mL); 18 (36%) eutróficos
(IMC=22,43±1,48 kg/m2; %GC=30,92±6,63; GV=542,00±425,47 g e PCR=4,40±1,78 ng/mL); 21 (42%); sobrepeso/obesidade (IMC=29,48±3,78
kg/m2; %GC=39,91±7,33; GV=1525,23±672,76 g e PCR=1,33±2,06 ng/mL). A relação GV/IMC foi maior no grupo DC quando comparado aos
do grupo CS (32,41±24,63 vs 20,01±16,23 gramas por ponto do IMC; P=0,02), assim como a relação GV/%GC que também foi maior no grupo
DC (23,33±33,33 vs 12,55±2,37 gramas por ponto percentual; P<0,001). Conclusão – Entre os indivíduos com doença de Crohn, o IMC apresentou correlação direta com o conteúdo de gordura visceral. Esses resultados sinalizam a ocorrência de adiposopatia nos pacientes com doença de Crohn, com maior volume de tecido adiposo visceral.