Antonio Luiz Rodrigues-JúniorI Vinícius Tragante do ÓII Vivian Genaro MottiII
I Departamento de Medicina Social. Faculdade de Medicina de Ribeirão Preto (FMRP). Universidade de São Paulo (USP). Ribeirão Preto, SP, Brasil
II Informática Biomédica. FMRP-USP. Ribeirão Preto, SP, Brasil
Correspondence:
Antonio Luiz Rodrigues Júnior Departamento de Medicina Social Av. Bandeirantes, 3900
14049-900 Ribeirão Preto, SP, Brasil E-mail: [email protected]
Received: 7/13/2007 Revised: 4/10/2008 Accepted: 6/4/2008
Spatial and temporal study of
leprosy in the state of São Paulo
(Southeastern Brazil), 2004-2006
ABSTRACT
OBJECTIVE: To assess the temporal and spatial evolution of the leprosy
endemy in the state of São Paulo, Southeastern Brazil.
METHODS: This is an ecological-social study that used the number of
leprosy cases reported to the Brazilian Ministry of Health from January 2004 to December 2006. Monthly series were generated in each regional health department, and their sequences were adjusted by a Markovian model for the leprosy detection coeffi cients. The detection coeffi cient with the number of cases accumulated in the period in each municipality was used to produce the spatial distribution of the endemy; a correlation analysis was carried out with the leprosy detection coeffi cients and the components of the Social Responsibility Index of the state of São Paulo.
RESULTS: Of the 645 municipalities of the state of São Paulo, 22 did not
detect leprosy cases in the period. In the majority of regions, the endemy showed a decreasing trend; the time series presented random fl uctuation around expected values. The decline was infl uenced by a generalized decrease in the detection coeffi cients at the end of 2005. There was a positive correlation between the detection coeffi cients and the components “schooling” and “longevity”, of the Social Responsibility Index of the state of São Paulo, and a negative correlation with “wealth”, another component of the same Index.
CONCLUSIONS: The result of the time series analysis suggests that the
endemy is on the decline in the majority of regions of the state of São Paulo, while the spatial analysis shows that the coeffi cients are high in the northern part of the state.
DESCRIPTORS: Leprosy, epidemiology. Indicators. Temporal Distribution. Time Series Studies. Ecological Studies. Epidemiology, Descriptive.
INTRODUCTION
Leprosy presents high infectiveness and low pathogenicity, and the domicile is the main transmission space.3 Nowadays, the causality network of the dis-ease includes the molecular biology of the etiological agent, the genetic or immunologic characteristics of the host – which are not fully known yet -, and the social determinants, such as quality of life, sanitation, cultural practices, poverty, among others.9
in 1998 and 4.52 in 2003, suggesting the decline of the endemy.a In the state of São Paulo, the detection of cases increased due to education campaigns, personnel training, expansion of coverage and decentralization of services and actions.14 In 1991, the World Health Organization (WHO) proposed the elimination of or reduction in the incidence of leprosy to less than one case per 10,000 inhabitants in endemic countries, up to the year 2000. This goal has not been achieved by Brazil9,10,12 and the Ministry of Health has designed a strategy to eliminate leprosy until 2010, in the mu-nicipal level, in which the actions are fi nanced by the resources of Sistema Único de Saúde (SUS – National Health System). Health services organization is one of the factors that determine leprosy, as it promotes detec-tion, either passive or active, and treatment.7,9
Some spatial studies have related the occurrence of leprosy to the tropical zones, where the climatic condi-tions favor transmission11 and the wild animals serve as reservoirs for the etiological agent.b This strengthens the idea of natural foci of the disease and possible anthro-pozoonotic transmission networks. Studies on epide-miological landscapes have approached the interactions between natural and social phenomena, discriminating regions which have been essentially created by biotic, evolutionary, and cultural processes, and also by the natural reservoirs – known as nidality.9 Ecological epi-demiological studies with ecological-social dimensions admit the use of compound human development indica-tors to characterize these landscapes from the cultural and socioeconomic point of view. The Índice Paulista de Responsabilidade Social (IPRS - Social Responsi-bility Index of the state of São Paulo) is an indicator that refl ects human development in the municipalities of the state of São Paulo, including, beside the Human Development Index (HDI), municipal administrative information updated in years between two demographic censuses.16 Statistical methods contribute to the evalu-ation of these epidemiological landscapes: stochastic models of time series analysis13,15 are used to estimate trend and seasonality parameters, and geostatistical mod-els5,8,14 generate risk zonings or identify groupings.
The aim of the present study was to assess the temporal evolution of leprosy detection in the state of São Paulo, between 2004 and 2006.
METHODS
An ecological and descriptive study was conducted, us-ing information regardus-ing the detection of leprosy cases and human development of the 645 municipalities of
a Ministério da Saúde. Secretaria de Vigilância em Saúde. Departamento de Análise de Situação de Saúde. 2004: hanseníase. Brasília; 2004. p. 311-2.
b Fundação Nacional de Saúde. Guia de vigilância epidemiológica. Brasília; 2002. v. 2.
c São Paulo (State). Decree no. 51.433, published on December 28, 2006. It creates a unit in Coordenadoria de Regiões de Saúde (Healthcare Regions Coordination) of Secretaria da Saúde (Health Department). Diário Ofi cial do Estado de São Paulo, 29 dez 2006;Seção 1:1.
the state of São Paulo. The political-administrative divi-sion of the state’s municipalities was employed as the ecological unit of information; the municipalities were regrouped into 17 departamentos regionais de saúde
(DRS - regional healthcare departments):c Great São Paulo 1), Araçatuba 2), Araraquara (DRS-3), Baixada Santista (DRS-4), Barretos (DRS-5), Bauru (DRS-6), Campinas (DRS-7), Franca (DRS-8), Marília (DRS-9), Piracicaba (DRS-10), Presidente Prudente 11), Registro 12), Ribeirão Preto (DRS-13), São João da Boa Vista (DRS-14), São José do Rio Preto 15), Sorocaba 16) and Taubaté (DRS-17). A geographic information system was constructed with the delimitations of the municipalities and of the DRS, using the software SPRING, in order to conduct the spatial analysis of the endemy in the State.2
The number of detected leprosy cases in each munici-pality in the period from January 2004 to December 2006 was provided by the Ministry of Health, as well as the estimates of the municipal populations’ sizes in 2005, in the middle of the studied period. These data were used in the calculation of the leprosy detection coeffi cients, expressed per 10,000 inhabitants. The spatial analysis of the endemy considered the detec-tion coeffi cients accumulated in the studied period; the temporal analysis considered 17 time series, created in each DRS, whose values were formed by the detection coeffi cients of cases accumulated in each month, since January 2004 until December 2006, totaling 36 histori-cally indexed coeffi cients.
An exploratory analysis was carried out with age group-specific detection coefficients6 in the DRS, adopting the following stratifi cation: “up to 4 years of age” (pre-school phase), “from 5 to 19 years of age” (basic education phase), “from 20 to 34 years of age” (initial productive phase), “from 35 to 49 years of age” (intermediate productive phase), “from 50 to 64 years of age” (tardy productive phase), and “above 65 years of age” (retirement phase).
The study, characterized by the causal ecological-social model, incorporated socioeconomic dimensions, using the components of the Social Responsibility Index of the state of São Paulo (IPRS). This index expresses human development according to measures related to schooling, longevity and income, and is provided by Fundação Sistema Estadual de Análise de Dados
The geostatistical analysis of the leprosy endemy was carried out by the conventional kriging interpolation method, using the detection coeffi cients of the disease of all the 645 municipalities, in the logarithmic scale, to produce the zoning of the epidemiological land-scape.5,8 The kriging interpolation method involves the adjustment of the semivariogram and the estimation of parameters called “nugget”, “sill” and “range”, besides the identifi cation of the directionality of the spatial cor-relations of the semivariogram (Lourenço & Landim,8 2005). The northwest direction was adopted to model the semivariogram, because it corresponds to the direc-tion in which the historical occupadirec-tion of the territory occurred: from the coast to the interior of the country in the azimuthal direction 135º. The software SPRING and R were used in this stage of the work.
The temporal evolution of the endemy was conducted with the series of monthly coeffi cients (t) in each DRS. By defi nition, the values indexed by time (t) are not totally independent among themselves; therefore, they are autocorrelated. The process is Markovian when the autocorrelation is based on fi rst order dependence, that is, when the value at instant “t” depends only on the value at the immediately preceding instant “t-1”; the function called correlogram describes the autocorrela-tion of the time series.13,15 The correlograms of each time series allowed us to adopt them as Markovian stochastic processes, following the mathematical model below to verify the presence of trends:
Y (i, t) = β0 + β1 · t + β2 . y(i,t – 1)
RESULTS
Of the 645 municipalities of the State of São Paulo, 22 did not detect leprosy cases in the period: two mu-nicipalities of DRS-2, one of DRS-3, six of DRS-6, one of DRS-8, fi ve of DRS-9, three of DRS-11, two of DRS-15, and two of DRS-17.
The thematic map resulting from the application of the geostatistical method presents the magnitude of the leprosy endemy in the DRS (Figure 1). High detection coeffi cients were observed in DRS-2, DRS-5, DRS-11 and DRS-15, in the interior of the state, and DRS-17, in the state’s coast, whose values varied between 18.13 and 32.14 cases per 10,000 inhabitants. On the other hand, DRS-1, DRS-16, DRS-7, DRS-14 and DRS-6 showed relatively low detection coeffi cients, whose values varied between 3.25 and 5.77 cases per 10,000 inhabitants, in the studied period.
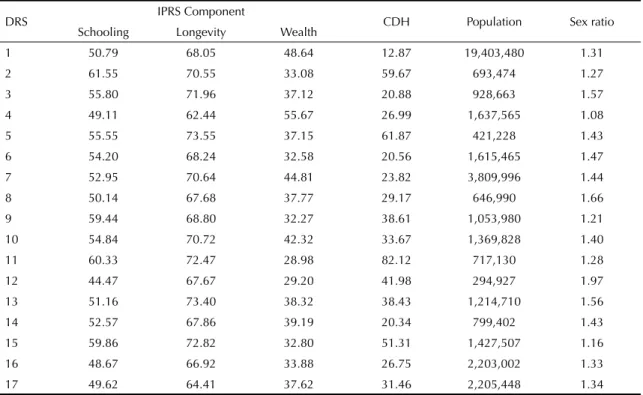
Table 1 shows the results of the exploratory analysis of the ecological-social model per DRS. It contains information on the IPRS components in relation to the leprosy detection coeffi cient, population size and sex ratio. The correlation coeffi cient of the leprosy detection coeffi cients with the average scores of the
“longevity” component resulted in 0.5101 (p=0.0364); with the average scores of the “schooling” compo-nent resulted in 0.5572 (p=0.0201); with the average scores of the “wealth” component resulted in –0.5307 (p=0.0284); with populations’ sizes resulted in –0.4246 (p=0.0893); and with the sex ratios resulted in –0.1444 (p=0.5803). The sex ratios showed the predominance of cases of the male sex.
Table 2 presents the distribution per age group of the proportional coeffi cients in each DRS, showing that the disease was mainly detected in adults who are in the economically productive phase, in a similar way in all the administrative regions.
The results obtained by the mathematical models ad-justed to the series, in the study of the endemy’s trends in the DRS, with diverse temporal patterns, can be seen in Figures 2 and 3: (1) pattern with an increasing trend and with great variability (white noise), observed in DRS-2 and DRS-8; (2) pattern with a decreasing trend and with homogenous evolution, observed in DRS-3, DRS-9, DRS-10, DRS-11 and DRS-12; (3) pattern with a decreasing trend and with a sharp decline between October 2005 and February 2006, observed in DRS-1, DRS-4, DRS-5, DRS-6, DRS-7, DRS-13, DRS-14, DRS-15, DRS-16 and DRS-17. The pattern observed for the state of São Paulo (resulting from the sum of the cases detected in the DRS) showed a decreasing trend, infl uenced by the sharp decline between the months of October 2005 and February 2006.
DISCUSSION
The present study identifi ed a spatial distribution pat-tern of the detection of leprosy cases in the state of São Paulo, with zones of high detection coeffi cients located in DRS-2, DRS-5, DRS-11 and DRS-15. On the other hand, the zones identifi ed by low detection coeffi cients were located in DRS-1, DRS-4, DRS-16, DRS-7 and DRS-14, as well as other zones located in DRS-3 and DRS-6.
resulting from the promotion of individual and col-lective well being and from disease prevention. The “wealth” component is related to economic productive activities, which generate municipal revenues and which allegedly return as public health services. The re-sults of the correlation study establish ecological-level relations that may induce to the ecological fallacy if the interpretations of the correlations between the variables are extended to the individual level. However, these results reveal important information in the regional level, which may infl uence the elaboration of public policies in the governmental level.
The temporal assessment showed that DRS-2 and DRS-8 presented increasing detection trends, above the WHO’s goal for the year 2000, probably associated with the capacity to detect the endemy showed by the health services of these regional departments. In the majority of regions the endemy’s trend was, mathemati-cally speaking, a decreasing one; the temporal series presented random fl uctuation around expected values, which could denote a probable reduction in the endemy. In some of these evolutional patterns, the time series proved to be intriguing, as they presented a sharp de-cline, simultaneously in the DRS, between the months of October 2005 and February 2006, in DRS-1, DRS-4,
DRS-5, DRS-6, DRS-7, DRS-13, DRS-14, DRS-15, DRS-16 and DRS-17. This is not a casual coincidence; it derives from the political changes that infl uenced the capacity to detect the cases, of ten among 17 DRS. The majority of these regions presented an increasing detection trend up to the middle of October 2005; however, the sharp declines after October 2005 changed the variation level of the detection coeffi cients. The parameters of the mathematical model were estimated in each series and the majority resulted in a negative trend, suggesting the decline in the endemy, infl uenced by the described falls. These behaviors are illustrated by the dotted lines in Figures 2 and 3.
Despite the fact that the transmission between individu-als can be controlled through public policies to improve the life condition and the access to the health services, the intervention on the anthropozoonotic transmission mechanisms demands a change in cultural practices and in practices of human contact with wild animals. There is no doubt that home conviviality represents the main contagion form of the disease and the active detection of leprosy cases represents the most effi cient means to achieve the goals for the elimination of the endemy. Therefore, the supervised domiciliary treat-ment represents an important strategy to eradicate or reduce leprosy cases.
Table 1. Descriptive values of the average scores of the components of the Social Responsibility Index of the State of São Paulo (IPRS), of the leprosy detection coeffi cient per 10,000 inhabitants, of population size and of sex ratio, according to the regional healthcare department (DRS). State of São Paulo, Southeastern Brazil, 2004-2006.
DRS IPRS Component CDH Population Sex ratio
Schooling Longevity Wealth
1 50.79 68.05 48.64 12.87 19,403,480 1.31
2 61.55 70.55 33.08 59.67 693,474 1.27
3 55.80 71.96 37.12 20.88 928,663 1.57
4 49.11 62.44 55.67 26.99 1,637,565 1.08
5 55.55 73.55 37.15 61.87 421,228 1.43
6 54.20 68.24 32.58 20.56 1,615,465 1.47
7 52.95 70.64 44.81 23.82 3,809,996 1.44
8 50.14 67.68 37.77 29.17 646,990 1.66
9 59.44 68.80 32.27 38.61 1,053,980 1.21
10 54.84 70.72 42.32 33.67 1,369,828 1.40
11 60.33 72.47 28.98 82.12 717,130 1.28
12 44.47 67.67 29.20 41.98 294,927 1.97
13 51.16 73.40 38.32 38.43 1,214,710 1.56
14 52.57 67.86 39.19 20.34 799,402 1.43
15 59.86 72.82 32.80 51.31 1,427,507 1.16
16 48.67 66.92 33.88 26.75 2,203,002 1.33
17 49.62 64.41 37.62 31.46 2,205,448 1.34
Source: Datasus
DRS: Regional Healthcare Department
Table 2. Distribution of the age group-specifi c coeffi cients, of the number of detected leprosy cases per 10,000 inhabitants, according to the regional healthcare department (DRS). State of São Paulo, Southeastern Brazil, 2004-2006.
DRS Leprosy cases Age group-specifi c incidence coeffi cient (%)
< 4 years 5-19 years 20-34 years 35-49 years 50-65 years > 65 years
1 24,981 0.32 10.75 33.43 28.39 17.95 11.20
2 4,138 0.05 5.24 18.44 31.68 27.11 17.40
3 1,939 0.31 6.55 20.99 31.77 26.56 16.97
4 4,419 0.18 9.05 26.70 29.08 22.86 12.08
5 2,606 0.08 6.10 21.18 30.31 26.75 14.93
6 3,321 0.27 7.56 22.58 30.47 23.58 19.96
7 9,077 0.12 7.61 25.33 31.25 21.52 19.04
8 1,887 0.42 4.29 23.95 33.44 24.32 13.57
9 4,069 0.22 5.43 17.67 30.87 27.80 17.77
10 4,612 0.07 6.35 21.73 33.59 25.00 13.27
11 5,889 0.15 5.48 16.32 33.35 25.71 19.53
12 1,238 0.73 5.57 19.71 31.66 24.47 17.85
13 4,668 0.15 6.62 22.34 31.13 24.59 14.91
14 1,626 1.11 6.03 22.69 31.92 22.08 14.70
15 7,324 0.16 5.52 15.47 30.60 28.14 16.64
16 5,892 0.31 10.01 25.81 32.62 19.23 13.97
17 6,938 0.30 8.82 24.75 30.96 23.18 11.86
Figure 1. Thematic map of the geographic distribution of the leprosy detection coeffi cient per 10,000 inhabitants, according to the regional healthcare department (DRS). State of São Paulo, Southeastern Brazil, 2004-2006.
N
Leprosy Incidence Coefficient from 2004 to 2006 per 10.000 inhabitants
The integration of Programa de Agentes Comunitários
(Community-Based Health Agents Program) and of
Programa Saúde da Família (Family Health Program) is based on actions of educational measures, campaigns to detect suspects, social and community mobilization and adequate register of the cases in the information system of SUS. In addition, it offers technical and fi nancial support to feed the database of Sistema de Informação de Agravos de Notifi cação (Accident and Disease Reports Information System), whose resources were transferred to the municipal health funds. This strategy aimed to meet the goals established by WHO until 2005,12 focusing on important determinants of the endemy related to the offer of health services, mainly through the strategy “Incentive to Expand the
Detection of the Hidden Prevalence of Leprosy”, which provided resources per detected and reported case as a way of stimulating productivity. The results of the present study showed that, in many regions, there was an increase in the detection rate up to the end of 2005, while this strategy was executable; the sharp decreases in the detection coeffi cients that occurred in the turn of 2005 to 2006 may be due to changes in the funding of the procedures.
New goals were established and a strategy was pro-posed by the Ministry of Health, to be developed between 2006 and 2010. Up to the present moment, because of the uncertainty concerning the achieve-ment of the objectives stipulated by the WHO, leprosy
Figure 2. Monthly series of the leprosy detection coeffi cient per 10,000 inhabitants, in the regional healthcare departments (DRS) 1 to 9, showing the observed values (connected by a line), the adjusted values (dots) and the estimated trend (dotted line). State of São Paulo, Southeastern Brazil, 2004-2006.
DRS-1
Jan/03 Jan/04 Jan/05 Dec
0.25
0.30
0.35
0.40
DRS-2
Jan/03 Jan/04 Jan/05 Dec
1.0
1.5
2.0
2.5
DRS-3
Jan/03 Jan/04 Jan/05 Dec
0.3
0.4
0.5
0.6
0.7
0.8
DRS-4
0.6
0.7
0.8
0.9
1.0
Jan/03 Jan/04 Jan/05 Dec
DRS-5
Jan/03 Jan/04 Jan/05 Dec
1.2
1.4
1.6
1.8
2.0
2.2
DRS-6
Jan/03 Jan/04 Jan/05 Dec
0.7
0.8
0.9
1.0
1.1
1.2
1.3
DRS-7
Jan/03 Jan/04 Jan/05 Dec
0.5
0.6
0.7
0.8
DRS-8
Jan/03 Jan/04 Jan/05 Dec
67891
0
DRS-9
Jan/03 Jan/04 Jan/05 Dec
0.8
1.0
1.2
and several other diseases can be labeled as “tropical diseases” because they are endemic in countries with vulnerable economies. Programs based on secondary prevention, on active detection and on supervised treatment represent realistic, effi cient, and lower cost strategies to face the leprosy endemy and meet the established goals. However, other equally important strategies demand high investments and have high costs, such as those based on technology, like molecu-lar biology and the development of vaccines (primary prevention). It should be considered that the state of
São Paulo is part of a country of vulnerable economy and that its population is subject to several epidemics and endemies. Controlling and combating them depend on the harmony between public policies and on the development of science and technology.
To conclude, although the evolution of the leprosy endemy was infl uenced by the Ministry of Health’s strategies in the period between 2004 and 2006, they were not enough to achieve the goals established by the WHO to eliminate the disease.
Figure 3. Monthly series of the leprosy detection coeffi cient per 10,000 inhabitants, in the regional healthcare departments (DRS) 10 to 17 and in the State of São Paulo, showing the observed values (connected by a line), the adjusted values (dots) and the estimated trend (dotted straight line). State of São Paulo, Southeastern Brazil, 2004-2006.
DRS-10
Jan/03 Jan/04 Jan/05 Dec
0.6
0.8
1.0
1.2
DRS-11
Jan/03 Jan/04 Jan/05 Dec
18
20
22
24
26
28
30
DRS-12
Jan/03 Jan/04 Jan/05 Dec
0.8
1.0
1.2
1.4
1.6
1.8
DRS-13
Jan/03 Jan/04 Jan/05 Dec
0.8
1.0
1.2
1.4
DRS-14
Jan/03 Jan/04 Jan/05 Dec
0.4
0.5
0.6
0.7
DRS-15
Jan/03 Jan/04 Jan/05 Dec
1.0
1.2
1.4
1.6
1.8
DRS-16
Jan/03 Jan/04 Jan/05 Dec
0.4
0.5
0.6
0.7
0.8
0.9
1.0
DRS-17
Jan/03 Jan/04 Jan/05 Dec
0.6
0.7
0.8
0.9
1.0
1.1
Estado de São Paulo
Jan/03 Jan/04 Jan/05 Dec
0.50
0.60
0.70
1. Araújo MG. Hanseníase no Brasil. Rev Soc Bras Med
Trop. 2003;36(3):373-82.
2. Camara G, Souza RCM, Freitas UM, Garrido J. Spring: Integrating remote sensing and GIS by object-oriented
data modeling. Computers Graphics
.1996;20(3):395-403. DOI: 10.1016/0097-8493(96)00008-8
3. Chin J. Lepra. In: Manual de controle das doenças transmissíveis. 17. ed. Porto Alegre: Armed; 2002. p. 308-11.
4. Dawson B, Trapp RG. Bioestatística: básica e clínica. 3. ed. Rio de Janeiro: McGraw Hill Interamericana do Brasil; 2003.
5. Diggle PJ, Ribeiro JR, PJ. Model based geostatistics. New York: Springer; 2007.
6. Figueiredo IA, Silva AAM. Aumento na detecção de casos de hanseníase em São Luis, Maranhão, Brasil,
de 1993 a 1998. A epidemia está em expansão? Cad
Saude Publica. 2003;19(2):439-45. DOI: 10.1590/ S0102-311X2003000200010
7. Lapa TM, Albuquerque MFPM, Carvalho MS, Silveira Júnior JC. Análise da demanda de casos de hanseníase aos serviços de saúde através do uso de
técnicas de análise espacial. Cad Saude Publica.
2006;22(12):2575-83. DOI: 10.1590/S0102-311X2006001200008
8. Lourenço RW, Landim PMB. Mapeamento de áreas de risco à saúde pública por meio de métodos
geoestatísticos. Cad Saude Publica. 2005;21(1):150-60.
9. Magalhães MCC, Rojas LI. Diferenciação territorial
da hanseníase no Brasil. Epidemiol Serv Saude.
2007;16(2):75-84.
10. Martelli CMT, Stefani MMA, Penna GO, Andrade ALSS. Endemias e epidemias brasileiras, desafi os e perspectivas de investigação científi ca: hanseníase.
Rev Bras Epidemiol. 2002;5(3):273-85. DOI: 10.1590/ S1415-790X2002000300006
11. Meade M, Earickson A. Medical geography. 2. ed. New York: The Guilford; 2000.
12. Moreira TA. Panorama sobre a hanseníase: quadro
atual e perspectivas. Hist, Cien Saude Manguinhos.
2003;10(supp 1):291-307. DOI: 10.1590/S0104-59702003000400014
13. Moretin PA, Toloi CMC. Análise de séries temporais. 2. ed. São Paulo: Edgarg Blucher; 2004.
14. Opromolla PA, Dalben I, Cardim M. Análise da distribuição espacial da hanseníase no Estado de São
Paulo, 1991-2002. Rev Bras Epidemiol.
2005;8(4):356-64. DOI: 10.1590/S1415-790X2005000400004
15. Sumway RH, Stoffer DS. Time series analysis and its applications with R examples. New York: Springer; 2006.
16. Torres HG, Ferreira MP, Dini NP. Indicadores sociais:
por que construir novos indicadores como o IPRS. Sao
Paulo Perspec. 2003;17(3-4):80-90. DOI: 10.1590/ S0102-88392003000300009