1Article based on the dissertation of ALG SOARES intitled “Disponibilidade domiciliar de alimentos uma abordagem do ambiente
obesogênico”. Universidade Federal de Pelotas; 2012.
2Universidade Federal de Pelotas, Faculdade de Medicina, Programa de Pós-Graduação em Epidemiologia. R. Marechal Deodoro,
1160, 3º piso, 96020-220, Pelotas, RS, Brasil. Correspondência para/Correspondence to: ALG SOARES. E-mail: <[email protected]>.
Support: This study was sponsored by the Postgraduate Program in Epidemiology of the Universidade Federal de Pelotas with funds from the Coordenação de Aperfeiçoamento de Pessoal de Nível Superior (AUX-PE PROEX nº 337/2010).
Household food availability in
Pelotas
,
Brazil: An approach to assess the
obesogenic environment
1Disponibilidade domiciliar de alimentos
em Pelotas (RS)
:
uma abordagem
do ambiente obesogênico
Ana Luiza Gonçalves SOARES2 Giovanny Vinícius Araújo de FRANÇA2 Helen GONÇALVES2
A B S T R A C T
Objective
To identify household food availability according to socioeconomic and demographic factors.
Methods
A cross-sectional, population-based study was carried out in the city of Pelotas, Southern Brazil to determine household food availability in the 30 days that preceded the interview. Availability was considered high when food was “always” or “usually” available at home. The independent variables were: age and education level of the household head, number of household members, presence of children or adolescents, National Wealth Score, and family income.
Results
Conclusion
Socioeconomic factors and demographic characteristics were associated with household food availability. High household availability of fruits and vegetables, together with sweets, processed meats, and soft drinks suggests the complex eating practices of a household, impairing classifying the environment as obesogenic.
Indexing terms: Cross-sectional studies. Food. Socioeconomic factors.
R E S U M O
Objetivo
Avaliar a disponibilidade domiciliar de alimentos de acordo com fatores socioeconômicos e demográficos.
Métodos
Estudo transversal, de base populacional, realizado na cidade de Pelotas, Rio Grande do Sul, em 2012. A disponibilidade domiciliar de alimentos foi medida a partir da frequência da presença do alimento nos 30 dias precedentes à entrevista. Definiu-se alta disponibilidade como a presença sempre ou quase sempre do alimento no domicílio. As variáveis independentes foram: idade e escolaridade do chefe da família, número de moradores, presença de crianças e/ou adolescentes, indicador econômico nacional e renda familiar.
Resultados
Foram obtidas informações de 1.555 domicílios; cerca de 80% deles apresentaram alta disponibilidade de frutas, legumes e verduras, e 40% de refrigerantes, embutidos e guloseimas. Os cereais integrais e alimentos congelados nunca estiveram disponíveis em 50% dos domicílios. Alimentos ricos em açúcares e gorduras esti-veram diretamente relacionados à presença de crianças e/ou adolescentes, enquanto frutas e cereais integrais apresentaram relação inversa. Indicador econômico nacional, renda familiar, idade e escolaridade do chefe da família estiveram significativamente associados à disponibilidade alimentar.
Conclusão
Além de fatores socioeconômicos, características demográficas também estiveram associadas à disponibilidade domiciliar de alimentos. A alta disponibilidade de frutas, legumes e verduras concomitante à de guloseimas, embutidos e refrigerantes demonstra a complexidade da prática alimentar no domicílio, o que dificulta a classificação do ambiente como obesogênico.
Termos de indexação: Estudo transversais. Alimentos. Fatores socioeconômicos.
I N T R O D U C T I O N
Over the last decades, Brazil has experienced a process of food and nutrition transition, where the population replaced foods high in complex carbohydrates and fibers by energy-dense foods, that is, foods with high sugar and fat contents, especially saturated fat1,2. The
participation of minimally processed foods also decreased and that of ultra-processed foods increased3. The Western diet, characterized by
energy-dense foods, those high in lipids and simple carbohydrates, together with low physical activity are the main risk factors for excess weight1,2.
In addition to behavioral, genetic, psychological, and cultural aspects, environmental
aspects are also involved in the etiology of chronic diseases, such as obesity4, and there is a growing
scientific interest in environmental factors5-7,
especially because of their direct or indirect influence on food choices6,8. An obesogenic
environment is a location where opportunity and environmental conditions promote or favor obesity6. The obesogenic environment may be
macro, such as education networks, the food industry, government, and society, or micro, such as schools, workplaces, neighborhoods, and homes, and allows the assessment of its different dimensions6,7.
poorly approached in the literature, and among its many factors, it has food access and availability6,8,11,12. In Brazil the home environment
has been investigated periodically by the Pesquisa de Orçamentos Familiares (POF, Family Budget Survey)9, which determined the relative participation
of foods and food groups in the total number of calories available at home. The last decades have seen a considerable reduction in the relative participation of foods such as rice, beans, and other legumes and an increase in the participation of cookies, soda, processed meats, and ready-to-heat meals. The same study shows that the participation of fruits and vegetables at home remained relatively stable during this period13.
Although POF assesses the purchasing patterns of Brazilian families, it does not assess how often these foods are available at homes.
The foods available at home provide important information about the eating process, especially of households from different socioeconomic levels and compositions. The home food availability has been directly or inversely associated with the intake of many foods and food groups8,12,14,15.The presence of energy-dense,
nutrient-poor foods at home characterizes the home as an obesogenic environment2,6. However,
little is known about the simultaneous presence of these foods and of low-energy, high-fiber foods. Thus, this study aims to determine the availability of high-fat or high-sugar foods, fruits, vegetables, and whole grains at homes, and describe it according to socioeconomic and sociodemographic factors.
M E T H O D S
This population-based, cross-sectional study was conducted in the city of Pelotas, located in the Brazilian South region, from February to June 2012, and is part of a larger project called “Diagnóstico de saúde em adolescentes, adultos e idosos da cidade de Pelotas-RS”, (Health status of adolescents, adults, and older adults from the city of Pelotas, RS).
A pre-pilot study to estimate the prevalence of food availability, in a sample similar to the sample we intended to study, was performed to help determine the study, sample size. The following parameters and estimates were then used: 95.0% confidence level, prevalence of fruit availability of 85.4% (the highest prevalence of food availability found in the pre-pilot study), and sampling error of three percentage points. Another ten percent was added to the calculated sample size to account for losses and participation refusals, and the number was then multiplied by two because of the study design, resulting in a minimum sample size of 1,160 households.
The households were sampled in two stages. Based on Censo Demográfico 2010 (2010 Census) of Instituto Brasileiro de Geografia e Esta-tística (IBGE, Brazilian Insititute of Geography and Statistics) a total of 495 census sectors of the city’s urban area were ordered by numbers, representing all areas of the city. Then, 130 census sectors were systematically selected. The households were systematically selected in each sector, and the number of selected households was proportional to sector size. A mean of 13 households were selected per sector, totaling 1,722 households.
Before the interview, all homes were visited by the field supervisors to deliver a letter of presentation. Later, a semi-structured questionnaire was administered by trained interviewers, preferably to the household head or the individual in charge of the home. The household head was either the person who self-reported as such or the person indicated by the homemaker as being the head. If the questionnaire could not be administered to either of these individuals, it was administered to another household member.
Home food availability was determined by a structured questionnaire, a translated and adapted version of the one used in the Eating Among Teens Project (EAT Project - University of Minnesota, Minneapolis - United States of America)16, which investigates socio-environmental
period that the original questionnaire investigates was reduced from one year to thirty days, as this reflects the purchasing habits of the household and reduces memory bias. Food availability was assessed by the following question, “In the last 30 days, did you have [food] at home?” Each question had an answer key in the form of a 5-point Likert scale17: never, occasionally, sometimes,
usually, or always. This instrument was submitted to a validation study in a sub-study with a sample of 100 households, similar to that included in the present study. A food availability diary based on POF’s Household Purchases Form (Caderneta de Aquisição Coletiva) was used and considered the reference method. The participants were advised to record in the diary all foods purchased over 30 days, which was then used for assessing availability. This validation study is currently being analyzed.
Home food availability was initially classified into three categories (never/occasionally, sometimes, usually/always). Next, high availability was dismembered into either “always” or “usually” available at home. The study foods and/or food groups were: fruits, vegetables, whole grains (whole bread, whole rice, or oat), soda, processed meats (mortadella, salami, sausage, hotdog, or ham), frozen foods (French fries, pizza, or nuggets), packaged savory snacks (potato chips, corn chips, bacon chips, straw potatoes, pretzels, etc.; some examples include Ruffles®, Cheetos®,
Fandangos®, Pastelina®, Fritex® or others), and
sweets (chocolates, candies, and sweets). These foods were based on the original questionnaire adapted to the Brazilian context, to which some foods listed in the literature as risk factors for chronic Non-Communicable Diseases (NCD) were added, such as soda, processed meats, frozen foods, packaged savory snacks, and sweets, and foods listed as protective against NCD (fruits, vegetables, and whole grains)4. Less energy-dense
foods were distributed randomly in the questionnaire to avoid automatic answers or those considered socially appropriate. The participants were also asked where they purchased their fruits and vegetables with the following question, “Where do you usually buy [food]?” The answer
options were: farmer’s market, fruit vendor, grocery story, supermarket/hypermarket. We also asked if the place was located near or far from home.
The study independent variables were: age and education level of the household head (none to third grade; fourth grade to incomplete elementary school; complete elementary school to incomplete high school; complete high school to incomplete higher education; complete higher education); number of household members at the time of the interview; presence of children or adolescents (individuals under 20 years of age); Indicador Econômico Nacional (IEN - National Wealth Score)18 in quintiles; and family income in
minimum salaries (R$622,00 in 2012, which corresponded to roughly US$307,00 per month in July 2012). The variable education level was classified according to the categories used by the Brazilian Economic Classification Criterion developed by the Associação Brasileira de Estudos Populacionais (ABEP, Brazilian Association of Market Research Companies).
The questionnaire was programmed in the software Pendragon 6.1 (Pendragon® Software
Corporation) enabling the use of netbooks during the interviews. The data were transferred weekly to a central computer. Meetings with the interviewers were also held weekly, in addition to database checking for possible inconsistencies. Some questions were readministered by the field supervisors to 10% of the sample to control data quality. The chosen question was the one about where the fruits were purchased, which had a kappa of 0.63.
The study was approved by the Research Ethics Committee of Universidade Federal de Pelotas (UFPel) School of Medicine under Protocol number 77/11. Before joining the study, all participants signed an Informed Consent Form.
R E S U L T S
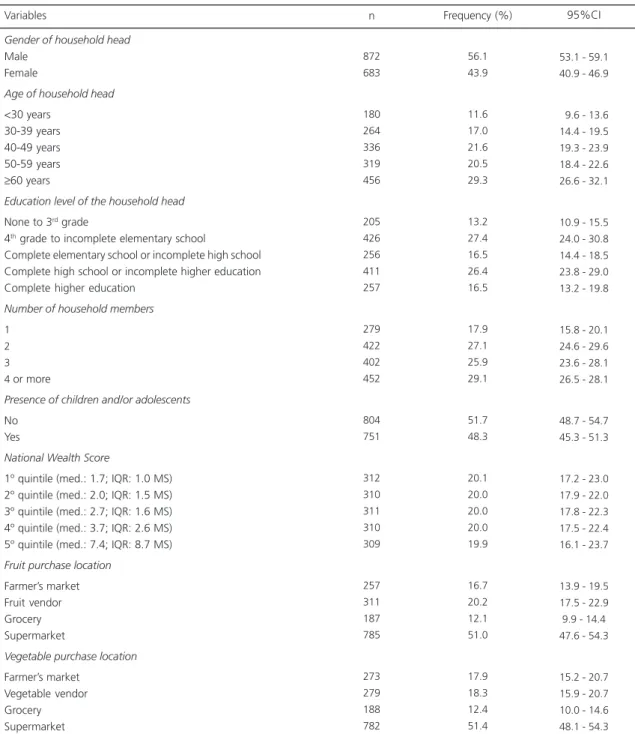
Of the 1,722 eligible households, information was collected from 1,555, totaling 9.7% of loss and refusal. Table 1 shows the
Table 1. Description of the sample according to socioeconomic and demographic characteristics (n=1,555). Pelotas (RS), Brazil, 2012.
Gender of household head
Male Female
Age of household head
<30 years 30-39 years 40-49 years 50-59 years
≥60 years
Education level of the household head
None to 3rd grade
4th grade to incomplete elementary school
Complete elementary school or incomplete high school Complete high school or incomplete higher education Complete higher education
Number of household members
1 2 3 4 or more
Presence of children and/or adolescents
No Yes
National Wealth Score
1º quintile (med.: 1.7; IQR: 1.0 MS) 2º quintile (med.: 2.0; IQR: 1.5 MS) 3º quintile (med.: 2.7; IQR: 1.6 MS) 4º quintile (med.: 3.7; IQR: 2.6 MS) 5º quintile (med.: 7.4; IQR: 8.7 MS)
Fruit purchase location
Farmer’s market Fruit vendor Grocery Supermarket
Vegetable purchase location
Farmer’s market Vegetable vendor Grocery Supermarket 872 683 180 264 336 319 456 205 426 256 411 257 279 422 402 452 804 751 312 310 311 310 309 257 311 187 785 273 279 188 782 56.1 43.9 11.6 17.0 21.6 20.5 29.3 13.2 27.4 16.5 26.4 16.5 17.9 27.1 25.9 29.1 51.7 48.3 20.1 20.0 20.0 20.0 19.9 16.7 20.2 12.1 51.0 17.9 18.3 12.4 51.4
53.1 - 59.1 40.9 - 46.9
09.6 - 13.6 14.4 - 19.5 19.3 - 23.9 18.4 - 22.6 26.6 - 32.1
10.9 - 15.5 24.0 - 30.8 14.4 - 18.5 23.8 - 29.0 13.2 - 19.8
15.8 - 20.1 24.6 - 29.6 23.6 - 28.1 26.5 - 28.1
48.7 - 54.7 45.3 - 51.3
17.2 - 23.0 17.9 - 22.0 17.8 - 22.3 17.5 - 22.4 16.1 - 23.7
13.9 - 19.5 17.5 - 22.9 9.9 - 14.4 47.6 - 54.3
15.2 - 20.7 15.9 - 20.7 10.0 - 14.6 48.1 - 54.3
Variables n Frequency (%) 95%CI
Note: *Missing total - maximum value 33.
demographic and socioeconomic characteristics of the sample. Most household heads were males and the mean age was 49±15.9 years; half were 50 years old or older, and 43.0% had at least a high school diploma. Almost 18.0% of the households consisted of only one person; about 50.0% had children and/or adolescents. The median family income was 1.7 Minimum Salaries (MS) per month in the first IEN quintile (IQR=1.0), and 7.4 MS per month in the fifth quintile (IQR=8.7). More than half of the households bought fruits and vegetables in supermarkets, usually close to home.
Figure 1 shows the reported availability of foods and food groups in the study homes in the 30-day period before the interview divided into three categories. Three distinct food group availability patterns were evident. Fruits and vegetables had similar prevalences and were reported as being usually or always available in roughly 80% of the households. Processed meats, soda, and sweets were usually or always available in about 40% of the households. The availability of whole grains, packaged savory snacks, and frozen foods was similar: they were occasionally or never available in 50% of the households.
Figure 1. Household food availability during the 30-day period before the interview. Pelotas (RS), Brazil, 2012.
Table 2 shows the frequencies of foods and food groups that were usually or always available in the study homes according to the household’s demographic and socioeconomic factors. The age of the household head related positively with a high availability of fruits, vegetables, and whole grains, and inversely with a high availability of processed meats, packaged savory snacks, and frozen foods. The education level of the household head was also directly related to high food availability, except for vegetables and soda. Number of household members was inversely related to a high availability of whole grains and directly related to a high availability of fruits, vegetables, and processed meats. High availability of packaged savory snacks, soda, and sweets also tended to increase with number of household members.
The probability of a home having a high availability of fruits and vegetables was, respectively, 11.0% (Prevalence Ratio - PR=1.11; 95%CI=1.05-1.17) and 14.3% (PR=1.14; 95%CI=1.09-1.20) greater in households who purchased them in farmer’s markets than in those who purchased these items in other vendors. IEN and education level of the household head did
not influence purchasing location (data not shown).
The availability of nearly all foods was greater in homes in the higher IEN quintile, except for packaged savory snacks (Figure 2). Fruits and vegetables were the food groups with the highest frequency of high availability, being roughly 70.0% and 90.0% in the first and fifth quintiles, respectively. Packaged savory snacks were the
foods with the smallest availability variation between the first and fifth IEN quintiles, with a variation of 14.0 percentage points. On the other hand, frozen foods were highly available in only 4.8% of the households in the first IEN quintile and in 26.5% of the households in the fifth IEN quintile, a fivefold increase. High availability of processed meats and whole grains varied greatly between IEN quintiles, with a difference of 35.0
Table 2. High household food availability according to socioeconomic and demographic characteristics (n=1,555). Pelotas (RS), Brazil, 2012.
Age of household head
<30 years
30 - 39 years
40 - 49 years
50 - 59 years
≥60 years
Education level of household head 1 2 3 4 5
Number of household members
1
2
3
4 or +
% 95%CI % 95%CI % 95%CI % 95%CI % 95%CI % 95%CI % 95%CI % 95%CI % 95%CI % 95%CI % 95%CI % 95%CI % 95%CI % 95%CI
p<0.001*
66.7 (59.2;74.2) 73.9 (68.3;79.4) 81.8 (78.0;85.7) 85.3 (81.2;89.3) 89.0 (85.9;92.1)
p<0.001*
75.1 (68.3;81.9) 77.9 (73.7;82.2) 81.2 (76.3;86.1) 83.2 (79.4;87.0) 90.3 (86.3;94.3) p=0.014 76.0 (71.1;80.9) 82.5 (78.4;86.5) 85.6 (82.0;89.1) 80.5 (76.6;84.4) Variables Fruits
p<0.001*
67.8 (60.6;75.0) 72.7% (67.2;78.3) 76.2 (71.6;80.8) 85.3 (81.4;89.1) 86.4 (83.2;89.6) p=0.288 73.7 (66.8;80.5) 80.5 (77.2;83.8) 80.9 (76.2;85.5) 80.0 (76.0;84.1) 80.2 (75.4;84.9) p<0.001 66.3 (60.4;72.2) 81.5 (77.4;85.6) 83.8 (80.0;87.6) 81.9 (78.2;85.5)
p<0.001*
52.2 (44.2;60.3) 52.3 (46.2;58.3) 46.7 (40.7;52.7) 45.5 (40.3;50.6) 35.7 (30.9;40.6)
p<0.001*
31.7 (24.5;38.9) 41.1 (36.3;45.8) 42.2 (35.6;48.7) 51.1 (46.0;56.2) 54.1 (48.6;59.6) p<0.001 25.8 (20.0;31.5) 44.3 (39.2;49.4) 49.3 (43.7;54.8) 53.1 (48.3;57.8) p=0.821 44.4 (36.1;52.8) 42.4 (26.3;48.5) 45.8 (40.3;51.4) 43.2 (37.7;48.8) 41.2 (35.8;46.6) p=0.159 36.1 (29.0;43.2) 43.4 (38.4;48.5) 46.9 (40.7;53.0) 45.3 (40.4;50.1) 41.6 (34.5;48.8)
p<0.001*
32.6 (25.4;39.8) 42.4 (37.1;47.7) 45.3 (40.7;49.8) 48.7 (43.7;53.6)
Veggies Sausages Soda Sweets W grains Snacks F foods
p=0.194 38.3 (32.3;44.4) 40.1 (33.6;46.6) 36.3 (30.8;41.8) 43.3 (37.3;49.2) 35.1 (29.8;40.3)
p<0.001*
29.8 (22.7;36.8) 33.1 (28.6;37.6) 35.9 (30.0;41.8) 41.1 (35.9;46.3) 51.4 (45.0;57.7)
p<0.001*
30.1 (24.3;35.9) 38.4 (33.2;43.5) 40.5 (35.4;45.7) 41.1 (36.4;45.9)
p<0.001*
23.3 (16.6;30.1) 21.6 (16.2;27.0) 27.1 (22.0;32.1) 40.4 (34.8;46.1) 44.1 (38.6;49.5) p<0.001 23.4 (16.6;30.2) 23.2 (18.9;27.5) 27.3 (22.1;32.5) 39.2 (34.2;44.1) 55.2 (47.9;62.6) p<0.001 38.4 (32.1;44.6) 39.6 (33.9;45.2) 28.9 (23.6;34.1) 28.8 (23.9;33.6)
p<0.001*
28.9 (22.1;35.7) 26.5 (21.4;31.6) 21.4 (16.7;26.2) 20.4 (15.5;25.2) 14.3 (10.9;17.6) p=0.008 13.7 (8.8;18.5) 18.8 (15.2;22.3) 22.3 (17.3;27.2) 25.8 (21.2;30.3) 20.6 (15.1;26.1)
p<0.001*
10.4 (6.4;14.4) 17.1 (13.7;20.4) 24.6 (19.7;29.5) 27.4 (23.9;31.0)
p=0.002*
18.3 (12.6;24.1) 16.3 (11.9;20.6) 15.5 (11.1;19.8) 15.1 (11.0;19.1) 9.6 (6.7;12.5)
p<0.001*
6.3 (2.7;10.0) 8.2 (5.5;10.9) 9.8 (6.0;13.5) 19.9 (16.1;23.8) 25.3 (19.1;31.4) p=0.125 12.2 (7.3;17.1) 11.6 (8.6;14.6) 16.4 (12.8;20.0) 15.7 (12.2;19.2)
Note: *Linear trend; 95%CI: 95% Confidence Interval.
Education level of the household head: 1: None to 3rd grade; 2: 4th grade to incomplete elementary school; 3: Complete elementary school to
incomplete high school; 4: Complete high school to incomplete higher education; 5: Complete higher education.
percentage points between the first and fifth quintiles. The high availability of foods considered risk factors for NCD, excluding frozen foods, was directly related to the high availability of fruits and vegetables (data not shown).
Table 3 shows the frequency of high food availability stratified by the presence or absence of children and/or adolescents and the prevalence ratios, considering the absence of children as reference. High availability of fruits and whole grains was inversely related to the presence of children and/or adolescents; for example, the availability of whole grains was 43% lower in households with children and/or adolescents. On the other hand, high availability of processed meats, soda, packaged savory snacks, and frozen foods was positively related to the presence of children and/or adolescents; the availability of packaged savory snacks was 90% greater in households with at least one person aged less than 20 years than in households with only adults and/or older adults.
D I S C U S S I O N
Investigating home food availability provides information about the initial phase of the eating process, which involves choice and acquisition. This study described food availability, one of the home environment dimensions that can contribute to obesity and other diseases. Most households had a high availability of fruits and vegetables,
and in many of these households, the availability of processed meats, soda, and sweets was also high.
The high availability of fruits and vegetables at least shows that almost all study households buy them frequently, but this does not seem to confirm the consumption of these products, which in Brazil is much lower than the consumption recommended by the World Health Organization (WHO) and evidenced by studies19,20.
The high availability of these foods may result from the widespread advertising of their importance to health. In Brazil, there are no published studies about the frequency of home availability of fruits and vegetables, but in other countries with distinct socioeconomic characteristics, such as Australia and the USA, the frequency of availability exceeded 90%8,21. Some authors14,15
have highlighted the importance of having fruits and vegetables frequently available at home, demonstrating that even when preference for these foods is low, their availability may favor intake22.
Although whole grains were never available in almost half the households, they were highly available in roughly 55% of the higher IEN households and in those whose heads had higher education. The ability to buy these foods is related to their higher price compared with refined grains and other high-fat, high-sugar foods5,23,24. Higher
education level may be related to knowing about the benefits of consuming high-micronutrient,
Table 3. High household food availability according to the presence of children and/or adolescents. Pelotas (RS), Brazil, 2012.
Fruits Vegetables Sausages Soda Sweets Whole grains Packaged savory snacks Frozen foods
79.4% 78.2% 51.5% 46.3% 40.2% 24.0% 27.6% 17.0%
83.6% 80.7% 38.6% 40.3% 36.4% 42.3% 14.6% 11.4%
0.95 0.97 1.34 1.15 1.10 0.57 1.89 1.49 Foods Households with children Households without children Prevalence ratio
0.91 - 0.99 0.92 - 1.02 1.20 - 1.49 1.01 - 1.30 0.97 - 1.25 0.48 - 0.66 1.53 - 2.35 1.12 - 1.98 95%CI
high-fiber foods and the importance that buying these foods has on the family and social spheres.
Soda, processed meats, and sweets had very similar high availability prevalences: they were usually or always present in about 40% of the households; this finding is similar to that found in high-income countries8,21. This may indicate diet
westernization, a fact that is occurring in many parts of the world1. The high frequency of
availability of these foods, packaged savory snacks, and frozen foods was positively associated with the education level of the household head (except for soda) and IEN. In Brazil the relative participation of these foods is directly related to family income9. Since these foods are more
energy-dense, even small amounts contribute more to total energy than other less energy-dense foods. In high-income countries the availability of these foods is higher in lower-income households8.
In agreement with the literature24, the
education level of the household head and IEN were positively related to the availability of foods that protect against NCD, but they were also directly related to a higher availability of risky foods. There is scientific evidence that the presence of soda, sweets, cookies, and packaged savory snacks at home is not only positively associated with their intake, but also inversely related to the intake of fruits and vegetables25. Hence, the
availability of high-fat or high-sugar foods at home may encourage their intake and discourage the intake of less energy-dense foods with higher micronutrient and fiber contents.
The relationship between the age of the household head and the foods available at home possibly indicates that people become more careful with their diets as they age, either to prevent or control NCD19. The lower home
availability of processed meats, packaged savory snacks, and frozen foods in households whose heads were aged 50 years or more may also be justified by their eating habits, established at a time when ultra-processed foods were less common3,19. However, the household food buyer
was not interviewed to confirm this hypothesis. Information about the relationship between age of the household head and/or food buyer and the food groups available at home was not found in the relevant literature.
Household composition was also associated with the food groups available at home. High-sugar and high-fat foods were positively related and fruits and whole grains were inversely related to the presence of children and/or adolescents in the household. These associations were opposite to those found regarding the household head’s age because of the smaller probability of finding children and/or adolescents in households where the head and other members are older. Studies on the influence of children and/or adolescents on food purchases have found that these individuals tend to have a greater influence on the purchase of products of which they are the primary consumers26,27. Therefore, these groups
could encourage the purchase of high-fat and high-sugar foods, which are generally more palatable and advertised than other foods5,23,24.
Despite the small number of households who purchased produce at farmer’s markets, the frequency of availability of these items was about 10% higher in such households. A Brazilian study28 found that farmer’s markets tend to be
located in central areas with higher purchasing power, in addition to a positive relationship between regular produce intake and the density of farmer’s markets in a given location. The education level of the study household head and the income of households who purchased produce in farmer’s markets were similar to those who purchased in other places. Although these socioeconomic factors are related to fruit and vegetable availability19,29, purchase location may
also provide important information.
relying on the interviewee’s perception, the frequency of availability of the study food groups probably reveals part of the purchasing habits of the study households over a 30-day period and provides important information about the food preferences of the household and its individual members. Nevertheless, the availability assessed herein reflects neither the food diversity nor the food intake frequency because the instrument was restricted to food groups. Studies that actually assess the relationship between the household availability of these foods and/or food groups and their intake are needed.
The literature shows that low household availability of foods that protect against obesity predicts lower consumption of such foods, while high availability of risky foods encourages their consumption24. On the other hand, high availability
of protective foods combined with limited availability of risky foods suggests a higher intake of protective foods15. Therefore, anti-obesity and
obesity-promoting foods may be present in the same household, showing the complexity of dietary issues and the difficulty of classifying an environment as obesogenic. We highlight the need of studies that attempt to clarify the relationship between the great diversity of foods in the home environment and food choices/intake, the home’s obesogenic level, and the extent to which the intake of risky foods reduces that of protective foods. Even though these factors vary, a detailed account of the foods a given population has at home provides important elements for the creation of public policies that encourage or restrict the purchase of certain foods.
C O N T R I B U T O R S
ALG SOARES helped to plan the study, review the literature, analyze the results, and write the manuscript. GVA FRANÇA helped to plan the study, analyze the data, and write and review the manuscript. H GONÇALVES helped to plan the study, analyze the data, and review the manuscript.
R E F E R E N C E S
1. Popkin BM. Contemporary nutritional transition: Determinants of diet and its impact on body composition. Proc Nutr Soc. 2011; 70(1):82-91. doi: 10.1017/S0029665110003903
2. Wanderley EN, Ferreira VA. Obesidade: uma perspectiva plural. Cienc Saúde Colet. 2010; 15(1):185-94. doi: S1413-81232010000100024 [pii]
3. Monteiro CA, Levy RB, Claro RM, de Castro IR, Cannon G. Increasing consumption of ultra-processed foods and likely impact on human health: Evidence from Brazil. Public Health Nutr. 2011; 14(1):5-13. doi: 10.1017/S1368980010003241 4. World Health Organization. Diet, nutrition an the
prevention of chronic diseases. Geneva: WHO; 2003.
5. Popkin BM, Adair LS, Ng SW. Global nutrition transition and the pandemic of obesity in developing countries. Nutr Rev. 2012; 70(1):3-21. doi: 10.1111/j.1753-4887.2011.00456.x 6. Swinburn B, Egger G, Raza F. Dissecting obesogenic
environments: The development and application of a framework for identifying and prioritizing environmental interventions for obesity. Prev Med. 1999; 29(6 Pt 1):563-70. doi: 10.1006/pmed.1999. 0585S0091-7435(99)90585-6 [pii]
7. Spence JC, Cutumisu N, Edwards J, Raine KD, Smoyer-Tomic K. Relation between local food environments and obesity among adults. BMC Public Health. 2009; 9:192. doi: 10.1186/1471-24 58-9-192
8. MacFarlane A, Crawford D, Ball K, Savige G, Worsley A. Adolescent home food environments and socioeconomic position. Asia Pac J Clin Nutr. 2007; 16(4):748-56.
9. Instituto Brasileiro de Geografia e Estatística. Pes-quisa de orçamentos familiares 2008-2009: avaliação nutricional da disponibilidade domiciliar de alimentos no Brasil. Rio de Janeiro: IBGE; 2010. 10. Olinto MT, Willett WC, Gigante DP, Victora CG. Sociodemographic and lifestyle characteristics in relation to dietary patterns among young Brazilian adults. Public Health Nutr. 2011; 14(1):150-9. doi: 10.1017/S136898001000162X
11. Bryant M, Stevens J. Measurement of food availability in the home. Nutr Rev. 2006; 64(2 Pt 1): 67-76.
Health Nutr. 2013; 16(7):1206-14. doi: 10.1017/S13 68980012003461
13. Levy-Costa RB, Sichieri R, Pontes NS, Monteiro CA. Disponibilidade domiciliar de alimentos no Brasil: distribuição e evolução (1974-2003). Rev Saúde Pública. 2005; 39(4):530-40. doi: 10.1590/S0034-89102005000400003
14. Campbell KJ, Abbott G, Spence AC, Crawford DA, McNaughton SA, Ball K. Home food availability mediates associations between mothers’ nutrition knowledge and child diet. Appetite. 2013; 71:1-6. doi: 10.1016/j.appet.2013.07.006
15. Larson N, Laska MN, Story M, Neumark-Sztainer D. Predictors of fruit and vegetable intake in young adulthood. J Acad Nutr Diet. 2012; 112(8):1216-22. doi: 10.1016/j.jand.2012.03.035
16. University of Minnesota. Project EAT (Eating Among Teens). Minnesota: School of Public Health; 2008 [cited 2011 Aug 10]; Available from: <http:// www.sph.umn.edu/epi/research/eat/index.asp>. 17. Likert R. A technique for the measurement of
attitudes. Arch Psychol. 1932; 140:1-55.
18. Barros AJ, Victora CG. Indicador econômico para o Brasil baseado no censo demográfico de 2000. Rev Saúde Pública. 2005; 39(4):523-9. doi: S0034-8 9102005000400002[pii]/S0034-8910200500 0400002
19. Jaime PC, Figueiredo IC, Moura EC, Malta DC. Fato-res associados ao consumo de frutas e hortaliças no Brasil, 2006. Rev Saúde Pública. 2009; 43(Suppl 2):57-64. doi: S0034-89102009000900008 [pii] 20. Souza AM, Bezerra IN, Cunha DB, Sichieri R.
Avaliação dos marcadores de consumo alimentar do VIGITEL (2007-2009). Rev Bras Epidemiol. 2011; 14(Suppl 1):44-52.
21. Hanson NI, Neumark-Sztainer D, Eisenberg ME, Story M, Wall M. Associations between parental report of the home food environment and adolescent intakes of fruits, vegetables and dairy foods. Public Health Nutr. 2005; 8(1):77-85.
22. Neumark-Sztainer D, Wall M, Perry C, Story M. Correlates of fruit and vegetable intake among adolescents: Findings from Project EAT. Prev Med. 2003; 37(3):198-208. doi: S0091743503001142 [pii]
23. Drewnowski A. Obesity and the food environment: Dietary energy density and diet costs. Am J Prev Med. 2004; 27(3 Suppl):154-62. doi: 10.1016/ j.amepre.2004.06.011
24. Rosenkranz RR, Dzewaltowski DA. Model of the home food environment pertaining to childhood obesity. Nutr Rev. 2008; 66(3):123-40. doi: 10.11 11/j.1753-4887.2008.00017.x
25. Vereecken C, Haerens L, De Bourdeaudhuij I, Maes L. The relationship between children’s home food environment and dietary patterns in childhood and adolescence. Public Health Nutr. 2010; 13(10A): 1729-35. doi: S1368980010002296 [pii]10.1017/ S1368980010002296
26. Flurry LA, Burns AC. Children’s influence in purchase decisions: A social power theory approach. J Bus Res. 2005; 58(5):593-601. doi: 10.1016/j.jbusres.2003.08.007
27. Martensen A, Grønholdt L. Children’s influence on family decision making. Innov Mark. 2008; 4(4):14-22. 28. Jaime PC, Duran AC, Sarti FM, Lock K. Investigating environmental determinants of diet, physical activity, and overweight among adults in São Paulo, Brazil. J Urban Health. 2011; 88(3):567-81. doi: 10.1007/s11524-010-9537-2
29. Claro RM, Monteiro CA. Renda familiar, preço de alimentos e aquisição de frutas e hortaliças no Brasil. Rev Saúde Pública. 2010; 44(6):1014-20. doi: S0034-89102010000600005 [pii]