Major Article
Corresponding author: Dr. Washington Luiz Félix Correia Filho. e-mail: [email protected]
Received 15 October 2016 Accepted 24 February 2017
Inluence of meteorological variables on dengue incidence
in the municipality of Arapiraca, Alagoas, Brazil
Washington Luiz Félix Correia Filho
[1][1]. Programa de Pós-Graduação em Ciências Climáticas, Universidade Federal do Rio Grande do Norte, Natal, RN, Brasil.
Abstract
Introduction: Meteorological inluences along with the lack of basic sanitation has contributed to disease outbreaks, resulting
in large socio-economic losses, especially in terms of dengue. This study aimed to evaluate the meteorological inluences on the monthly incidence of dengue in Arapiraca-AL, Brazil during 2008-2015. Methods: We used generalized linear models constructed
via logistic regression to assess the association between the monthly incidence of dengue (MID) of and 8 meteorological variables [rainfall (R), air temperature (AT), dew point temperature (DPT), relative humidity (RH), pressure surface, wind speed (WS), wind direction (WD), and gust], based on data obtained from DATASUS and meteorological station databases, respectively. The dengue-1 model included R, AT, DPT, and RH and the dengue-2 model included AT, DPT, RH, WS, and WD. A MID >100 (classiied as moderate incidence) indicated an abnormal month. Results: Based on the dengue-1 model, variables with the
highest odds ratio included R-lag1, DPT-lag1, and AT-lag1 with a 10.1, 18.3, and 26.7 times greater probability of a moderate MID, respectively. Based on the dengue-2 model, variables with the highest odds ratio were AT-lag1 and RH-lag0 indicating an 8.9 and 18.1 times greater probability of a moderate MID, respectively. Conclusions: AT, DPT, R, RH and WS inluenced the
occurrence of a moderate MID.
Keywords: Odds ratio. Wind direction. Dew point temperature. Rainfall. Air temperature.
INTRODUCTION
Dengue is a noncontagious infectious disease of viral etiology. It is one of the most detrimental zoonoses, and mainly occurs in tropical countries such as Brazil. Currently, the dengue virus has four serotypes, Type-1, Type-2, Type-3 and Type-4, which belong to the family Flaviviridae. All serotypes
essentially cause the same symptoms1, and the infection
manifests as the classic or hemorrhagic form2.
In recent years, dengue outbreaks have become more frequent in Brazil, which is therefore a major public health concern. In the years 2013 and 2015, approximately 1,45 million and 1,65 million conirmed cases of dengue were recorded, respectively3. In Alagoas, based on the Sistema Informação para
Notiicações e Agravos (SINAN) provided by the Secretaria Estadual de Saúde de Alagoas (SES-AL), nearly 33,939 cases were reported in 2014 and 2015, and 11,409 of these cases occurred in the municipality of Arapiraca4.
Several factors contribute to the spread of dengue including infrastructure and sanitation conditions5. Other factors include
environmental conditions such as changes in weather and
climate6 and increases in the number of breeding sites for the
immature forms of the vector7. Abrupt changes in temporal or
seasonal meteorological variables (such as temperature and rainfall) have shown to inluence the incidence of dengue6,8, mainly due to alterations in the larval and pupae production process8. Infestation typically begins during the rainy season wherein favorable humidity and temperature conditions are available for the development of the mosquito embryo, which completes within 48 hours9.
Several studies have evaluated the interaction between meteorological variables and the incidence of dengue. One study conirmed that the highest incidence of dengue was reported in the municipality of Jataí-GO, Brazil during April, just after the period of maximum rainfall in March owing to accumulation of water in containers and decreased runoff favoring proliferation10.
Another study reported that in the City of Guangzhou-China during 2007-2012, a unit increase in the minimum temperature, rainfall, and relative humidity, resulted in a relative risk for dengue of 10.2%, 5.1%, and 2%, respectively11. The relative
risk for dengue in three States of Malaysia during 2008-2010 was found to be 11.9% when the minimum temperature was between 25.4°C and 26.5ºC and 21.4% when the rainfall was between 215mm and 302mm; however, wind speed (WS) was found to induce an opposite effect12. Therefore, the objective
METHODS
The municipality of Arapiraca (367.5km2), in the State of
Alagoas, is a sub-humid, rural area located 264m above sea level with a population of 231,053 inhabitants13. It is situated 128km to the west of the capital of Alagoas, Maceió City, in Northeastern Brazil. The weather is classiied as type A according to the Köppen climate classiication, with a dry season in summer and rains in autumn/winter14. The annual temperature
averages at 25°C and the annual rainfall ranges 750-1,000mm15.
We referred to two data sources for this study. The monthly number of notiications/conirmations for dengue cases were obtained from the SINAN, provided by the Secretaria Estadual de Saúde de Alagoas (SES-AL)4. Hourly data from surface
weather stations in Arapiraca (latitude: -9.80º, longitude: -36.61º, altitude: 237m) were provided by Instituto Nacional de Meteorologia do Brasil (INMET)16 for the period 2008-2015.
We used eight meteorological variables: rainfall (R), air temperature (AT), dew point temperature (DPT), relative humidity (RH), pressure surface (PS), Wind Speed (WS), wind direction (WD) and gust (GS). The data were converted to hourly averages to calculate the monthly averages. The incidence of dengue was calculated using the following equation:
Number of conirmed dengue cases in residents *100,000 (1) Total resident population
The cross-correlation function method, which yields the correlation between two time series, was applied to understand the interaction between meteorological variables and MID17.
Logistic regression was used to evaluate individually and collectively the degree of the association between MID (response variable) and the eight meteorological variables (explanatory variables) accompanied by their respective lags (0, 1, 2 and 3) in 32 variables, keeping in mind that the explanatory and response variables were dichotomous18. Logistic regression models evaluate two important criteria: 1) given a set of explanatory variables (meteorological variables), it estimates the probability of occurrence of an event of interest (MID) on the basis of contingency tables (Table 1). The second criteria is calculates
the odds ratios for the inluence of each meteorological variable on the MID on the basis of contingency tables.
For the purpose of this study, a MID >100 (classiied as moderate incidence) indicated an abnormal month under the following conditions: RH, R, and WD less than 69.9%, 158mm, and 140.0º (Southeastern direction), respectively; TA, DPT, SP, WS, and GS exceeding, 26.7°C, 20.7°C, 985.0hPa, 3.8m.s-1, and 7.4m.s-1, respectively. The probability of obtaining a MID >100 (π= probability of sucess), the chance was expressed as follows:
(2) Chances are non-negative, Ω > 1, when the MID overlaps with non-occurrence. The odds ratio was expressed as follows:
(3)
Where θ > 1 (θ < 1) represents the risk factor (protection or inhibition), while θ = 1 indicates no inluence (protective or risk).
Logistic regression was expressed as follows:
(4)
π(x) is the probability of MID, expressed as:
(5)
Construction of the β0 and β1 model was based on the results
obtained from the contingency table (Table 1) using the log-odds of the observed data:
(6)
β1 represents the magnitude of the association between group status and response in terms of a linear model component.
Goodness of it analysis was performed to evaluate the quality of the logistic regression, using the Akaike information criterion (AIC) and receiver operating characteristic (ROC) curve methods. The AIC allows for preselection of a set of explanatory variables, which results in the inclusion of the most suitable variables in the inal model19. Therefore, the degree of association between the MID and meteorological variables were individually and collectively analyzed, after adjusting for potential confounders and excluding variables that demonstrated multicollinearity based on a statistical signiicance level of p < 0.10. The AIC was expressed as follows:
AIC = ̶ 2L + 2
κ
(7) Where L is the maximum log-likelihood and k is the number of explanatory variables in the model (including the constant). The lower the AIC value, the better the it of the model.An ROC curve analysis, or the C statistic, is used to evaluate the performance of logistic and Poisson regression models for dichotomous variables20. Using a binary classiication, the
results were scored as positive or negative. However, there were four possible outcomes using this binary classiier (Table 2): if
the forecast and observation are positive, it is considered true positive (TP), a positive forecast and negative observation is counted as false positive (FP). On the other hand, if the forecast is negative and the observation is positive, it is counted as false negative (FN); lastly, a negative forecast and observation is counted as true negative (TN)20. Table 2 shows the calculation
of the sensitivity = TP/(TP + FP) and speciicity = TN/(TN + FN). The higher the sensitivity, the better is the model’s predictive ability.
The area under the ROC curve was calculated as follows: (8) Where Y1 is the predicted probability for the occurrence of events, Y2 is the predicted probability for the absence of events. The value of C ranged from 0.5 (very poor predictive ability) to 1 (best predictive capacity).
RESULTS
Variable MID
yes no Total
Abnormal A B n1 = A + B
Normal C D n2 = C + D
Total A+C B+D N = n1 + n2
MID: monthly incidence of dengue; A: variable with abnormal cases for MID occurrence; B: variable with abnormal cases for non-MID occurrence; C: variable with normal cases for MID occurrence; D: variable with normal cases for non-MID occurrence; n1: sum of abnormal cases; n2: sum of normal cases; N: total cases.
TABLE 1
Contingency table between the MID and meteorological variables.
Forecast Observed
positive negative Total
Positive True positive (TP) True positive (FP) T+ = TP + FP
Negative False negative (FN) True negative (TN) T- = FN + TN
Total D+ = TP+FN D- = FP+TN N = TP+FP+FN+TN
TP/D+: sensitivity; TN/D: speciicity; T+: forecast positive total; T-: forecast negative total; D+: observed negative total; D-: observed forecast negative total; N: total cases. 21
TABLE 2 Decision-making.
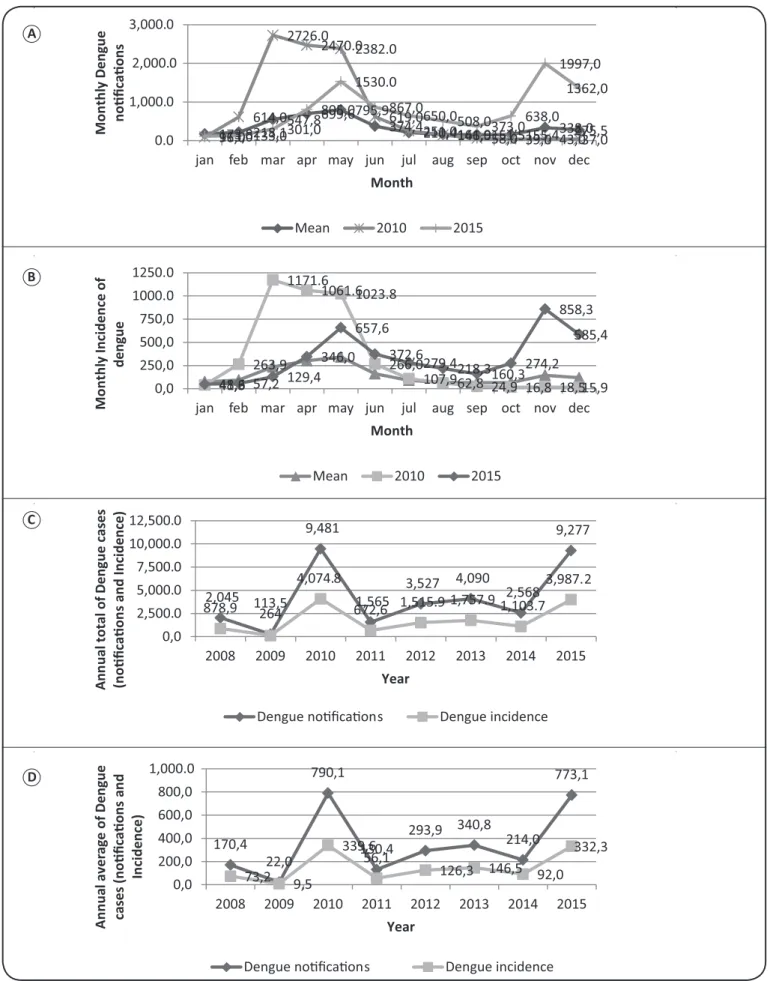
Moreover, the lowest rates for notiications and incidence of dengue occurred in September with an average of 151.5 and 65.1, respectively; the peak values were recorded in May, with an average of 795.9 and 342.1, respectively. The MID between March and June was recorded as >300 per 100,000 inhabitants, which indicates a high incidence of dengue.
In 2010, average incidence of dengue in Arapiraca was the highest recorded owing to an epidemic, with the total number of notiications exceeding 10,000. The MID between March and June was recorded as >300 per 100.000 inhabitants, which indicates a high incidence of dengue based on the dengue incidence criterion of >500/100,000 inhabitants4.
The total annual number of dengue notiications (Figure 1C)
saw an abrupt increase between 2009 and 2010, jumping from 264 (22 per month) to 9,481 notiications (790.1 per month). During the outbreak in 2010, the monthly notiication rate varied between 37 (December) and the peak of 2,726 (March) cases (1171.6/100,000 inhabitants). The average annual incidence of dengue (Figure 1D) between 2009 and 2010, increased from
9.5 to 339.5, indicating a high incidence of dengue. In 2015, the average annual incidence of dengue was similar to that at 2010, with a value of 332.3.
Evaluation of the association between meteorological variables and their lags and MID based on the logistic regression analysis resulted in two models. The AIC-selected dengue-1 model included the following variables: R (lags 0 and 1), AT (lag 1), DPT (lags 1 and 3), and RH (lags 0 and 3) (Table 3). The
selected variables included in the dengue-1 model were found to be statistically signiicant (p < 0.05). Based on the abnormality criteria (Table 3), the dengue-1 model indicated that RH-lag3
(<69.9%), DPT-lag3 (<20.7ºC), R-lag0 (<149.2mm), RH-lag0 (<69.9%), R-lag1 (<150.8mm), DPT-lag1 (<20.7 ºC), and AT-lag1 (>26.7ºC) were associated with moderate MID.
The OR represents the association between variables and MID. The AT and DPT present the highest odds with 18.3 and 26.8 times, respectively. In addition, when P is less than 149.2mm, the chances increase in 10.1 times for MID. The dengue-2 model demonstrated a different set of variables: AT (lag 1), DPT (lag 1), RH (lag 0), WS (lag 1), and WD (lag 3) (Table 3); the last three variables were not part of the
previous model. The dengue-2 model exhibited good statistical signiicance (p < 0.10), except for WS-lag3.
The ORs for the dengue-2 model indicated that WS-lag2 (<3.8m.s-1), WD-lag3 (<140.7°, Southeastern direction), DPT-lag1 (<20.7 ºC), AT-DPT-lag1 (>26.7 ºC), and RH-lag0 (<69.9 %) were likely associated with MID. The thermals variables presented the highest OR results, DPT, AT and RH present the chance values of 3.5, 8.9 and 18.1 times for MID, respectively.
173,8218,1 547,8699,6795,9 374,4210,4161,9151,5155,4338,0275,5 96,0 614,0 2726.0 2470.02382.0 619,0
251,0146,058,0 39,0 43,037,0 113,0133,0301,0
805,0 1530.0
867,0
650,0508,0373,0638,0 1997,0 1362,0 0.0 1,000.0 2,000.0 3,000.0
jan feb mar apr may jun jul aug sep oct nov dec
M o n th ly D e n g u e n o fi ca o n s Month
Mean 2010 2015
41,3 263,9
1171.6
1061.61023.8
266,0
107,962,8 24,9 16,8 18,515,9 48,6 57,2 129,4
346,0 657,6
372,6
279,4218,3160,3274,2 858,3 585,4 0,0 250,0 500,0 750,0 1000.0 1250.0
jan feb mar apr may jun jul aug sep oct nov dec
M o n th ly In ci d e n ce o f d e n g u e Month
Mean 2010 2015
2,045 264 9,481 1,565 3,527 4,090 2,568 9,277 878,9 113,5 4,074.8
672,6 1,515.9 1,757.9 1,103.7 3,987.2 0,0 2,500.0 5,000.0 7,500.0 10,000.0 12,500.0
2008 2009 2010 2011 2012 2013 2014 2015
A n n u a l to ta l of D e n g u e c a se s (n o fi ca o n s a n d In ci d e n ce ) Year
Dengue noficaons Dengue incidence
170,4 22,0 790,1 130,4 293,9 340,8 214,0 773,1 73,2 9,5 339,6 56,1
126,3 146,5 92,0 332,3 0,0 200,0 400,0 600,0 800,0 1,000.0
2008 2009 2010 2011 2012 2013 2014 2015
A n n u a l a v e ra g e o f D e n g u e ca se s (n o fi ca o n s a n d In ci d e n ce ) Year
Dengue noficaons Dengue incidence
A
B
C
D
Dengue-1
Variable Coeff ± SE Value-p Abnormality criteria OR (95% CI)
Intercept -5.5 ± 1.7 0.00 --
--RH-lag3 -2.7 ± 1.5 0.07 <69.9% 0.1 (0.0–1.3)
DPT-lag3 1.5 ± 0.8 0.05 <20.7ºC 4.4 (0.96–19.9)
R-lag0 1.9 ± 1.0 0.04 <149.2mm 7.0 (1.05–46.4)
RH-lag0 2.0 ± 1.0 0.04 <69.8% 7.3 (1.05–50.6)
R-lag1 2.3 ± 1.0 0.02 <150.8mm 10.1 (1.4–73.7)
DPT-lag1 2.9 ± 0.8 <0.00 <20.7 ºC 18.3 (3.6–93.4)
AT-lag1 3.3 ± 1.4 0.02 >26.7 ºC 26.7 (1.6–433.1)
Dengue-2
Variable Coeff ± SE p-value Abnormality criteria OR (95% CI)
Intercept -2.0 ± 0.6 0.00 --
--WS-lag2 -2.7 ± 2.6 0.01 <3.8m.s-1 0.1 (0.0–1.6)
WD-lag3 1.2 ± 0.7 0.12 <140.7ºC 3.2 (0.7–13.6)
DPT-lag1 1.2 ± 0.6 0.03 < 0.7ºC 3.5 (1.1–11.0)
AT-lag1 2.2 ± 1.2 0.07 >26.7ºC 8.9 (0.8–99.5)
RH-lag0 2.9 ± 1.2 0.02 <69.9% 18.1 (1.6–206.2)
AIC Dengue 1 = 103.9 AIC Dengue 2 = 105.6
Coeff: regression coeficient; SE: standard error; OR: odds ratio; CI: conidence interval at 95%; RH-lag0 and RH-lag3: relative humidity actual and lag of three months, respectively; AT-lag1: air temperature with lag of one month; WD-lag2: wind direction with lag of two months; WS-lag3: wind speed with lag of three months; DPT-lag1: dew point temperature with lag of one month; R-lag0 and R-lag1: rainfall actual and lag of one month, respectively; AIC: Akaike information criterion .
TABLE 3
Dengue-1 and dengue-2 models constructed via logistic regression.
1,00 1,00 0,92
0,91
0,66 0,65
0,29 0,26
0,20
0,09 0,06 0,03 0,00
1,00 1,00 1,00
0,92 0,91
0,43 0,42
0,34
0,26
0,20
0,14
0,03 0,00 0,0 0,1 0,2 0,3 0,4 0,5 0,6 0,7 0,8 0,9 1,0
0,0 0,1 0,2 0,3 0,4 0,5 0,6 0,7 0,8 0,9 1,0
S
e
n
si
ti
v
it
y
1-Specificity
Dengue M1=0.83 Dengue M2=0.79
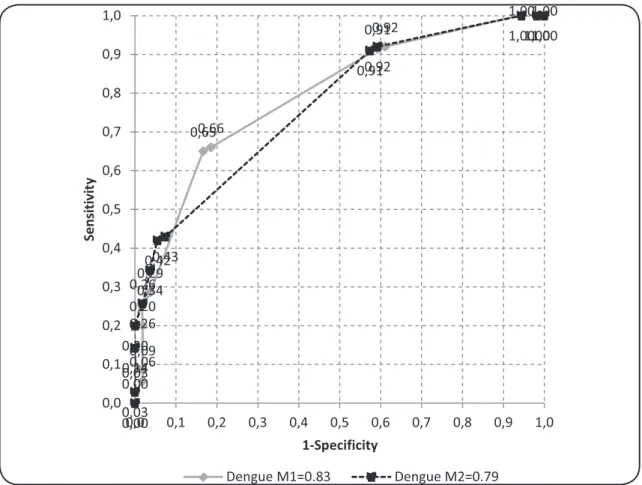
predictive capability (area under the curve [AUC] = 0.83), and thus goodness of it. The dengue-2 model demonstrated inferior conditions (AUC = 0.79), and a difference of 0.04 in relation to the dengue-1 model; however, it also presented good predictive capacity (AUC > 0.7; Figure 2).
DISCUSSION
The results indicate that the increase in the number of monthly notiications of dengue and the MID is associated with R period, veriied using data obtained for the period between March and July.
The results of the dengue-1 model suggest that R associated with increasing AT, DPT, and RH resulted in an increase in the MID, in conjunction with that reported previously7,11,21.
In contrast with previous studies, we found that WS and WD also inluence the MID11,22,23. Furthermore, a previous study showed that changes in wind pattern (magnitude, frequency, and direction) can affect the dispersion and survival of population of mosquitoes24,25. The results of the dengue-2 model suggest that WD < 140.7º (Southeastern sector) lead to an increase in a moderate MID12,24. WD also presents variations between Northeastern (90º) and Southeastern (150º), associated to local characteristics such as topography and regional atmospheric pattern. However, WS acts as inhibitory variable for MID occurrence11,12,24. The thermodynamics variables (AT, DPT and RH) boosted a moderate MID occurrence11,21.
Acknowledgments
The author thanks Coordenação de Aperfeiçoamento de Pessoal de Nível Superior
(CAPES) for the scholarship received via the National Postdoctoral Program. Conlict of interest
The author declares that there is no conlict of interest.
REFERENCES
1. Travassos da Rosa APA, Vasconcelos PFC, Travassos da Rosa JFS, editors. An overview of arbovirology in Brazil and neighbouring countries. 1st ed. Belém: Instituto Evandro Chagas; 1998. 296 p. 2. Clyde K, Kyle JL, Harris E. Recent advances in deciphering viral
and host determinants of dengue virus replication and pathogenesis. J Virol. 2006; 80(23):11418-31.
3. Ministério da Saúde. Secretária de Vigilância em Saúde. Monitoramento dos casos de dengue, febre de chikungunya e febre pelo vírus Zika até a Semana Epidemiológica 52, 2016. Boletim Epidemiológico. 2016; 47(3):1-11.
4. Ministério da Saúde. Secretária de Vigilância em Saúde. Departamento de Vigilância Epidemiológica – Sistema de Informação de Agravos de Notiicações - SINAN. Acesso em 01 julho 2016. Maceió: Secretaria Estadual de Saúde do Estado de Alagoas; 2016.
5. Pellissari BP, Aguilar AMM, Lima MM, Brito WI. Aspectos Socioambientais associados à ocorrência de dengue em um Município do Estado do Mato Grosso. Rev Epidemiol Control Infec. 2016;6(1):12-17.
6. Magalhães GB. Clima e Saúde: relações entre os elementos atmosféricos e a dengue na Região Metropolitana de Fortaleza. Tese de Mestrado. Fortaleza: Universidade Federal do Ceará, 2011. 174p.
7. Gonçalves Neto VS, Rebêlo JMM. Epidemiological characteristics of dengue in the Municipality of São Luís, Maranhão, Brazil, 1997-2002. Cad Saúde Pública. 2004;20(5):1427-31.
8. Viana DV, Ignotti E. A ocorrência da dengue e variações meteorológicas no Brasil: revisão sistemática. Rev Bras Epidemiol 2013;16(2):240-56.
9. Paixão CA. Modelo de bitstring para estudo da propagação da dengue. Tese de Doutorado. Lavras: Universidade Federal de Lavras. 2012. 303p. Disponível em: http://repositorio.ula.br/jspui/handle/1/432 10. Rocha JRR, Mariano ZF. Aspectos climáticos e ocorrência de casos
de dengue em Jataí-GO. Rev Geonorte. 2016;3(5):757-69.
11. Li TG, Yang ZC, Luo L, Di B, Wang M. dengue fever epidemiological status and relationship with meteorological variables in Guangzhou, Southern China, 2007-2012. Biomed Environ Sci. 2013;26(12):994-7. 12. Cheong YL, Burkart K, Leitão PJ, Lakes T. Assessing weather effects on dengue disease in Malaysia. Int J Environ Res Public Health. 2013;10(12):6319-34.
13. Instituto Brasileiro de Geograia e Estatística. Censo Acesso em 01 fevereiro 2016. Disponível em: http://cod.ibge.gov.br/1A0KH. 14. Lima IF. Geograia de Alagoas. 1st ed. Coleção didática do Brasil.
São Paulo: Editora do Brasil S/A, 1965. Volume 14.
15. Nimer E. Clima. In: Instituto Brasileiro de Geograia e Estatística. Geograia do Brasil: região Nordeste. 1st ed. Rio de Janeiro: Embrapa Semiárido; 1977. p. 47-84. Volume 2.
16. Ministro de Estado da Agricultura, Pecuária e Abastecimento. Instituto Nacional de Meteorologia (INMET). Seção de Armazenamento de Dados Meteorológicos (SADMET). Estação Meteorológica de Observação de Superfície Automática. Brasília: Acesso em 01 fevereiro 2016.
17. Chatield C. The Analysis of Time Series: An Introduction. 6th ed. New York: Chapman & Hall/CRC; 2004. 352p. ISBN 9781584883173.
18. Domínguez-Almendros S, Benítez-Parejo N, Gonzalez-Ramirez AR. Logistic regression models. Allergol Immunopathol. 2011;39(5):295-305.
19. Akaike H. A new look at the statistical model identiication. IEEE Trans Automat Control. 1974;19(6):716-23.
20. Park SH, Goo JM, Jo CH. Receiver Operating Characteristic (ROC) Curve: Practical Review for Reviews for Radiologists, Korean J Radiol. 2004;5(1):11-8.
21. Silva FD, dos Santos AM, Corrêa RC, Caldas AJ. Temporal relationship between rainfall, temperature and occurrence of dengue cases in São Luis, Maranhão, Brazil. Cien Saude Colet. 2016;21(2):641-6.
22. Câmara FP, Gomes AF, dos Santos GT, Câmara DCP. Clima e epidemias de dengue no Estado do Rio de Janeiro. Rev Soc Bras Med Trop. 2009;42(2):137-40.
23. Lu L, Lin H, Tian L, Yang W, Sun J, Liu Q. Time series analysis of dengue fever and weather in Guangzhou, China. BMC Public Health. 2009;9:395.
24. Heukelbach J, De Oliveira FAS, Kerr-Pontes LRS, Feldmeier H. Risk factors associated with an outbreak of Dengue fever in a favela in Fortaleza, north-east Brazil. Trop Med Int Health. 2001;6(8): 635-42.