*e-mail: [email protected]
Niobium and Niobium-iron Coatings on API 5LX 70 Steel Applied with HVOF
Cristiane de Souza Brandolt*, Jair Garcia de Souza Junior, Sandra Raquel Kunst,
Maria Rita Ortega Vega, Roberto Moreira Schroeder, Célia de Fraga Malfatti
Corrosion Research Laboratory – LAPEC, Federal University of Rio Grande do Sul – UFRGS, Avenida Bento Gonçalves, 9500, Porto Alegre, RS, Brazil
Received: September 25, 2013; Revised: April 6, 2014
The present study aimed to create and characterize niobium and niobium-iron60% coatings applied to steel API 5L X70 using the hypersonic thermal spray process (HVOF). The morphologies of the coatings were analyzed using scanning electron microscopy (SEM), energy dispersive spectroscopy (EDS), X-ray diffraction (XRD) and profilometry, while the coatings’ hardnesses was evaluated using the Vickers hardness test. The coatings’ corrosion resistance was evaluated by monitoring their open circuit potential and potentiodynamic polarization and performing electrochemical impedance spectroscopy in a 0.05 M NaCl solution. The results showed that the niobium-iron coating contained minor porosity regions, while such defects occurred over large regions of the niobium coating. In terms of corrosion resistance, the coatings obtained in this work promoted a reduction in the substrate’s corrosion rate, but the presence of discontinuities such as porosity compromised the barrier effects of these coatings.
Keywords: coatings, niobium, HVOF, API 5L X70 steel
1. Introduction
The recent discoveries of oil and gas reserves in Brazil’s pre-salt region, located in deep water, have created a challenging situation for the employment of traditional materials such as carbon steel. This highly aggressive environment makes such materials highly susceptible to problems including corrosion and erosion, among others, which can lead to premature component failure1. Therefore, the development of new materials and technologies capable of meeting the requirements for the installation of extraction systems, conditioning and transport of oil and natural gas, with high resistance to attack by aggressive substances, has become increasingly necessary. These issues have come to represent the technological bottlenecks currently encountered in the sector2,3.
Among the available alternatives for metal surface protection in aggressive environments, such as the marine environment, the thermal spray process has been widely researched and used in recent years1,2,4,5. Thermal spraying represents a range of techniques employed to obtain coatings that promote corrosion and wear resistance improvements in components6-11 at lower costs than other processes1,2. In this process, a powder material is sprayed, melted or semi-melted by heat generated in the nozzle of a spray torch5,6. After fusion, the material is projected against the surface to be coated, resulting in a layered structure consisting of flattened particles in the direction parallel to the substrate surface, containing, oxide inclusions, voids and porosity1,2.
Thermal spraying techniques are subdivided in several types based on the material to be applied to the heating source and the method of accelerating particles towards
the substrate12. Among the various methods, high-velocity oxygen-fuel (HVOF) thermal spraying stands out for its ability to operate at lower temperatures6 and the better quality of the coating obtained. In this process, a reaction occurs between a fuel introduced with oxygen into a combustion chamber. The combustion is initiated by an ignition system, and the energy released in the reaction is converted to heat and pressure that warm and boost the particles alongside the gas, forming a jet of flame6,13. The particles reach hypersonic velocities, forming a coating with extremely low porosity (typically <1%) and high adhesion force14,15.
The major advantage of thermal spraying is its versatility because ceramics, metals, intermetallics, composites and polymer coatings can be sprayed16 onto components with different geometries and sizes, and it can be applied in both factory and the field17. Moreover, when compared with other processes, thermal spraying has a lower environmental impact, lower cost and higher production rate5,8,18. In addition to providing corrosion and wear resistance, these coatings are applied on parts that require thermal19 and electrical insulation and biological compatibility9, and are used to protect pipes against corrosion and erosion in the oil and gas industry1. Sprayed coatings can also be employed for improved resistance to high temperatures20,21.
niobium decreases its hardness and tends to displace its corrosion potential values for more active potentials closer to the steel potential. Thus, when applying coatings on a steel substrate, the potential difference developed by the paired coating and substrate is decreased in the presence of surface defects, which also reduces galvanic corrosion.
In this context, the goal of this study was to create and comparatively characterize niobium and niobium-iron60% coatings applied to 5LX70 API steel substrate. The aim of this work is to develop coatings to improve the API 5LX70 steel corrosion in aggressive media and wear performances (in wear). By evaluation of the coating performance, it is possible to settle down the main parameters to adjust in the thermal spray technique aiming to corrosion and wear resistant layers in the work materials, for instance, those used in oil and gas industry.
2. Material and Methods
The substrate used in this work was API 5L X70 steel, the chemical composition of which is presented in Table 1. The material was machined from a pipe measuring 170 mm in diameter and 13 mm thick.
Niobium and iron powders were used to create the coatings. The niobium powder’s particle size had an average diameter of 37.6 µm, that of the iron powder was 54.2 µm and that of the mixture niobium-iron was 41.76 µm. A sheet of solid niobium measuring 2 mm thick was used for the electrochemical tests. Bar-shaped specimens were machined with dimensions of 120 × 20 × 9 mm, and then given a pre-treatment, prior of thermal spray process, constituted by the steps below.
• Cleaning with acetone in an ultrasonic bath for 5
minutes;
• Blastingwithwhitealuminumoxide(particlesize30/
Alundum 38 Å) at a pressure of 100 psi, distance of 100 mm and angle of 90°;
• Preheatingat120°C.
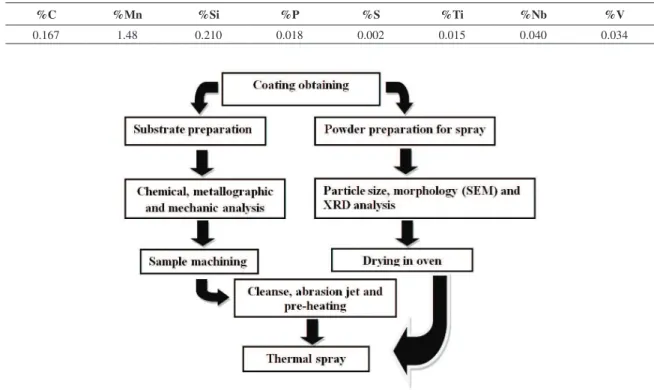
The flowchart that sumarizes the steps for obtaining the coating appears in Figure 1.
To obtain the niobium-iron mixture, the niobium and iron powders were placed in a double cone mixer at an average speed of 24 rpm for two and a half hours. After preparing the samples, the deposition of metallic niobium and the niobium-iron mixture was performed using the thermal spray process with a high-velocity oxygen-fuel flame (HVOF) and using a 2700 Sulzer Metco DJ pistol with a Sulzer Metco 9MP-DJ powder feeder.
Figure 2 shows the thermal spraying equipment used to create the coating on the steel bar surface. The parameters used to obtain the layers in this study are described in Table 2, and were determined based on Maranho’s experimental tests23toobtainainaloxygen/fuelratioof4.6, close to the propane’s maximum temperature rate.
The coating morphologies were evaluated using scanning electron microscopy (SEM) with two types of equipments: a JEOL 5800 microscope coupled with a dispersive X-ray analytical equipment (EDS), and a Noran JEOL 6060 microscope. To determine the layer thickness of the coatings, SEM micrograph analysis was carried out with Image J image analysis software. The dispersive X-ray analytical equipment was used for the chemical characterization of the coatings and obtained the coating thicknesses using the image analysis software Image J. The
Figure 1. Flowchart with the steps of coating preparation.
Table 1. Steel chemical composition.
%C %Mn %Si %P %S %Ti %Nb %V
phases present in the niobium and iron powders and in the obtained coatings were determined by X-ray diffraction (XRD) with BrukerAXS D5000 equipment. The roughness of the coated surface was characterized with a CETR contact profilometer (PRO5003D model) by applying a 15-mg load on a 15-mM surface for 15 micrometers. Vickers microhardness tests were conducted on both the steel and solid niobium with a load of 0.5 kg and an indentation time of 15 seconds. The indentations in the coatings were made only on the cross-sectional layer, on which only random hardness differences along the profile were observed with a constant tendency.
The coatings’ corrosion performances were evaluated by open circuit potential (EOCP) monitoring during the first hour of solution immersion, followed by potentiodynamic polarization curves and electrochemical impedance spectroscopy (EIS) measurements. All corrosion tests were performed in a 0.05 M NaCl solution. A three-electrode cell was used to perform these tests, with a platinum wire as the counter electrode and a saturated calomel electrode (SCE) as the reference electrode (Figure 3). The area of the working electrode measured 0.626 cm2. The polarization curves were run (or collected) at a scan rate of 1 mVs–1. The corrosion current densities and polarization resistance (Rp) values were obtained by Tafel extrapolation using Corrview
software, and are shown in Table 3. Anodic Tafel linear extrapolation was obtained by considering a linear section
of approximately 30 mV over the corrosion potential, while cathodic Tafel linear extrapolation was obtained from 30 mV below Ecorr. The samples were monitored for 96 hours before taking the EIS measurements, and the amplitude of the EIS perturbation signal was a sinusoidal 10-mV (rms) perturbation with a frequency ranging from 100 kHz to 10 mHz, with 10 points per frequency decade. The tests were run using a Solartron model 1255 frequency response analyzer and a PAR273 potentiostat.
3. Results and Discussion
3.1.
Scanning electron microscopy
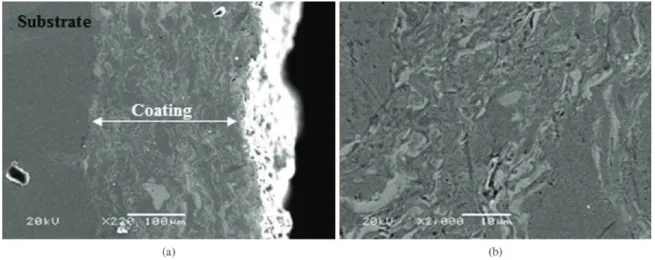
Figure 4a shows a cross section of the steel coated with niobium. The average thickness of the niobium coating was 267 µm, with a standard deviation of 31.9 µm. The figure shows that the coating had some porous regions, concentrated near the surface of the steel, surrounded by a more compact “matrix”. Figure 4b illustrates the compact region from Figure 4a at greater magnification. The compact region was formed by plates more or less parallel to the material surface, with small porous regions. In Figure 4c further magnifies the same structure, making it possible to observe a cluster of unmelted particles and voids between these particles that indicate an inefficient metallurgical and plastic union. During the impact of molten or semi-molten powder particles, they deform the surface, promoting the coverage of surface irregularities by melting over each other, releasing heat to the substrate, and forming a lamellar structure during the coating’s solidification process. This process is rapid and cannot occur perfectly, giving rise to the formation of porous regions24. Generally, HVOF-obtained
Table 2. Parameters used in thermal spray coatings by HVOF.
Oxygenlow(l/min) 252
Propanelowrate(l/min) 68
Compressedairlow(l/min) 302.4
Nitrogenlow-carriergas(l/min) 65
Oxygen pressure (bar) 12.3
Propane pressure (bar) 8
Compressed air pressure (bar) 8
Nitrogen pressure - gas drag (bar) 11.5
Distance from sprinkler (cm) 20
Depositionrate(g/min) 38
GunSpeed(m/s) 0.2
Number of layers 7
Figure 2. Equipment by HVOF thermal spraying.
Figure 3. Conventional cell used for electrochemical tests.
Table 3. Values obtained by Tafel linear extrapolation for the experimental polarization curves for the systems.
System icorr (A/cm
2) E
corr (mV) Rp (Ω/cm 2)
Steel 8.31 × 10⁻⁶ –646 3.14 × 10³
Nb plate 2.86 × 10⁻⁸ –261 9.11 × 10⁵
Nb-coated steel 9.80 × 10⁻⁶ –692 2.66 × 10³
layers use to be dense. Anyway, porosity is common even in coatings with excellent corrosion performance, as it is observed by Wang25 .
Figures 5a and 5b show a cross section of the steel coated with niobium-iron. The average thickness of this coating was 294 µm, with a standard deviation of 17.7 µm, and it had a more pronounced lamellar structure and defects in the porous regions. The absence of apparent porosity in the niobium-iron coating, and the presence of such defects in the pure niobium coating appeared to be associated with a higher melting temperature in the niobium particles due to the lower melting temperature of iron (Tm = 1538 °C) compared to that of niobium (Tm = 2469 °C), which promotes a better metallurgical union and agglomeration between the melted particles. Another factor that appeared to be related to porosity and its higher concentration close to the steel surface was the low temperature at which the substrate was preheated prior to the niobium coating application. The results obtained by Mellali26 have shown that the initial deposited layers are more influenced by preheating because the contact occurs directly between the substrate and the deposited material in this case.
By examining the interface between the coating and the steel, it was concluded that the material deposited on
the steel surface adequately filled the irregularities etched for both coatings. No voids were observed between the substrate and coating and, in the case of niobium (Figure 4), the porosity hardly approached the interface.
The top view of the sample surface covered with niobium is shown in Figure 6a. Note that the surface coating was formed by agglomerated particles, resulting in a very irregular surface. It is also possible to observe microcracks in the less rough parts and microporosity. This surface structure indicated a lack of sufficient particle compaction and agglomeration during the last passes because they did not receive other passes above them, meaning this level received more material and was subjected to a differential temperature and pressure compared to the coating’s innermost region. In Figure 6b, it can be observed that the surface appearance of the niobium-iron coating has a similar structure to that of the niobium coating, but it also contains elongated agglomerates, and the surface has more compact appearance with fewer cracks.
3.2.
Chemical mapping
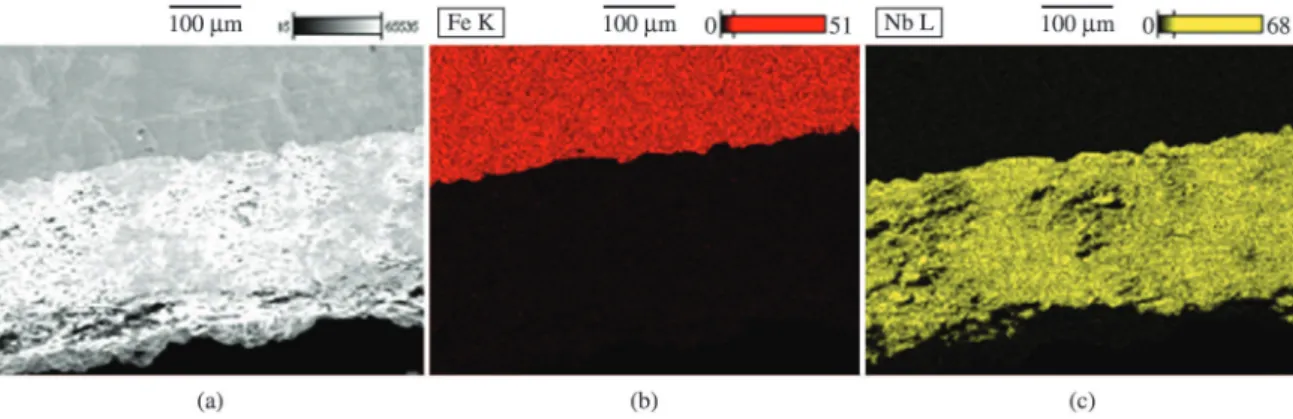
Figure 7 shows a cross section of the steel coated with niobium and created with secondary electrons, together with mappings of the elements Fe and Nb. There was no
Figure 4. (a) Cross section of steel coated with niobium, where two distinct regions are observed in the coating: a porous and a compact ones. (b) Major magnification of lamellar and compact structure of the coating. In (c) more detail view of the porous particle structure of the niobium coating. SEM.
dilution or diffusion zone between the steel substrate and the niobium coating, and the layer showed discontinuities represented by dark areas parallel to the surface, where the niobium was not detected in the mapping. These regions probably corresponded to coating porosities.
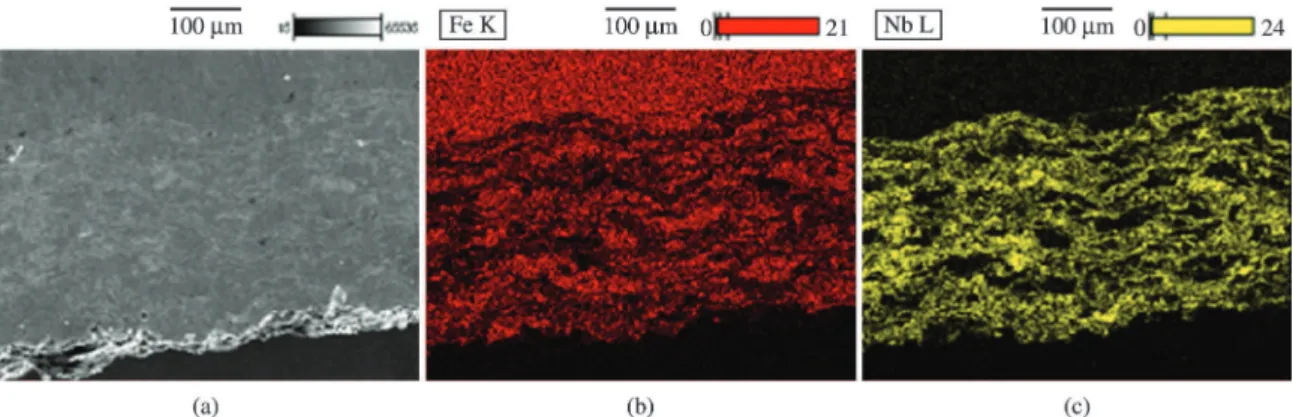
Figure 8 shows a cross section of the steel coated with niobium-iron and created with secondary electrons, along with mappings of the elements Fe and Nb, in which clear lamellae rich in Nb and dark lamellae rich in Fe can be identified.
Some authors27 have coated AISI 1020 steel with niobium-iron60% and niobium-iron40% alloys and found that, apart from ferrite, the Nb-rich ε phase (Fe
2Nb) made up the greatest fraction in the niobium-iron40% alloy, which is in accordance with the Fe-Nb equilibrium diagram. However, the X-ray diffraction of the niobium-iron60% coating performed in this work and shown in Figure 9b did not indicate the formation of this phase, possibly due to the fact that the process used here was different from that used by d’Oliveira et al.27. The arc-transferred plasma process used by d’Oliveira is a combination of thermal spraying and welding that creates a full molten puddle and a dilution zone
at the interface, unlike the high-velocity oxygen-fuel process (HVOF) used in this work. The HVOF process causes only rapid partial melting. If the niobium and iron powders are not perfectly mixed at the microscopic level, the formation of micro-regions rich in one element can occur, without metallurgical conditions conducive to the formation of new phases, due to the short time available for the thermal spraying process. Thus, it is possible to form metastable solid solutions and also cement the less molten regions to more completely molten regions.
3.3.
X-ray diffraction
Figures 9a and 9b show the diffractograms of the niobium and niobium-iron60 coatings, respectively. In addition to metallic niobium (Nb) in the first figure and metallic niobium and iron (Fe) in the second, the presence of NbO (niobium monoxide) and NbO2 (niobium dioxide) were identified in both coatings. This oxide formation in the thermally sprayed process can significantly affect the properties and performance of these layers. The oxides formed during the spraying modify the properties of the
Figure 6. (a) Niobium coating surface with arrows indicating cracks and circles identifying pores. (b) Niobium-iron60% surface coating. SEM.
deposited material and enhance the difference between the metal substrate and coating.
With respect to mechanical properties, these oxides normally significantly increase a layer’s hardness and wear resistance, but also decrease its ductility, toughness and impact resistance. In some industrial environments, the material’s corrosion resistance can be improved by the formation of insoluble metal oxides28.
3.4.
Profilometry: Topography and roughness
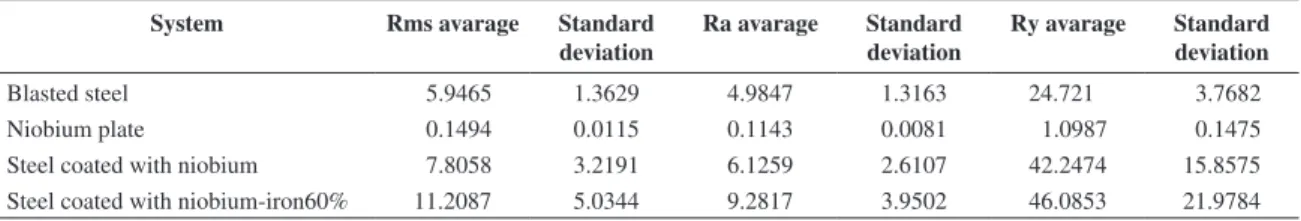
Figure 10 shows a three-dimensional image of the sample topography obtained by contact profilometry. It was not possible to obtain an image of the pure niobium coating, but the roughness values of the two coatings were not very different. Table 4 shows the values for average roughness (Ra), mean square roughness (Rms or Rq) and maximum roughness or peak-to-peak (Ry). The latter is the more important quantity for evaluating the anchorage possibility of a deposited layer because, unlike the Rms and Ra roughnesses, the Ry roughness evaluates both thepeaks and valleys, being the distance between the highest peak and the lowest valley within the analyzed sample area.
As shown in Table 4, the steel surface began with a Ry roughness of 0.34 µm, which changed to 24.72 µm after being subjected to blasting. However, the N 2568 standard29 states that a blasted substrate surface should have a Ry roughness between 75 and 120 µm. After the coating was applied, the Ry surface roughness increased from 25 µm, reaching 42 µm on the niobium-coated steel and 46.08 µm on the niobium-iron coated steel, while the solid niobium plate had a 1.1 µm Ry roughness (Table 4). The coatings showed no significant differences in roughness from one another. However, the difference in roughness caused to the substrate by applying the coating and the coatings’ possible effects in various applications required consideration.
In anticorrosive coatings, the increase in roughness can lead to a corresponding increase in corrosion rate due to the surface area increase, probable local acidification and dissolution caused by the retention of electrolytes on irregularities. Furthermore, it is preferred that engineering
Figure 8. Steel’s cross section coated with niobium-iron60%: (a) image obtained by secondary electrons, (b) image mapping Fe element, (c) image mapping Nb element.
components have the best possible surface finish if low friction and wear are expected. However, there are cases in mechanical systems, such as brakes and clutches, where friction and good wear resistance are essential, and more efficient friction systems have therefore become a subject of study30. The production of thermal spray coatings have been widely used to increase wear resistance and fatigue due to hardness increases, and these coatings may also see an increase in their application as anti-corrosive components7,8.
In addition, surface treatments have been used to modify the thermal spray coating roughness obtained (coatings roughness), like shot penning, that have showed improvement in the properties, due to the roughness control31.
3.5.
Microhardness
The niobium coating’s hardness was very high, Table 5 being two times greater than the steel substrate’s hardness and six times more than the niobium solid plate’s hardness. However, the niobium-iron coating showed lower hardness values compared to the niobium coating, but they were still nearly twice the substrate’s hardness. This difference between the niobium coating and solid metallic niobium plate was probably related to the microstructure and presence of oxides formed in the layer during the coating
application, as shown by X-ray diffraction testing (Figure 9). Such results may have been associated with a significant amount of oxides in the coating.
Remarkably, the greater microhardness dispersion in the niobium coating had an average of 625 HV, with a 108 HV standard deviation, compared to the solid niobium plate. This difference was due to the influence of pores and voids present around the microhardness indentation, leading to a greater dispersion of values. The same table shows that the average hardness of the niobium-iron coating as 421 HV, with a standard deviation of 55 HV.
3.6.
Electrochemical characterization
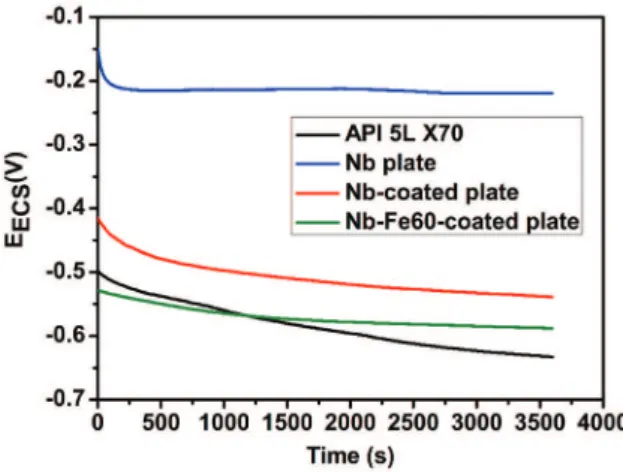
3.6.1. Open Circuit Potential (OCP)
Open circuit potential measurements are given in Figure 11. The OCP of the niobium-iron coated samples was very close to that of the non-coated steel OCP values. Nonetheless, the niobium-coated substrate showed OCP values shifted towards the less active potentials related to the non-coated steel. In any case, those niobium-coated sample potentials were closer to the non-coated steel potentials than the solid niobium plate potential, meaning that, as a first approach, the niobium coating appeared not to have formed a very efficient barrier between the substrate and the environment32.
Table 5. Microhardness Vickers (HV) values of the studied systems.
API 5L X70 steel Niobium plate Niobium coating Niobium-iron60% coating
Microhardness Vickers (HV) 247 97 625 421
Standard deviation (HV) 9 5 108 55
Figure 10. Tridimensional images of surfaces obtained from samples prefilometry: (a) blasted steel, (b) Niobium-iron60% coating and
(c) niobium plate.
Table 4. Roughness (µm) of the studied systems.
System Rms avarage Standard
deviation
Ra avarage Standard deviation
Ry avarage Standard deviation
Blasted steel 5.9465 1.3629 4.9847 1.3163 24.721 3.7682
Niobium plate 0.1494 0.0115 0.1143 0.0081 1.0987 0.1475
Steel coated with niobium 7.8058 3.2191 6.1259 2.6107 42.2474 15.8575
Keeping in mind that the majority of coatings have experienced failure and high imperfection ratios due to the method of their application or formed during their use, a smaller potential difference between the coating and the substrate is required to avoid or minimize galvanic corrosion and the formation of local cells with strong localized substrate corrosion. Thus, the potential analysis had to be performed with polarization curves.
3.6.2. Polarization curves
Figure 12 shows the polarization curves for the studied systems and their corrosion potential. The results obtained from the polarization test and through Tafel linear extrapolation (Table 3) showed that neither niobium coating modified the corrosion current density or polarization resistance values in a relevant way. Rather, they maintained the same order of magnitude as the uncoated steel, which was close to 100 times smaller and 100 times greater than the values obtained for the solid niobium plate. The curve profile also required consideration. The solid niobium in the niobium-coated sample showed anodic curves with a passivation region, but with different potential value intervals for the two systems. The anodic curves for the steel and niobium-iron coated samples showed almost the
same potential current slope33. While the niobium-coated sample and the niobium solid plate had identical profiles for the cathodic curves, this same behavior was observed in the cathodic curves for the non-coated steel and the Nb-Fe coating. This behavior indicated that adding Nb-Fe to Nb made the Nb-Fe electrochemical behavior closer to that of the steel substrate sample.
The results obtained from the polarization test (Figure 12) showed that niobium coating passivation took place, but the steel substrate was nonetheless corroded because of the presence of discontinuities and porosities in the coating, making the total current density developed by the system reach higher values.
The presence of discontinuities seemed to be a determining factor regarding the poor corrosion performance of the coatings studied in this work. Niobium coatings on API 5LX70 were also studied by Matos34, but with plasma thermal spray process. In Matos work, OCP and polarization curves corresponding to the niobium coating also presented porosity that harmed the coating barrier effect. Hence, the polarization curves results of niobium coating were worse than that of pure niobium.
Other studies also revealed the influence of the coating quality in the corrosion performance. Kudora35 compares the performance of nickel-based alloy coatings and stainless steel coatings. The best performance of the nickel-based alloy coatings is associated to the better coating compaction, better adherence and less amount of defects.
Another consideration was that the calculated area of the samples could have been markedly smaller than the real effective area. In other words, the effective contact area could have been considerably higher than the calculated exposed area due to the coated samples’ high roughnesses (Figure 12 and Table 3). If the real area had been considered, it may have shifted the curves towards lower current density values. In addition, the high roughness enhanced the electrolyte acidification due to the formation of stagnant areas, inducing local electrochemical cell formation.
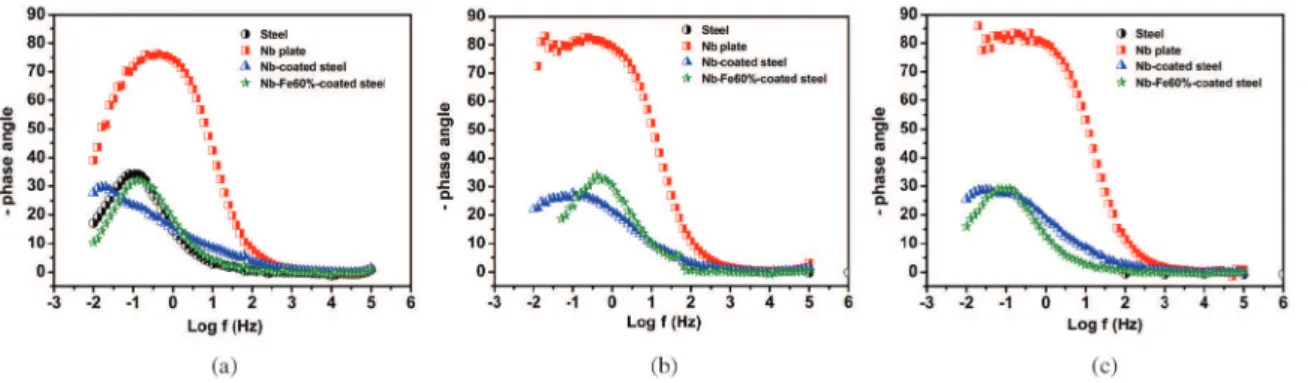
3.6.3. Electrochemical Impedance Spectroscopy (EIS)
Figure 13 shows the Nyquist plot obtained from the electrochemical impedance test. Figures 14 and 15 show the corresponding Bode plots. The diagrams in Figures 13 and 14 suggested that the niobium and niobium-iron coated samples reached similar impedance values compared to the uncoated steel, which stayed well below the results for the solid niobium plate. This behavior was even more apparent when evaluating the impedance moduli shown in Figure 15, which also indicated that the systems stabilized after 1 hour of immersion. In other words, no system showed noticeable variation in its impedance modulus with immersion time until 48 hours after this initial 1-hour period.
The phenomenon observed in Figure 14 for the solid niobium plate may have been associated with niobium passivation. The niobium coating should have experienced passivation phenomenon as well, but the steel appeared to be corroded due to possible coating failures despite the passive layer, diminishing its impedance moduli values when compared with those of solid niobium, as seen in Figure 15.
Figure 11. OCP curves for the studied systems.
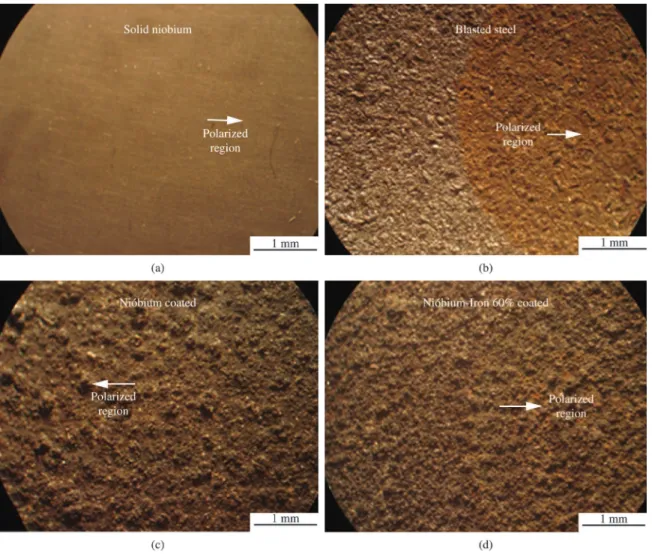
Figure 16 shows the images obtained from low-magnification microscopy of the samples after the electrochemical polarization test in the boundary between the polarized area came in contact with the electrolyte in the non-tested region. The solid niobium plate did not suffer from any perceptible modification during polarization, but the blasted steel contained a polarized area showing signs of intense corrosion. The niobium coating did not show any important surface modification in its polarized region, while niobium-iron coating experienced a small color change, tending towards a hue typical of iron corrosion products and indicating this element’s corrosion.
The main factor responsible for the niobium coating’s lower performance compared to the solid niobium
plate appeared to be associated with the porosity and discontinuities on the layer of this coating.
Future work to obtain better performance of the coatings and with farther research purposes, the following observations must be taken into account:
Adjust of thermal spray parameters aiming to better constituted layers with less porosity; Application of sealants onto the coatings in order to fill up the pores and, in consequence, to improve the barrier effect; In addition, further work to use and test of metallic materials different to niobium as thermal spray obtained coatings, with properties that may produce reduction of defects and improvement of barrier effect.
Figure 13. Nyquist Diagram for all sistems for different imersion (a) 1 hour, (b) 24 hours and (c) 48 hours.
Figure 14. Theta angles Bode plotes for each (e) studied system in different immersion times: a) 1 hour, b) 24 hours, c) 48 hours.
4. Conclusion
The results obtained from the SEM images in this study showed that the niobium-iron coating lacked visible porosity regions for the magnification used, but their presence was observed in the niobium coating at the same magnification. This difference was explained by better particle fusion in the niobium-iron mixture, compared to the niobium coating. The latter had a higher hardness value (625 HV) than the niobium-iron coating (421 HV). The hardness of both coatings was higher than that of the solid niobium plate and the steel substrate due to the presence of oxides in the coating, as revealed by X-ray diffraction.
The EDS results did not indicate the presence of a dilution region between the both coatings and the substrate, and the niobium-iron phase foreseen in the equilibrium diagram did not occur because the niobium-iron coating was formed by alternating iron and niobium layers, probably due to the relatively low temperature used in the HVOF process.
Figure 16. Image obtained with a low magnification microscopy for the samples in the boundary region between the polarized area in
contact with the electrolyte and the non-tested area.
The Ry roughness of the alumina-blasted steel remained outside the interval stated by the N-2568 standard, with lower measured values.
In terms of corrosion resistance, the coatings created in this study reduced the substrate’s corrosion, but in a non-significant way due to the presence of discontinuities that compromised the coatings’ barrier effects. The results obtained using potentiodynamic polarization and EIS also showed the presence of discontinuities in the niobium and niobium-iron coatings.
Acknowledgements
References
1. El Rayesl MM, Abdo HS and Khalil KA. Erosion-corrosion of cermet coating. International Journal of Electrochemical Science. 2013; 8:1117-1137.
2. Sá Brito VRS, Bastos IN and Costa HRM. Corrosion resistance and characterization of metallic coatings deposited by thermal spray on carbon steel. Materials Design. 2012; 41:282-288. http://dx.doi.org/10.1016/j.matdes.2012.05.008
3. Furtado AT. A trajetória tecnológica da petrobrás na produção offshore. Espacios.1996;17(3).Availablefrom:<http://www. revistaespacios.com/a96v17n03/32961703.html>. Access in:20/08/2010.
4. Rodriguez RMHP, Paredes RSC, Wido SH and Calixto A. Comparison of aluminum coatings deposited by flame spray and by arc spray. Surface and Coatings Technology. 2007; 202:172-179.http://dx.doi.org/10.1016/j.surfcoat.2007.05.067
5. Guilemany JM, Miguel JM, Armada S, Vizcaino S and Climent F. Use of Scanning white light interferometry in the characterization of wear mechanisms in thermal-sprayed coatings. Materials Characterization.2001;47:307-314.http:// dx.doi.org/10.1016/S1044-5803(02)00180-8
6. Chaliampalias D, Vourlias G, Pavlidou E, Stergioudis G, Skolianos S and Chrissafis K. High Temperature oxidation and corrosion in marine environments of thermal spray deposited coatings. Applied Surface Science. 2008; 255:3104-3111. http://dx.doi.org/10.1016/j.apsusc.2008.08.101
7. Verdian MM, Raeissi K and Salehi M. Characterization
and electrochemical properties of Ni(Si)/Ni5Si2 multiphase coatings prepared by HVOF Spraying. Applied Surface Science. 2012; 261:493-498. http://dx.doi.org/10.1016/j.
apsusc.2012.08.043
8. Lima CC and Trevisan R. Aspersão térmica: fundamentos e aplicações. São Paulo: Artliber; 2002.
9. Thakur L, Arora N, Jayaganthan R and Sood R. An investigation on erosion behavior of HVOF sprayed WC-CoCr coatings.
Applied Surface Science. 2011; 258:1225-1234.
10. Bakare MS, Voisey KT, Roe MJ and Mccartney DG. X-ray photoelectron spectroscopy study of the passive films formed on thermally sprayed and wrought Inconel 625. Applied Surface Science. 2010; 257:786-794. http://dx.doi.org/10.1016/j.
apsusc.2011.09.079
11. Wu YS, Qiu WQ, Yu HY, Zhong XC, Liu ZW, Zeng DC et al. Cycle oxidation behavior of nanostructured Ni60-TiB2composite coating sprayed by HVOF technique. Applied Surface Science. 2011; 257:10224-10232. http://dx.doi. org/10.1016/j.apsusc.2010.07.066
12. Marques PV. Aspersão térmica. Belo Horizonte: Infosolda, Universidade Federal de Minas Gerais; 2003. http://dx.doi. org/10.1016/j.apsusc.2011.07.026
13. Stokes J. The Theory and Application of the HVOF (High Velocity Oxy-Fuel).Available from: <http://webpages.dcu. ie/~stokesjt/ThermalSpraying/Book/HVOFThermalSpraying. htm>.Accessin:01/09/2011.
14. Souza RC, Voorwald HJC and Cioffi MOH. Fatigue strength of HVOF sprayed Cr3C2-25NiCr and WC-10Ni on AISI 4340 steel. Surface and Coatings Technology. 2008; 203:191-198. http://dx.doi.org/10.1016/j.surfcoat.2008.07.038
15. Margineana G and Utu D. Cyclic oxidation behaviour of different treated CoNiCrAlY coatings. Applied Surface Science. 2012; 258:8307- 8311. http://dx.doi.org/10.1016/j.
apsusc.2012.05.050
16. Voorwald HJC, Souza RC, Pigatin WL and Cioffi MOH. Evaluation of WC-17Co and WC-10Co-4Cr thermal
spray coatings by HVOF on the fatigue and corrosion strength of AISI 4340 steel. Surface and Coatings Technology. 2005; 190:155-164. http://dx.doi.org/10.1016/j.
surfcoat.2004.08.181
17. Vargas F, Latorre G and Uribei I. Behavior of thermal spray coatings against hydrogen attack. Ciencia, Tecnología y Futuro. 2003; 2(4):65-73.
18. Davis JR. Handbook of thermal spray technology. Ohio: ASM
International; 2004.
19. Morsi1 MS, El Gwad SAA, Shoeib MA and Ahmed KF. Effect of air plasma sprays parameters on coating performance in zirconia-based thermal barrier coatings. International Journal of Electrochemical Science. 2012; 7:2811-2831.
20. Javadi MM, Edris H and Salehi M. Plasma sprayed NiAl intermetallic coating produced with mechanically alloyed powder. Journal of Materials Science and Technology. 2011; 27(9):816-820. http://dx.doi.org/10.1016/
S1005-0302(11)60148-5
21. Ma C, Li H, Wu H, Fu Q, Sun C, Shi X, et al. Mullite oxidation
resistantcoatingforSiC-coatedcarbon/carboncompositesby
supersonic plasma spraying. Journal of Materials Science and Technology. 2013; 29(1):29-33. http://dx.doi.org/10.1016/j.
jmst.2012.11.001
22. Graham RA and Sutherlin RC. Niobium and niobium alloys in corrosive applications.Availablefrom:<http://www.cbmm. com.br/portug/sources/techlib/science_techno/table_content/ sub_3/images/pdfs/024.pdf>.Accessin:02/09/2013.
23. Maranho O. Aspersão térmica de ferro fundido branco multicomponente. [Thesis]. São Paulo: Universidade de São Paulo; 2006.
24. Marques PV. Aspersão térmica. Belo Horizonte: Universidade
Federal de Minas Gerais; 2003.
25. Wang S, Cheng J, Yi S and Ke L. Corrosion resistance of Fe-based amorphous metallic matrix coating fabricated by HVOF thermal spraying. Transactions of Nonferrous Metals Society of China,2014;24:146-151.http://dx.doi.org/10.1016/
S1003-6326(14)63040-5
26. Mellali M, Fauchais P and Grimaud A. Influence of substrate
roughnessandtemperatureontheadhesion/cohesionofalumina
coatings. Surface and Coatings Technology. 1996; 81:275-286.
http://dx.doi.org/10.1016/0257-8972(95)02540-5
27. D’Oliveira ASC, Chiquitto PR and Miccoli W. Iron-niobium intermetallics processing by plasma transferred arc. Advanced Engineering Materials. 2006; 8(7):625-628. http://dx.doi. org/10.1002/adem.200600056
28. Rodriguez ORMH. Formação de óxidos nos revestimentos de alumínio depositados por aspersão térmica. [Thesis]. Cuitiba:
Universidade Federal do Paraná; 2003.
29. Petrobras. Norma Petrobras N-2568: revestimentos
anticorrosivos aplicados por aspersão térmica. Petrobras; 2004. 30. Kim SS, Hwang HJ, Shin MW and Jang H. Friction and
vibration of automotive brake pads containing different abrasive particles. Wear.2011;271:1194-1202.http://dx.doi. org/10.1016/j.wear.2011.05.037
31. Ni L, Wu Z and Zhou C. Effects of surface modification on isothermal oxidation behavior of HVOF-sprayed NiCrAlY coatings. Materials International. 2011; 21:173-179. 32. Fenker M, Kappl H, Carvalho P and Vaz F. Thermal
stability, mechanical and corrosion behaviour of niobium-based coatings in the ternary system Nb-O-N. Thin Solid Films. 2011; 519:2457-2463. http://dx.doi.org/10.1016/j.
33. Hamdy AS, El-Shenawy E and El-Bitar T. Electrochemical impedance spectroscopy study of the corrosion behavior of some niobium bearing stainless steels in 3.5% NaCl. International Journal of Electrochemical Science. 2006; 1:171-180.
34. Matos JF, Motta FP, Rieder ES, Célia F and Malfatti CF. Caracterización de Revestimientos de Niobio formados por Aspersión Térmica a Plasma sobre Acero API 5l X65.
Información Tecnológica. 2012; 23(4):97-104. http://dx.doi. org/10.4067/S0718-07642012000400012
35. Kudora S, Fukuchima T, Sasaki M and Kodama T. Microestructure and corrosion resistance of HVOF sprayed 316L stainless steel and Hasteloy C Coating.