*e-mail: [email protected]
Materials Produced From Plant Biomass. Part II: Evaluation of
Crystallinity and Degradation Kinetics of Cellulose
Matheus Polettoa,b*, Vinícios Pistorc, Ruth Marlene Campomanes Santanaa, Ademir José Zatterab
aEngineering School, Federal University of Rio Grande do Sul – UFRGS, Porto Alegre, RS, Brazil bLaboratory of Polymers – LPOL, Center of Exact Sciences and Technology – CCET,
Caxias do Sul University – UCS, Caxias do Sul, RS, Brazil
cChemical Institute, Federal University of Rio Grande do Sul – UFRGS, Porto Alegre, RS, Brazil
Received: December 9, 2011; Revised: February 26, 2012
In this study Eucalyptus grandis (CEG) and Pinus taeda (CPT) cellulose fibers obtained from kraft
and sulfite pulping process, respectively, were characterized using Fourier transform infrared (FTIR) spectroscopy and thermogravimetry (TGA). The degradation kinetic parameters were determined by TGA using Coats and Redfern method. FTIR results showed that CPT presented a more ordered structure with higher crystallinity than CEG. Thermogravimetric results showed that CPT had a higher thermal stability than CEG. The kinetic results revel that for CEG the degradation mechanism occurs mainly by random nucleation, although phase boundary controlled reactions also occurs while for CPT the degradation process is more related with phase boundary controlled reactions. Results demonstrated that differences between thermal stability and degradation mechanisms might be associated with differences in the cellulose crystalline structure probably caused by different pulping processes used for obtaining the cellulose fibers.
Keywords: Eucalyptus grandis, Pinus taeda, cellulose, crystallinity, FTIR spectroscopy, thermal degradation
1. Introduction
Cellulose fibers are extensively used to reinforce polymeric composite materials1-4. The considerable interest
in these fibers is due to their biodegradability, renewability, low density and mechanical properties comparable to those inorganic fibers5. Cellulose is a natural polymer consisting
of D-anhydroglucose (C6H11O5) repeating units joined by 1.4-β-D-glycosidic linkages at C1 and C4 position6.
Each repeating unit contains three hydroxyl groups. These hydroxyl groups and their ability to hydrogen bond play a major role in directing the crystalline packing and also govern the physical properties of cellulose6. Solid cellulose
forms a microcrystalline structure with regions of highly order i.e. crystalline regions and low order regions i.e. amorphous regions.
In native cellulose, the crystalline regions are cellulose I, which consists of two allomorphous phases. The cellulose Iβ, characterized by a monoclinic unit cell with two polymer chains in a parallel arrangement, and cellulose Iα, with a shift of the polymer chains along the chain axis, resulting in a triclinic unit cell7,8. The relative amounts of phases Iα
and Iβ depend on the origin and the chemical treatment of the cellulose.
Changes in cellulose fibers and their aggregates occurring during pulping process and have impact on the fiber properties and crystallinity that are important factors when cellulose was used in composite formulations. Hult et al.9
investigated the hierarchic organization of cellulose
microfibrils in kraft and sulfite pulp fibers and showed that the kraft fibers exhibit higher ordered cellulose regions and more aggregated fibrils in contrast to the sulfite fibers. This may contribute to higher crystallinity in kraft fibers. However, pulping conditions as cooking temperature may influence on cellulose properties. The increase in cooking temperature during pulping process can promote more chain scission reactions increasing the amorphous character of the cellulose, which reduce the total amount of cellulose crystalline regions9,23.
Cellulose crystallinity is one of the most important crystalline structure parameters in cellulose fibers10. The
thermal stability of cellulose was found to depend mainly on its crystallinity11,12. Thus, cellulose crystallinity and
hydrogen bond between cellulose chains play an important role in the mechanical and thermal properties of composite materials reinforced with cellulose fibers1,13. Several
techniques as X-ray diffraction and FTIR spectroscopy were used to evaluate the wood and cellulose crystallinity5,7,8,9,10,12.
However, FTIR spectroscopy has been used as a simple technique for obtaining rapid information about the structure of cellulose and chemical changes taking place in cellulose due to various treatments10,21,22,25-27.
agent in composite materials. The aim of this study was to investigate the differences between two cellulose samples resulting from two different pulping processes and evaluate how these differences influence the thermal properties and decomposition kinetics of the cellulose fibers analyzed.
2. Material and Methods
2.1.
Materials
Bleached sulfite cellulose fibers from Pinus taeda (CPT)
were supplied by Cambará S.A. (Cambará do Sul, Brazil) obtained at cooking temperature of 140 °C and bleaching with hydrogen peroxide. Bleached kraft cellulose fibers from
Eucalyptus grandis (CEG)were supplied by CMPC S.A.
(Guaíba, Brazil), obtained at cooking temperature of 155 °C, bleaching with hydrogen peroxide. The samples were dried at 70 °C for 24 hours in a vacuum oven before the tests. The average fiber particle length for CTP and CEG is around 150 µm.
2.2.
Fourier transform infrared (ftir)
spectroscopy
Fourier transform infrared spectroscopy spectra were obtained using a spectrometer Nicolet IS10- Thermo Scientific. Samples of the finely divided celluloses (5 mg) were dispersed in a matrix of KBr (100 mg) followed by compression to form pellets. The sample collection
was obtained using 32 scans, from 4000 to 400 cm–1,
at a resolution of 4 cm–1. Care was taken to ensure all samples
remained dry during sample preparation and FTIR analysis.
2.3.
Thermogravimetric analysis (TGA)
Thermogravimetric analysis (TGA50-Shimadzu) was carried out under N2 atmosphere, from 25 up to 610 °C. Approximately 10 mg of each sample was used. The analysis was carried out at four different heating rates (5, 10, 20 and 40 °C/min). The results obtained were used to calculate the kinetics parameters.
2.4.
Theoretical consideration
2.4.1. Coats and redfern method
The conversion rate (α) is defined according to
Equation (1)12,14,15 as:
0 0 − α = − i f m m
m m (1)
where m0, mfand mi are the initial and final weights of the
sample and its weight at temperature (T), respectively. For determining the degradation kinetic mechanism, the reactions are considered irreversible and the reaction rate is both dependent of the activation energy and reaction order16. These parameters can be estimated by combining
the Arrhenius equation with non-isothermal experiments using the relationship described in Equation (2):
( )
expα= α −
a
d f A E
RT
dt (2)
where f(α), A, Ea, R and T are the reaction model,
pre-exponential factor, activation energy, universal gas constant (8.314 J.mol–1 K) and temperature (in Kelvin),
respectively. The Coats and Redfern method17 is not based on
derivates of dα/dt. However, in the non-isothermal method the temperature increases linearly, the time (t) variable is
eliminated and the Equation (2) can be rewritten as18:
( )
exp exp − α = × −
α β a a E A RT E d dT f RT (3)
where, β is the heating rate. As the term exp(-Ea/RT) does not
have exact solution the Taylor expansion is used17,18. After
integration of Equation (3) the Equation (4)can be obtained:
( ) ( ) ( ) 0 2 0 exp 2
0 1 exp
∞
−
α = α − = − −
α β
∫ T a a a a T E
A RT R
E
d RT
g g T
f E E RT (4)
Considering the possible degradation mechanisms in solid state reactions, the solution for Coats and Redfern Equation can be obtained replacing the function g(α) by
the mechanisms described in Table 1[16,18]. When the values
of n were different from one, the method can be described
by Equation (5) and when the values of n were equal to one
the Equation (4) is summarized by Equation (6)17:
(
)
(
)
1
2
1 1 2
log log 1 1
2.3 1 n a a a E AR RT n
E E RT
T n
−
− − α
= − − ≠
− β
(5)
(
)
2
log 1 2
log log 1 1
2.3 a a a E AR RT n
E E RT
T
− − α= − − =
β
(6)
Therefore, to evaluate which degradation mechanism is closer to the solid state reaction under study, it is possible to replace the values of the functions showed in Table 1 by isolating the term on the left side of Equation (5) or Equation (6) as a function of inverse temperature (1/T).
The plot of
(
)
(
)
1 2 1 1 log 1 − − − α
−
n
T n
against 1/T should result
in a straight line with a slope to (-Ea/2.3R). In fact, the
calculations have to be performed using several values of n in order to retain the value leading to the best linear
relationship.
3. Results and Discussions
3.1.
Fourier transform infrared (ftir)
spectroscopy
FTIR spectroscopy has been used as a simple technique for obtaining rapid information about the chemical structure and crystallinity of celluloses samples5,19. Contrary to
conventional chemical analysis, this method requires small sample sizes, short analysis time besides being non-destructive20.
Because of their complexity, the spectra were separated into two regions, namely: the OH and CH stretching
vibrations in the 4000-2700 cm–1 region, showed in
a strong broad band in the region of 3700-3000 cm–1 which is
assigned to different OH stretching modes and another band in the region of 3000-2800 cm–1 is ascribed to the stretching
of asymmetric and symmetric methyl and methylene CH cellulose groups19. The band at around 3360 cm–1 related
with OH stretching modes is more prominent for CPT than for CEG. This is probably due to a larger number of hydroxyl groups in CPT which may be associated with an increase in the number of hydrogen bonds formed. Thus, a mixture of intermolecular and intramolecular hydrogen bonds is considered to cause the broadening of the OH band in the IR spectra20.
Figure 1b shows that in the “fingerprint” region the spectra revealed several bands. The band at 1642 cm–1 is associated
with adsorbed water in cellulose19,22,23. The bands at 1430,
1370, 1335 and 1320 cm–1 are attributed to CH
2 symmetric
bending, CH bending, OH in plane bending, CH2 rocking vibration, respectively21-23, and the bands at 1162, 1111,
1057, 1033, 898 cm–1 are assigned to asymmetric C-O-C
bridge stretching, the anhydroglucose ring asymmetric stretching, C-O stretching, C-H in plane deformation, C-H deformation of cellulose, respectively21-24,26. On the other
hand, the peaks for xylan from hemicelluloses are derived from molecular vibrations in the uronic acids at 1730 and 1600 cm–1[28]. CEG sample showed a more prominent peak
than CPT at around 1730 cm–1 while the band at 1600 cm–1
overlap with the band at 1642 cm–1 associated with adsorbed
water in cellulose19,22,23. This may indicate that xylan is
more alkali resistant and probably hemicelluloses can be precipitation on the surface of the eucalyptus cellulose fibers during kraft cooking28,29.
The ratio between the heights of the bands at
1372 and 2900 cm–1 proposed by Nelson and O’Connor
(1964) as total crystalline index (TCI)22 was used to evaluate
the infrared (IR) crystallinity ratio. The band at 1430 cm–1
is associated with the amount of crystalline structure of
Figure 1. FTIR spectra of celluloses studied in the region between 4000-2800 cm–1 (a) and between 1800-800 cm–1 (b).
Table 1. Algebric expressions commonly used for solid thermal decomposition processes.
Mechanism - Solid state process g(α) f(α)
A(n) - Nucleation and growth 1/
[ 1 (1−n − α)] n ( 1)/
(1 )[ 1 (1 )]n n
n − α − n − α −
R2 - Phase boundary controlled reaction (contracting area) 1
2
[1 1 (1− n − α) ]
1 2
2(1− α)
R3 - Phase boundary controlled reaction (contracting volume) 1
3
[1 1 (1− n − α) ] 3(1− α)23
D1 - One-dimensional diffusion α2 1
(1 / 2)α−
D2 - Two-dimensional diffusion (Valensi equation) (1− α)1 (1n − α + α) 1
[1 (1n )]−
− − α
D3 - Three-dimensional diffusion (Jander equation) 1
2 3
[1 (1− − α) ] (3 / 2[1 (1− − α) ] (112−1 − α)23
D4 - Three-dimensional diffusion (Ginstling-Brounshtein equation) 2
3
[1 (2 / 3) ] (1− α − − α) (3 / 2)[1 (1− − α) ]13−1
cellulose, while the band at 898 cm–1 is assigned with the
amorphous region in cellulose 25. The ratio between the areas
of the bands at 1429 and 897 cm–1 are used as a lateral order
index (LOI)22. Considering the chain mobility and bond
distance, the hydrogen bond intensity (HBI) of cellulose is closely related to the crystal system and the degree of intermolecular regularity, that is, crystallinity27. The ratio
of the absorbance bands at 3400 and 1320 cm–1 was used to
study the cellulose samples HBI. The obtained results are displayed in Table 2.
The TCI is proportional to the crystallinity degree of cellulose20 and LOI is correlated to the overall degree of
order in cellulose22,26. Based on this fact, the CPT showed
the highest TCI and LOI value indicating highest degree of crystallinity and more ordered cellulose structure than the CEG. On the other hand, CEG presented lowest TCI and LOI value which may indicate that this cellulose is composed for more amorphous domains in the cellulose structure when compared with the CPT. The HBI value is higher for CPT than for CEG sample. This result might be indicated that CPT contain much more cellulose chains in a highly organized form which can lead to higher hydrogen bond intensity between neighbor cellulose chains and result in more packing cellulose structure and higher crystallinity than CEG. The crystallinity of cellulose is closed related with the thermal stability12,30. Therefore, it is possible that
cellulose samples with highest TCI, LOI and HBI may exhibit higher thermal stability.
3.2.
Thermogravimetric analysis
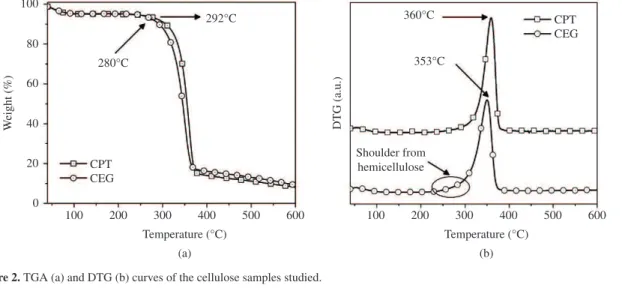
Figure 2 shows the TGA and derivative thermogravimetric (DTG) curves of the cellulose samples studied. A small weight loss for both samples occurs between 40-70 °C which is attributed to the removal of absorbed water in cellulose14,31.
As depicted in Figure 2a, the CEG sample initiates a more pronounced degradation process at around 280 °C while for CPT a more pronounced degradation process occurs at 292 °C. At this reaction time, the cleavage of the glycosidic linkages of cellulose reduces the polymerization degree leading to the formation of organic compounds like alkenes and other hydrocarbon derivatives32,33 and after 400 °C the
residual decomposition process can lead to formation of CO, CO2, H2O and char5,31. The DTG curve of CPT was shifted
to higher temperatures than CEG. The DTG peak occurs at 353 °C for CEG and 360 °C for CPT, as shown in Figure 2b. This result suggests that celluloses with higher TCI, LOI and HBI have higher thermal stability probably due to the much more hydrogen bonds between cellulose chains that can result in more ordered and packing cellulose regions, this in turn possibly increasing the thermal decomposition temperature of cellulose. Moreover, the CEG sample presented a small shoulder between 250 and 300 °C. This behaviour can be associated with the hemicellulose degradation in this sample. According Yang et al.31 hemicellulose starts a more
prominent decomposition between 220-315 °C. However, for both CEG and CPT samples the start of hemicellulose decomposition is difficult to distinguish and overlaps with the degradation of cellulose.
3.3.
Kinetics results
Figure 3 illustrates the application of the Coats and Redfern method for the kinetic models listed in Table 1. The values of n used were 3.42 and 2.45 for CEG and CPT,
respectively according to a previous work12. As can be
seen in Figure 3a, the best fits using the Coats and Redfern method for CEG indicated that for this cellulose sample the degradation process occurs by first order reaction with random nucleation resulting in an F1 mechanism, which is
Table 2. Cellulose infrared crystallinity ratios and hydrogen bond intensity
Cellulose samples IR crystallinity ratio HBI
H1372/H2900 (TCI)
A1429/A897
(LOI) A3400/A1320
CEG 0.457 ± 0.020 3.507 ± 0.344 1.368 ± 0.014
CPT 0.491 ± 0.010 4.071 ± 0.128 1.455 ± 0.002
in agreement with the results describes by Conesa et al.38
and Dahiya et al.39. On the other hand, phase boundary
controlled reactions with contracting area and contracting volume also occurs, in agreement with other results from the literature33-37. This degradation behavior may be associated
with the lower crystallinity of the CEG sample observed by FTIR results. The degradation process probably starts sporadically on the cellulose amorphous domains from the entire sample. When the crystalline domains degradation takes place the degradation initially occurs on the crystallites surface and phase boundary controlled reactions also described the degradation mechanism. For the CPT sample the best fit occurs by a degradation mechanism corresponded to Rn, i.e. the phase boundary-controlled reaction, as shown in Figure 3b. Similar results were described by Wu and Dollimore34. Once again, the FTIR results may be explained
better the degradation mechanism. The CPT sample had higher crystallinity than CEG, as can be seen in Table 2. The more packing cellulose chains in CPT sample might be difficult the heat transfer by diffusion through the cellulose chains and then the degradation process may be initially occurs by degradation of the surface of the cellulose crystallites with contraction of the area and volume, resulting in R2 and R3 degradation mechanisms.
The activation energy values for CEG were found
in the range of 173-190 kJ.mol–1 and for CPT between
124-126 kJ.mol–1, as presented in Table 3. The values found
for both cellulose samples are consistent with the values reported in the literature38,39. However, the CEG sample
had a higher activation energy range than the CPT sample. The lower activation energy values observed for CPT might be attributed to the thermal decomposition of this sample being controlled by dehydration which results in anhydrocellulose. The CPT sample showed a higher band at 1642 cm–1 assigned to the adsorbed water into
the cellulose structure, see Figure 1b. The more quantity of adsorbed water into the cellulose structure of CPT sample may be responsible for initiate the degradation process by dehydration which probably results in lower activation energy values. The higher activation energy for CEG may be indicating that the thermal decomposition occurs by depolymerization of cellulose with production of levoglucosan, according to the classic model proposed by Broido-Shafizadeh18,40 as shown in Figure 4. Therefore,
the two parallel or competitive reactions occurs for the two cellulose samples study, however dehydration reactions are more prominent for CPT sample while for CEG
Table 3. Activation energy values from Coats and Redfern method
CEG n = 3.42 CPT n = 2.45
Mechanism Ea (kJ.mol–1) r E
a (kJ.mol
–1) r
R2 173.37 0.9966 125.65 0.9974
R3 177.90 0.9954 124.24 0.9969
F1 190.00 0.9920 124.64 0.9948
D1 –99.68 –0.9994 –58.17 –0.9973
D2 695.64 0.8940 572.96 0.8807
D3 2150.50 0.9248 1993.65 0.8941
D4 911.53 0.9053 740.26 0.9029
A(n) 190.31 0.9922 124.79 0.9962
Figure 3. Linear fits of the Coats and Redfern method using different degradation mechanism (g(α)) determined through the
of the cellulose fibers studied. For the CEG sample the degradation processes occurs by random nucleation and probably starts on the cellulose amorphous domains while for CPT, that had more crystallinity regions than CEG, the more packing cellulose chains might be difficult the heat transfer by diffusion through the cellulose chains and then the degradation process may be occurs by degradation of the surface of the cellulose crystallites with a phase boundary controlled reaction.
The lower activation energy values observed for CPT than CEG might be attributed to the thermal decomposition of this sample being controlled by dehydration while for CEG the higher activation energy values probably indicated that the thermal decomposition occurs by depolymerization of cellulose. In general, the crystallinity and thermal stability were more affected by the kraft pulping conditions than by those of sulfite pulping. This behavior may be associated with the higher cooking temperature used during the cooking process employed for the CEG sample.
Acknowledgments
The authors acknowledge Cambará S.A., CMPC S.A. for supplying the cellulose fibers and CAPES for a fellowship.
depolymerization reactions are more predominant. Similar behavior was observed by Soares et al.40 for cellulose powder
and kraft paper and by Scheirs et al.41 for cellulose paper
and kraft insulating paper.
4. Conclusions
The crystallinity and kinetic decomposition of two cellulose samples obtained by two pulping process were investigated. FTIR results indicated that CPT contains more cellulose chains in a highly organized form which may result in more packing cellulose structure and higher crystallinity than CEG. Thermogravimetric results confirm that CPT sample presented higher thermal stability than CEG probably due to the more ordered cellulose regions.
Through the kinetic parameters it was found that there are differences between the degradation processes
Figure 4. Broido-Shafizadeh reaction scheme for pyrolysis of cellulose16,34.
References
1. Bengtsson M, Le Baillif M and Oksman K. Extrusion and mechanical properties of highly filled cellulose
fibre-polypropylene composites. Com posi te s Par t
A. 2007; 38:1922-1931. http://dx.doi.org/10.1016/j.
compositesa.2007.03.004
2. Qiu W, Zhang F, Endo T and Hirotsu T. Preparation and characterization of composites of high-crystalline cellulose with polypropylene: effects of maleated polypropylene and cellulose
content. Journal of Applied Polymer Science. 2003; 87:337-345.
http://dx.doi.org/10.1002/app.11446
3. Borja Y, Rieb G and Lederer K. Synthesis and characterization of polypropylene reinforced with cellulose I and II fibers.
Journal of Applied Polymer Science. 2006; 101:364-369. http://
dx.doi.org/10.1002/app.23847
4. S p o l j a r i c S , G e n o v e s e A a n d S h a n k s R A . Polypropylene-microcrystalline cellulose composites
with enhanced compatibility and properties. Composites
Part A. 2009; 40:791-799. http://dx.doi.org/10.1016/j. compositesa.2009.03.011
5. Quiévy N, Jacquet N, Sclavons M, Deroanne C, Paquot M and Devaux J. Influence of homogenization and drying on
the thermal stability of microfibrillated cellulose. Polymer
Degradation and Stability. 2010; 95:306-314. http://dx.doi.
org/10.1016/j.polymdegradstab.2009.11.020
6. John MJ and Thomas S. Biofibres and biocomposites.
Carbohydrate Polymers. 2008; 71:343-364. http://dx.doi. org/10.1016/j.carbpol.2007.05.040
7. Newman RH. Estimation of the lateral dimensions of cellulose
crystallites using 13C NMR signal strengths. Solid State
Nuclear Magnetic Resonance. 1999; 15:21-29. http://dx.doi. org/10.1016/S0926-2040(99)00043-0
8. Wada M and Okano T. Localization of Iαand Iβ phases in algal
cellulose revealed by acid treatments. Cellulose. 2001; 8:183-188.
http://dx.doi.org/10.1023/A:1013196220602
9. Hult E-L, Iversen T and Sugiyama J. Characterization of the supermolecular structure of cellulose in wood
pulp fibers. Cellulose. 2003; 10:103-110. http://dx.doi.
org/10.1023/A:1024080700873
10. Gümüskaya E, Usta M and Kirei H. The effects of various pulping conditions on crystalline structure of cellulose in cotton
linters. Polymer Degradation and Stability. 2003; 81:559-564.
http://dx.doi.org/10.1016/S0141-3910(03)00157-5
11. Nada A-AM.A, Kamel S and El-Sakhawy M. Thermal behaviour and infrared spectroscopy of cellulose carbamates.
Polymer Degradation and Stability. 2000; 70:347-355. http://
dx.doi.org/10.1016/S0141-3910(00)00119-1
12. Poletto M, Pistor V, Zeni M and Zattera AJ. Crystalline properties and decomposition kinetics of cellulose fibers
in wood pulp obtained by two pulping process. Polymer
Degradation and Stability. 2011; 96:679-685. http://dx.doi. org/10.1016/j.polymdegradstab.2010.12.007
13. Neagu RC, Gamstedt EK and Berthold F. Stiffness contribution
of various wood fibers to composite materials. Journal
of Composite Materials. 2006; 40:663-699. http://dx.doi. org/10.1177/0021998305055276
14. Poletto M, Dettenborn J, Pistor V, Zeni M and Zattera AJ. Materials produced from plant biomass. Part I: evaluation
of thermal stability and pyrolysis of wood. Materials
Research. 2010; 13:375-379. http://dx.doi.org/10.1590/
S1516-14392010000300016
15. Pistor V, Ornaghi FG, Fiorio R and Zattera AJ. Thermal characterization of oil extracted from ethylene-propylene-diene t e r p o l y m e r r e s i d u e s ( E P D M ) .T h e r m o c h i m i c a
Acta. 2010; 510:93-96. http://dx.doi.org/10.1016/j.
tca.2010.06.028
16. Carmen Albano EF. Thermogravimetric evaluation of the
Degradation and Stability. 1998; 61:289-295. http://dx.doi.
org/10.1016/S0141-3910(97)00211-5
17. Coats AW and Redfern JP. Kinetic Parameters from
Thermogravimetric Data. Nature. 1964; 201:68-69. http://
dx.doi.org/10.1038/201068a0
18. Capart R, Khezami L and Burnham AK. Assessment of various kinetic models for the pyrolysis of a microgranular
cellulose. Thermochimica Acta. 2004; 417:79-89. http://dx.doi.
org/10.1016/j.tca.2004.01.029
19. Adel MA, Abb El-Wahab ZH, Ibrahim AA and Al-Shemy MT. Characterization of microcrystalline cellulose prepared from lignocellulosic materials. Part II: physicochemical properties.
Carbohydrate Polymers. 2011; 83:676-687. http://dx.doi.
org/10.1016/j.carbpol.2010.08.039
20. Popescu M-C, Popescu C-M, Lisa G and Sakata Y. Evaluation of morphological and chemical aspects of different wood
species by spectroscopy and thermal methods. Journal
of Molecular Structure. 2011; 988:65-72. http://dx.doi. org/10.1016/j.molstruc.2010.12.004
21. Chen H, Ferrari C, Angiuli M, Yao J, Raspi C and Bramanti E. Qualitative and quantitative analysis of wood samples by Fourier transform infrared spectroscopy and multivariate
analysis. Carbohydrate Polymers. 2010; 82:772-778. http://
dx.doi.org/10.1016/j.carbpol.2010.05.052
22. Carrilo F, Colom X, Suñol JJ and Saurina J. Structural FTIR analysis and thermal characterization of lyocell and viscose-type
fibres. European Polymer Journal. 2004; 40:2229-2234. http://
dx.doi.org/10.1016/j.eurpolymj.2004.05.003
23. Schwanninger M, Rodrigues JC, Pereira H and Hinterstoisser B. Effects of short vibratory ball milling on the shape
of FT-IR spectra of wood and cellulose. Vibrational
Spectroscopy. 2004. 36:23-40. http://dx.doi.org/10.1016/j.
vibspec.2004.02.003
24. Tserki V, Matzinos P, Kokkou S and Panayiotou C. Novel biodegradable composites based on treated lignocellulosic waste flour as filler. Part I. Surface chemical modification
and characterization of waste flour. Composites Part
A. 2005; 36:965-974. http://dx.doi.org/10.1016/j.
compositesa.2004.11.010
25. Å ke r h o l m M , H i n t e r s t o i s s e r B a n d S a l m é n L . Characterization of the crystalline structure of cellulose
using static and dynamic FT-IR spectroscopy. Carbohydrate
Research. 2004; 339:569-578. PMid:15013393. http://dx.doi.
org/10.1016/j.carres.2003.11.012
26. Corgié SC, Smith HM and Walker LP. Enzymatic transformations of cellulose assessed by quantitative high-throughput Fourier
transform infrared spectroscopy (QHT-FTIR). Biotechnology
and Bioengineering. 2011; 108:1509-1520. PMid:21337332. http://dx.doi.org/10.1002/bit.23098
27. Oh SY, Yoo DI, Shin Y and Seo G. FTIR analysis of cellulose treated with sodium hydroxide and carbon dioxide.
Carbohydrate Research. 2005; 340:417-428. PMid:15680597.
http://dx.doi.org/10.1016/j.carres.2004.11.027
28. Åkerholm M and Salmén L. Dynamic FTIR spectroscopy for
carbohydrate analysis of wood pulps. Journal of Pulp and
Paper Science. 2002; 28:245-249.
29. Petra Wollboldt R, Zuckerstätter G, Weber HK, Larsson PT and Sixta H. Accessibility, reactivity and supramolecular structure of E. globulus pulps with reduced xylan content. Wood Science and Technology. 2010; 44:533-546. http://dx.doi.org/10.1007/ s00226-010-0370-2
30. Kim U-J, Eom SH and Wada M. Thermal decomposition
of native cellulose: influence on crystallite size. Polymer
Degradation and Stability. 2010; 95:778-781. http://dx.doi. org/10.1016/j.polymdegradstab.2010.02.009
31. Yang H, Yan R, Chen H, Zheng C, Lee DH and Liang DT. In-depth investigation of biomass pyrolysis based on three major components: hemicellulose, cellulose and lignin.
Energy&Fuels. 2006; 20:388-393. http://dx.doi.org/10.1021/ ef0580117
32. Spinacé MAS, Lambert CS, Fermoselli KKG and De Paoli M-A. Characterization of lignocellulosic curaua fibres.
Carbohydrate Polymers. 2009; 77:47-53. http://dx.doi. org/10.1016/j.carbpol.2008.12.005
33. Elanthikkal S, Gopalakrishnapanicker U, Varghese S and Guthrie JT. Cellulose microfibres produced from banana
plant wastes: Isolation and characterization. Carbohydrate
Polymers. 2010; 80:852-859. http://dx.doi.org/10.1016/j.
carbpol.2009.12.043
34. Wu Y and Dollimore D. Kinetic studies of thermal degradation of
natural cellulosic materials. Thermochimica Acta. 1998;
324:49-57. http://dx.doi.org/10.1016/S0040-6031(98)00522-X 35. Lerdkanchanaporn S, Dollimore D and Alexander KS.
A simultaneous TG-DTA study of the degradation in nitrogen of cellulose to carbon, alone and in the presence
of other pharmaceutical excipients. Thermochimica
Acta. 1998; 324:25-32. http://dx.doi.org/10.1016/
S0040-6031(98)00520-6
36. Bianchi O, Dal Castel C, De Oliveira RVB, Bertuoli P and Hillig E. Avaliação da degradação não-isotérmica de madeira através
de termogravimetria-TGA. Polímeros. 2010; 20:395-400.
http://dx.doi.org/10.1590/S0104-14282010005000060 37. Bourbigot S, Chlebicki S and Mamleev V. Thermal degradation
of cotton under linear heating. Polymer Degradation
and Stability. 2002; 78:57-62. http://dx.doi.org/10.1016/
S0141-3910(02)00119-2
38. Conesa JA, Caballero JA, Marcilla A and Font R. Analysis of different kinetic models in the dynamic pyroysis of cellulose.
Thermochimica Acta. 1995; 254:175-192. http://dx.doi. org/10.1016/0040-6031(94)02102-T
39. Dahiya JB, Kumar K, Muller-Hagedorn M and Bockhorn H. Kinetics of isothermal and non-isothermal degradation
of cellulose: model-based and model-free methods. Polymer
International. 2008; 57:722-729. http://dx.doi.org/10.1002/
pi.2398
40. Soares S, Camino G and Levchik S. Comparative study of the thermal decomposition of pure cellulose and pulp paper.
Polymer Degradation and Stability. 1995; 49:275-283. http://
dx.doi.org/10.1016/0141-3910(95)87009-1
41. Scheirs J, Camino G and Tumiatti W. Overview of water
evolution during the thermal degradation of cellulose. European
Polymer Journal. 2001; 37:933-942. http://dx.doi.org/10.1016/