Simulation model of discret events applied to the planning and operation of a toll
plaza
Marco Antônio de Farah Caldas; Karina Thiebaut Sacramento+ Universidade Federal Fluminense (UFF), Niterói, Brasil
Article Info Abstract
Keywords: Simulation HCM
Discrete Events Traffic Flow Level of service
This work investigates the congestion and traffic flow in a tool plaza, and proposes a methodology for the classification of highway flows and its service levels based on a combination of the Highway Capacity Manual – HCM and Discrete Events Simulation fundaments. The proposed mesoscopic simulation is used to analyze service levels of different physical and operational arrangements of a particular toll gate. The model considers speed functions, toll gate arrivals and departures, as well as events as possible accidents and track change functions when the vehicles arrive at the gate, and offers data for the HCM indexes, which produces the respective service levels. After the application of the model, the results showed the possibility of an operational gain in terms of time in queue, time of congestion and reduction of conflicts, in case the solution is implemented, assisting in decision making. Finally, conclusions are made based on the results of the simulation model.
Submitted 22 Jun 2015; received in revised form 5 Jul 2015; accepted 12 Jul 2015.
Licensed under Creative Commons CC-BY 3.0 BR.
+ Corresponding author. Rua Passo da Pátria nº 156, sala 440, Bloco E, São Domingos, Niterói – RJ – Brasil. E-mail address: [email protected]
Introduction
Urban traffic systems (UTS) are complex systems composed of vehicles, pedestrians, traffic lights, a traffic network structure and some other sub-systems such as Urban Traffic Management and Vehicle Generation. The large number of the vehicles provokes well known problems such as traffic jams, air and noise pollution, fuel consumption, and stress to drivers (Neri et al., 2010). According to Moita and Almeida (2012), when demand is high and the service is deficient, there are queues that virtually stagnate the system flow. Considering the described above, studies on traffic and transportation are gaining increasing importance in today's world, due to the impact they generate in the world economy, and in society as a whole. One of the most discussed topics involving these problems is the frequent traffic jams on the main streets in major urban centers, that worsen significantly the quality of population´s life in their surroundings, causing problems such as stress and physical and mental fatigue, which, in turn, impact directly on the productivity of firms, and consequently in its economical results. According to Chabrol et al. (2006), the UTS main goal is to allow the users to achieve their trips in the network in a reasonable time and with a sufficient safety level. In order to achieve their objectives, urban managers have two alternatives: to maintain the global level of performance whatever local jam situations, or to enhance the performance of the system in order to reduce the travel time, the number of jams.
In view of the above, this study aims to contribute to such analysis through the elaboration of a mesoscopic simulation model of discreet events based on the traffic flow theory and on empirical studies developed in the last decades and described in the Highway Capacity Manual – HCM (HCM, 2000), adapting its fundaments to the vehicle flow optimization at a toll gate, in order to enhance the performance of the system, raising the level of service to clients. This simulation consists in testing scenarios contemplating possible operational and civil engineering alterations at the toll plaza and analyzing the results, aiming to offer subsidies to decisions makers to provide the best physical arrangement for the plaza.
This paper will present a mesoscopic simulation model of discreet events based on the traffic flow theory. The remainder of this article is organized as follows: Section 1 the literature on modelling and simulation in urban traffic systems; Section 2 describes the model developed; Section 3 presents the results of the simulation; Finally, some concluding remarks are given.
1. Modelling and simulation in urban traffic systems
Knowledge of fundamental traffic flow characteristics and associated analytical techniques is an essential requirement in the planning design and operation of transportation systems (May, 1990). The researches on traffic flow models started with Lighthill and Whitham (1955), when they presented a model based on the analogy between the vehicles of a traffic flow and the particles of a fluid. Since then, traffic flow mathematic descriptions have been researched and discussed between traffic engineers, resulting in a high number of models that describe different aspects of the traffic flow operations.
Considering the variety of developed models, it’s necessary to classify them, in order to distinguish one from the other, and to select the one that best fits to the problem under study. These models might be classified according to their
ITPS, Manaus, Brazil. ISSN 2238-1031. 41 concepts.
Concerning the detail level, the main classification of traffic flow models are microscopic, macroscopic and mesoscopic. Microscopic assume that the behavior of an individual vehicle is a function of the traffic conditions in its environment.
Although microscopic simulations usually keep track of each vehicle’s destination, their assumptions are difficult to validate because humans’ behavior in real traffic not in contrived car-following experiments is difficult to observe and measure (Daganzo, 1994). Examples of microscopic models of traffic flows are Yang and Koutsopoulos (1996), Ben-Akiva et al. (1994), Simon an Nagel (1998), Kosonen and Pursula (1991), Liu et al. (2006), Neri et al. (2010), Zhao et al. (2010) and Felez et al. (2013). Daganzo (1994) also says that macroscopic models are the ones which assume that the aggregate behavior of sets of vehicles, easier to observe and validate, depends on the traffic conditions in their environment. While not perfect, its shortcomings are well understood. It is justifiably and routinely used in traffic engineering analyses. Unfortunately, most macroscopic models do not differentiate their component flows by destination; each stream is treated as the flow of a single commodity. Macroscopic simulation models can be found ate the following papers: Lighthill and Whitham (1955), Papageorgiou et al. (1990), Sanwal et al. (1996), McCrea and Moutari (2010), Liu and Lu (2013), and a review of the state of art of microscopic traffic flow modelling was made by Mohan and Ramadurai (2013). Finaly, the mesoscopic modeling of traffic flow usually consists of a simplification of microscopic ones, capturing the essentials of the dynamics, combining microscopic aspects as individual vehicles, and macroscopic aspects, such as those concerning vehicle dynamics (Felez et al., 2013). Some approaches in mesoscopic modelling were made by Jayakrisham et al. (1994), De Palma and Marchal (1999), Mahut et al. (2003), Olstam et al. (2008) and Toledo et al. (2010).
2. The study model
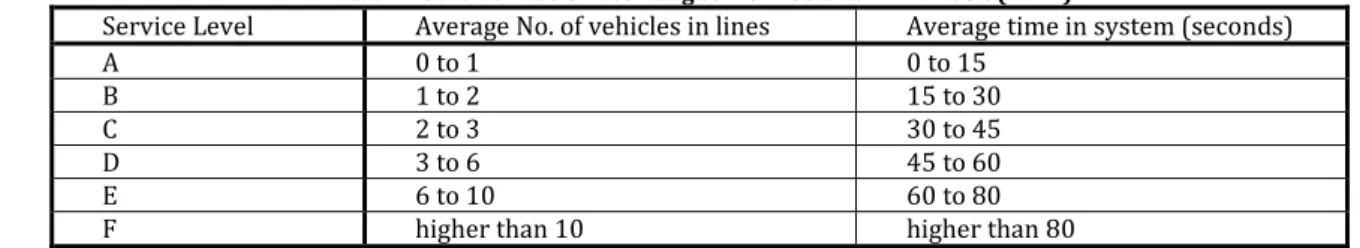
The service level is a concept that uses qualitative measures to evaluate operational conditions. Although in the Highway Capacity Manual – HCM – it is well established levels for segment analysis using free flow concepts applied to highways, the same cannot be applied to toll plazas. Thus, what has been studied by several authors is the use of methodologies for the evaluation of services on toll plazas using the basic concepts proposed in the HCM. This is the main contribution of this work to research. Lin and Su (1994) used measures such as the average vehicles in line and the average time spent by the system to qualify tool plaza service levels. These indicators reflect efficiently the service quality and are easily perceived by the users. Table 1 illustrates the values suggested by Lin and Su (1994) for each service level.
Table 1 - Service Levels According to HCM. Source: Lin and Su (1994).
Service Level Average No. of vehicles in lines Average time in system (seconds)
A 0 to 1 0 to 15
B 1 to 2 15 to 30
C 2 to 3 30 to 45
D 3 to 6 45 to 60
E 6 to 10 60 to 80
F higher than 10 higher than 80
2.1. Structure of the simulation model
The model proposed here represents the traffic dynamics of a toll plaza through several logics, probabilities, decision trees and mathematic functions. The model it is able to verify the possible effects on the variables that indicate the toll plaza service quality, in order to study possible alterations in the physical configurations according to demand characteristics. The scheme below attempts to represent the main logic groups, which is described under the Figure 1. The vehicle generation is supplied from a previously established demand, as well as by the exponential distribution for interval
determination between arrivals. And all calculations are steadily performed via these entities that run trough the model .
The vehicle generation has also been determined through historical data that contemplate the period from February 2012 to January of 2013. Table 2, presents the average values and the standard deviation for each business day of the week. Vehicles are classified as light (passenger cars) and heavy (trucks), as well as the time necessary to get throw a gate. There are two destinations to get throw the gates in the plaza and the utilization percentages of these vehicles according to its destinations are in Table 3.
Figure 1 - Structure of the Simulation Model. Source: the authors.
Table 2 - Average and Daily Volume Deviation in Vehicles per Day. Source: The authors. Daily Volume
Day Average Deviation
Monday 65037.06 7356.96
Tuesday 67563.76 6919.26
Wednesday 70354.60 6848.76
Thursday 71621.04 5812.74
Friday 76580.02 5308.60
Table 3 - Percentage of Daily Volume per Vehicle Category and Destination. Source: The authors.
Type/Destiny Destiny 1 Destiny 2
Heavy 66,80% 33,20%
Light 56,65% 43,35%
Motorcycles 62,18% 37,82%
2.1.1. The limits between flow regimes.
In this model three flow regimes are assumed (free, saturated and jammed), which are called standard capacity regimes and reduced capacity regimes. Through the relations established via HCM, together with some of its generalizations, as well as characteristic data of the studied segment, it is possible to identify the density limits that define for each vehicle that accesses the road, which speed function corresponding to the flow regime should be used. Such speed defines the segment crossing time in relation to its length. The Figure 2 below identifies the several regimes.
The e limits are the densities given by the density in the free limit (around 15 vehicles per km) and the density in the saturated limit (around 28 vehicles per kilometer) defined by vehicle flow functions VP and its average S speeds.
Figure 2 - Graphic of Vehicle Flow Regimes. Source: HCM (2000).
Besides, the Free Flow Speeds - FFS (Free-Flow Speed) are also determined through the expression:
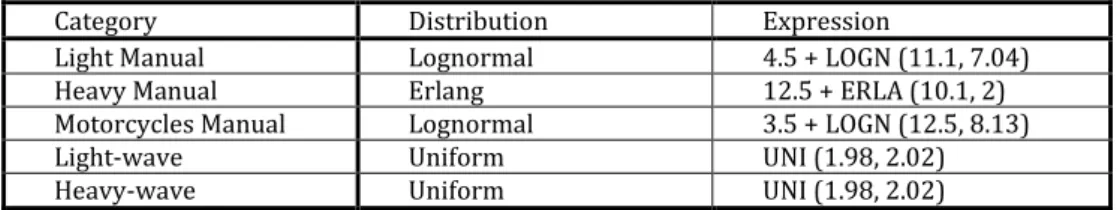
ITPS, Manaus, Brazil. ISSN 2238-1031. 43 vehicles and their respective attendance times in the cabins are represented under the table 4 below:
Table 4 - Probabilistic Functions for the Arrival at Toll Gates and Attendance Times Source: The authors.
Category Distribution Expression
Light Manual Lognormal 4.5 + LOGN (11.1, 7.04)
Heavy Manual Erlang 12.5 + ERLA (10.1, 2)
Motorcycles Manual Lognormal 3.5 + LOGN (12.5, 8.13)
Light-wave Uniform UNI (1.98, 2.02)
Heavy-wave Uniform UNI (1.98, 2.02)
The cabins were divided per manual cabins where exists money collection and wave cabins where the vehicles have automatic and prepaid toll cards.
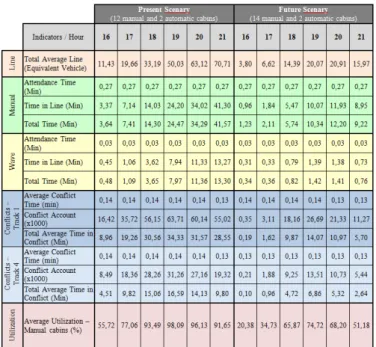
3. Results
The purpose for the model created from the set of variables and flow regimes for simulating quality levels, led the study to predict impacts on the operational conditions for two toll gate layout situations (Figures 3 and 4). As it can be seen in figure 5, there are significant improvements in time and in traffic jam reduction along the rush hours of a regular week (from 16:00 to 21:00 hour). This reductions (up to almost 80% in time and conflicts), improved flow conditions raising quality service to a more appropriate level.
Figure 3 - Present situation – 12 manual cabins and 2 automatic
cabins. Source: The authors. Figure 4 - Future situation – 14 manual cabins and 2
automatic cabins. Source: The authors.
Conclusion
Figure 5 - Service Levels within the Two Situations. Source: The authors.
References
Ben-Akiva, M., Koutsopoulos, H. N., & Mukundan, A. (1994). A dynamic traffic model system for ATMS/ATIS operation. Intelligent Vehicle Highway System Journal, Vol. 2, No. 1, pp. 1–19.
Chabrol, M., Sarramia, D., & Tchernev, N. (2006). Urban traffic systems modelling methodology. International Journal of Production Economics, Vol. 99,No. 1-2, pp. 156-176.
Daganzo, C. (1994). The cell transmission model: A dynamic representation of highway traffic consistent with the hydrodynamic theory. Transportation Research B, Vol. 28B, No.4, pp. 269-287.
De Palma, A., & Marchal, F. (1999). Analysis of travel cost components using large-scale dynamic traffic models. Transportation Research Record, Vol. 1676, pp. 177-183.
Felez, J., Maroto,J., Cabanellas, J. M., & Mera, J. M. (2013). A full-scale simulation model to reproduce urban traffic in real conditions in driving simulators. Simulation, Vol. 89, No. 9, pp. 1099-1114.
Highway Capacity Manual (2000). Transportation Research Board. National Research Council. Washington, D.C., EUA.
Hoogendoorn, S. P., & Bovy, P. H. L. (2001). State-of-the-art of Vehicular Traffic Flow Modelling. Journal of Systems and Control Engineering, Vol. 215, No. 4, pp. 283-303.
Jayakrisham, R., Mahmassani, H. S., & Hu, T.-Y. (1994). An evaluation tool for advanced traffic information and management systems in urban networks. Transportation Research Part C: Emerging Technologies, Vol. 2, No. 3, pp. 129–147.
Kelton, W. D., Sadowski, R. P., & Sadowski, D. A. (2002). Simulation with Arena, 2nd ed., McGrawHill, New York, NY.
Kosonen, I., & Pursula, M. (1991). A simulation tool for traffic control planning. IEEE Conference Publication Number 320, Third International Conference on Road Traffic Control, pp. 72–76.
Lighthill, M. J., & Whitham, G. B. (1955). On kinematic waves: II. A theory of traffic flow on long crowded roads. Proceedings of the Royal Society of London A, Vol. 229, No. 1178, pp. 317–345.
Lin, F. & Su, C. (1994). Level of Service Analysis of Toll Plazas on Freeway Main Lines. Journal of Transportation. Engineering, Vol. 120, No.2, pp. 246-263.
Liu, X.-M., & Lu, S.-F. (2013). Applying the maximum information principle to cell transmission model of traffic flow. Journal of hydrodynamics – Ser. B, Vol. 25, No. 5, pp. 725-730.
Liu, R., Van Vliet, D., & Watling, D. (2006). Microsimulation models incorporating both demand and supply dynamics. Transportation Research Part A: Policy and Practice, Vol. 40, No. 2, pp. 125–150.
Mahut, M., Florian, M., & Tremblay, N. (2003). Space–time queues and dynamic traffic assignment: a model, algorithm and applications. Transportation Research Board 82nd annual meeting, Washington, D.C.
May, A. D. (1990). Traffic Flow Fundamentals. Prentice Hall, Englewood Cliffs, New Jersey.
McCrea, J., & Moutari, S. (2010). A hybrid macroscopic-based model for traffic flow in road networks. European Journal of Operational Research, Vol. 207, No. 2, pp. 676–684.
Mohan, R., and Ramadurai, G. (2013). State-of-the art of macroscopic traffic flow modelling. International Journal of Advances in Engineering Sciences and Applied Mathematics, Vol. 5 No. 2–3, pp. 158–176.
Moita, M. H. V. & Almeida, E. S. (2012). Aplicação de simulação para obtenção de soluções ao tráfego em rotatória da cidade de Manaus. Journal of Transport Literature, Vol 6, No. 1, pp. 93–109.
Neri, E. L., Treviño, A. R., and Mellado, E. L. (2010). A modeling framework for urban traffic systems microscopic simulation. Simulation Modelling Practice and Theory, Vol. 18, No. 8, pp. 1145-1161.
Olstam, J. J., Lundgren, J., Adlers, M., and Matstoms, P. (2008). A Framework for Simulation of Surrounding Vehicles in Driving Simulators. ACM Transactions on Modeling and Computer Simulation, Vol. 18, No. 3, pp. 1-24.
Papageorgiou, M., Blosseville, J. M., and Haj-Salem, H. (1990). Modeling and real-time control of traffic flow on the southern part of Boulevard Périphérique in Paris: Part I: Modeling. Transportation Research Part A: General, Vol. 24, No. 5, pp. 345–359.
Sanwal, K. K., Petty, K., Walrand, J., and Fawaz, Y. 1996 , An extended macroscopic model for traffic flow , Transportation Research Part B:
Methodological, Vol. 30, No. 1, pp. 1-9.
Simon, P.M., and Nagel, K., (1998). Simplified cellular automaton model for city traffic. Physical Review E, Vol. 58, No. 2, pp. 1286–1295. Toledo, T., Cats, O., Burghout, W., and Koutsopoulos, H. N. (2010). Mesoscopic simulation for transit operations. Transportation Research
Part C: Emerging Technologies, Vol. 18, No. 6, pp. 896–908.