ISSN 0104-6632 Printed in Brazil
www.abeq.org.br/bjche
Vol. 24, No. 03, pp. 375 - 388, July - September, 2007
Brazilian Journal
of Chemical
Engineering
NATURAL CONVECTION HEAT TRANSFER IN
PARTIALLY OPEN ENCLOSURES CONTAINING
AN INTERNAL LOCAL HEAT SOURCE
V. C. Mariani
1*and L. S. Coelho
21
Pontifical Catholic University of Paraná, Graduate Program in Mechanical Engineering, PUCPR/CCET/PPGEM, Imaculada Conceição 1155, CEP: 80215-901, Curitiba PR, Brazil
E-mail: [email protected]
2
Pontifical Catholic University of Paraná, Graduate Program in Industrial Systems and Engineering, Automation and Systems Laboratory, PUCPR/CCET/PPGEPS,
Imaculada Conceição 1155, CEP: 80215-901, Curitiba - PR, Brazil. E-mail: [email protected]
(Received: May 30, 2005 ; Accepted: May 25, 2007)
Abstract - A numerical study was conducted to investigate steady heat transfer and flow phenomena of natural convection of air in enclosures, with three aspect ratios (H/W = 1, 2, and 4), within which there is a local heat source on the bottom wall at three different positions, Wh. This heat source occupies 1% of the total volume of the enclosure. The vertical walls in the enclosures are insulated and there is an opening on the right wall. The natural convection is influenced by the difference in temperature between the left and right walls, represented by a Rayleigh number (Rae), and by local heat source, represented by a Rayleigh number (Rai). Numerical simulations were performed for several values of the Rayleigh number ranging between 103 and 106, while the intensity of the two effects – the difference in temperature on the vertical walls and the local heat source – was evaluated based on the Rai/Rae ratioin the range between 0 and 2500. The analysis proceeds by observing variations in the streamlines and isotherms with respect to the different Rae, R ratios, aspect ratios, of the radius and positions of the local heat source. The average Nusselt numbers on the hot and cold walls are influenced by different values of the parameters R, Rae, Wh, and H/W. Results show the presence of different flow patterns in the enclosures studied. Thus, the flow and heat transfer can be controlled by external heating, and local heat source.
Keywords: Natural convection; Average Nusselt number; Rectangular enclosures; Numerical study; heat source.
INTRODUCTION
In recent years, numerical modeling of the convective heat transfer problem has been an area of great interest due to its broad applications in engineering. Compared to the experimental method, numerical analysis provides a more direct way to enhance/reduce heat transfer effectively so as to improve the performance or to optimize the structure of a thermal device.
Natural convection in enclosures has been studied both experimentally and numerically, due to the
considerable interest in its many engineering applications, such as building insulation, solar energy collection, cooling of heat-generating components in the electrical and nuclear industries, and flows in rooms due to thermal energy sources (Yang, 1987).
Other authors have studied the natural convection caused by a heat-generating conducting body located inside an enclosure: Chu and Churchill, 1976; Khalilollahi and Sammakia, 1986; Keyhani et al., 1988; Farouk, 1988; Ho and Chang, 1994; Ha et al., 1999; Deng and Tang, 2002; Oztop et al., 2004; Bazylak et al., 2006.
Numerous studies on natural convection caused only by external heating in partially open enclosures have been conducted by Chan and Tien, 1985; Angirasa et al., 1995; Polat and Bilgen, 2002; Bilgen and Oztop, 2005; Lauriat and Desrayaud, 2006. However, few results have been reported for natural convection caused simultaneously by both external heating in partially open enclosures and an internal local heat sources although problems of this type are frequently important and their study is necessary for understanding the performance of complex natural convection flow and heat transfer.
Indirectly related to the present study, Xia and Zhou (1992) studied a square and partially open enclosure with an internal heat source. These authors change the position on the bottom wall or left vertical wall for only three R ratios. They found that the opening was advantageous to the flow and heat transfer in the cavity. In this case, the characteristics of flow and heat transfer changed with heat source location, external and internal Rayleigh number, and opening size. Reinehr et al. (2002) examined natural convection using the aspect ratio H/W = 2, with an internal heat source whose position was varied only on the bottom wall. In that work, no heat transfer results were reported and a limited number of Rae
and R ratios were also studied.
The present work is a numerical study of natural convection due to the temperature difference between left and right walls and an internal local heat source in three partially open enclosures, for which few results have been reported in the literature. The enclosures have an opening in the cooled right vertical wall, while the left vertical wall is heated and the upper and lower walls are adiabatic. Natural convection is induced by the difference in temperature between the vertical walls, and it is represented by the Rayleigh number (Rae) and by an
internal local heat source represented by the Rayleigh number (Rai), occupying approximately
1% of the enclosure volume.
The study is conducted numerically under the assumption of steady laminar flow for three different values of both the height-to-width aspect ratio of the enclosure of 1, 2, and 4 and the Rayleigh number based on enclosure height in the range between 103 and 106. The Rai/Rae ratio in the range between 0 and
2500 and the internal local heat source position at Wh = 0.25, 0.5, and 0.75 on the bottom wall are
evaluated. In this context, the influence on flow patterns, temperature distributions and heat transfer rates is analyzed and discussed.
MATHEMATICAL FORMULATION
To model the flow under study, we use the conservation equations for mass, momentum, and energy for the two-dimensional, steady, and laminar flow. For the moderate temperature difference considered in this work, all the physical properties of the fluid, µ, k, and cp, are considered constant except
density, in the buoyancy term, which obeys the Boussinesq approximation. In the energy conservation equation, we neglect the effects of compressibility and viscous dissipation. Thus, the dimensionless equations that govern the flow are
U V
0
X Y
∂ +∂ =
∂ ∂ (1)
2 2
2 2
U U P U U
U V Pr
X Y X X Y
∂ + ∂ = −∂ + ∂ +∂
∂ ∂ ∂ ∂ ∂ (2)
2 2
e
2 2
V V P V V
U V Pr Ra Pr
X Y Y X Y
∂ + ∂ = −∂ + ∂ +∂ + θ
∂ ∂ ∂ ∂ ∂ (3)
2 2
2 2
U V R
X Y X Y
∂θ + ∂θ = ∂ θ ∂ θ+ +
∂ ∂ ∂ ∂ (4)
Definitions of the dimensionless parameters are listed in the Nomenclature section. The fluid in the interior environment is atmospheric air with the Prandtl number, Pr = 0.71 (air is the working fluid). The Rayleigh number (Rae) is represented by the
difference in temperature between the vertical walls, 103 ≤ Rae ≤ 106. The intensity of heat produced by
the source is represented by the Rayleigh number
(Rai), which is based on the volumetric heat
generation rate. The influence of the intensity of the two Rayleigh numbers is evaluated by means of the equation, i e Ra R Ra
= (5)
The stream function is defined by the following equations
u = ∂ψ/∂y (6)
v = - ∂ψ/∂x (7)
where the numerical results illustrating the fluid’s behavior are presented in terms of the dimensionless stream function,
dim ψ
ψ =α (8)
Other physical quantities of interest in the present study are the average Nusselt numbers for the hot and cold walls; these variables are defined respectively as H h X 0 0 Nu dY X = ∂θ = − ∂
∫
(9) Hc
X W H / 2
Nu dY
X =
∂θ
= −
∂
∫
(10) The air is studied in three rectangular enclosures with width W and height H heated on the left-hand vertical wall and cooled on the upper half of the right-hand vertical wall. These two walls have a prescribed temperature, while the horizontal wallsare adiabatic. Schematic representations of the configurations studied are presented in Fig. 1.
The position Wh = 0.25, 0.5, and 0.75, illustrated
in Fig. 1 is the distance from the left lateral wall to the center of the heat source. The internal heat generation source is located on the adiabatic bottom wall at different places and occupies 1% of the total volume of the enclosure. The lower half of the right wall is open and is in contact with the air outside the enclosure. The boundary conditions used are
U = V = 0 and θ = 1 at X = 0 and 0 ≤ Y ≤ H (11a)
U = V = 0 and θ = 0 at X = W and H/2 ≤ Y ≤ H (11b)
U = V = 0 and ∂θ ∂ =Y 0 at 0 ≤ X ≤ W and Y = 0 (11c)
U = V = 0 and ∂θ ∂ =Y 0 at 0 ≤ X ≤ W and Y = H (11d)
s f
K∂θ ∂ = ∂θ ∂n nat the source-fluid interfaces (11e)
where K is the ratio of the thermal conductivities between the heated source and the fluid, θs is the
dimensionless temperature in the heated source, and
θf is the dimensionless temperature in the fluid. The
velocity and temperature profiles for the opening are assumed to be,
X 0
∂θ ∂ = if U > 0 or else θ = 0; V = 0 at X = W (12) and 0 ≤ Y ≤ H/2.
L H Th
Tc W Wh y x H/2 (a) H W H/2 Th Tc Wh (b) H/2 W H Th
Tc
Wh
(c)
SOLUTION PROCEDURE
The differential equations, represented by equations (1) to (4), together with respective boundary conditions, equations (11) and (12), are solved using the finite volume method (MVF) described in Patankar (1980). In this method the solution domain is divided into small finite control volumes. The differential equations are integrated into each of those control volumes. From this integration there were algebraic equations which, when solved simultaneously or separately, supplied pressure and velocity components. A power law scheme is adopted for the convection-diffusion formulation. For the pressure-velocity coupling the SIMPLEC algorithm (semi implicit method for pressure linked equations consistency) is used (Patankar, 1980).
The discretized equations are solved iteratively, using the line-by-line method known as the Thomas algorithm or TDMA (tridiagonal matrix algorithm). An underrelaxation parameter of 0.5 was used in order to obtain a stable convergence for the solution of momentum and energy equations, while there was no need for such a parameter in the solution of the pressure equation.
Validation of the computer code for this work was verified for the natural convection problem in a closed enclosure without a local heat source. The results presented here are for two Rayleigh numbers, Rae = 105 and Rae = 106. Hortman et al. (1990) found
the average Nusselt numbers 4.616 and 4.525 for Rae
= 105 and grids 42 × 42 and 82 × 82, respectively, while in our study 4.604 and 4.535, respectively, were found. For the Rae = 106 they found the average
Nusselt numbers 9.422 and 8.977 for the same grids, while in our study 9.487 and 8.975, respectively, were found.
Grid-independence tests were conducted for all the configurations studied in this work. Three
different grid sizes (22 × 22, 42 × 42 and 82 × 82) were used and, for example, for H/W = 1, Rae =
2500, and R = 1000 the average Nusselt numbers for the hot wall obtained were -3.87, -4.01, and -4.06 and for the cold wall 4.45, 4.40, and 4.38, respectively, were found for the grids.Because of the small differences for the 42 × 42 and 82 × 82 grids, a
42 × 42 uniform grid was chosen for all the
simulations presented in this work. Staggered storage of the variables was used. The numerical solution is considered to be converged when the maximum absolute value of the mass conservation was smaller than 10-10.
NUMERICAL RESULTS AND DISCUSSION
In order to compare the numerical code specifically developed for the present study, some solutions obtained in the square cavity, H/W = 1, when the internal heat source was centrally located at the bottom horizontal wall (at position Wh = 0.5)
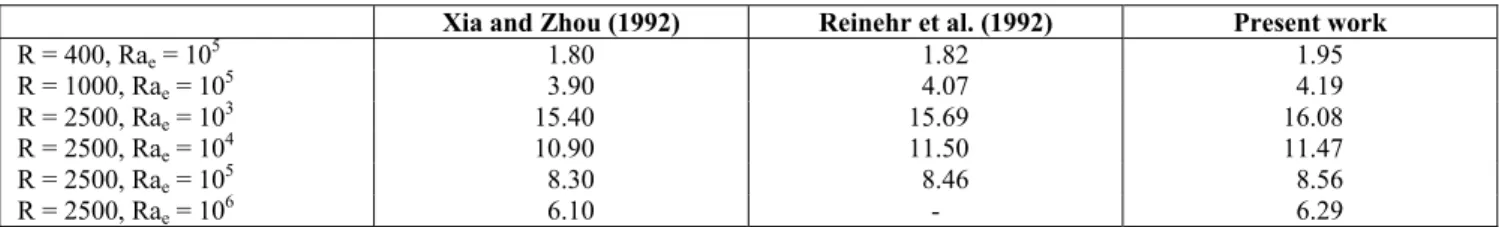
were compared with results of Xia and Zhou (1992) and Reinehr et al. (2002), showing good agreement. These results are presented in Table 1, where different flow patterns occur with the change in Rae
or R. A comparative analysis between the values in Table 1 shows relative deviation (RD),
RD =
(
100.|∆θmax | θmax)
% (13)where θmax is proposed in Xia and Zhou (1992) and
Reinehr et al. (2002) and ∆θmax is the difference
between the results of this work and those of the two studies mentioned. The results of Xia and Zhou (1992) are situated in the interval of 3.11% ≤ θmax ≤
8.3%, while for Reinehr et al. (2002) the interval is 0.2% ≤θmax≤ 7%, showing good agreement between
the results.
Table 1: Maximum dimensionless temperature (θmax) for H/W = 1 and Wh = 0.5.
Xia and Zhou (1992) Reinehr et al. (1992) Present work
R = 400, Rae = 105 1.80 1.82 1.95
R = 1000, Rae = 105 3.90 4.07 4.19
R = 2500, Rae = 103 15.40 15.69 16.08
R = 2500, Rae = 104 10.90 11.50 11.47
R = 2500, Rae = 105 8.30 8.46 8.56
R = 2500, Rae = 10 6
6.10 - 6.29
According to Table 2 the maximum dimensionless temperature increases considerably with the increasing R ratio, keeping Rae constant,
independently of the position, heat sources and
aspect ratio H/W. The maximum dimensionless temperature decreases with the increasing Rae when
values of R and Rae, with the heat source at different
positions inside the enclosures indicates that the differences are not significant. When the height of the enclosures increases, the dimensionless temperature also increases, as shown in Table 2.
In Table 3 the dependence of Nu on R, h Rae, H/W, and Wh is shown. In the range studied,
h
Nu undergoes a process from positive to negative with the increasing R for all enclosures studied. When the effect of external heating (Rae) on heat
transfer in the partially open enclosures is larger than that of the local heat source, Nu is positive and h decreases with increasing R at a given Rae, and the
hot wall plays a role in heating the fluid in the enclosures, but when Rae is smaller, Nu is negative h
and |Nu | increases with R and the hot wall plays a h role in cooling the fluid in the enclosures. This behavior was also noted by Xia and Zhou (1992). The Nu changes with the different positions of h local heat source, generally increasing with Wh. The
|Nu | value increases with H/W. It can be observed h that the value of Nuh generally doubles with the
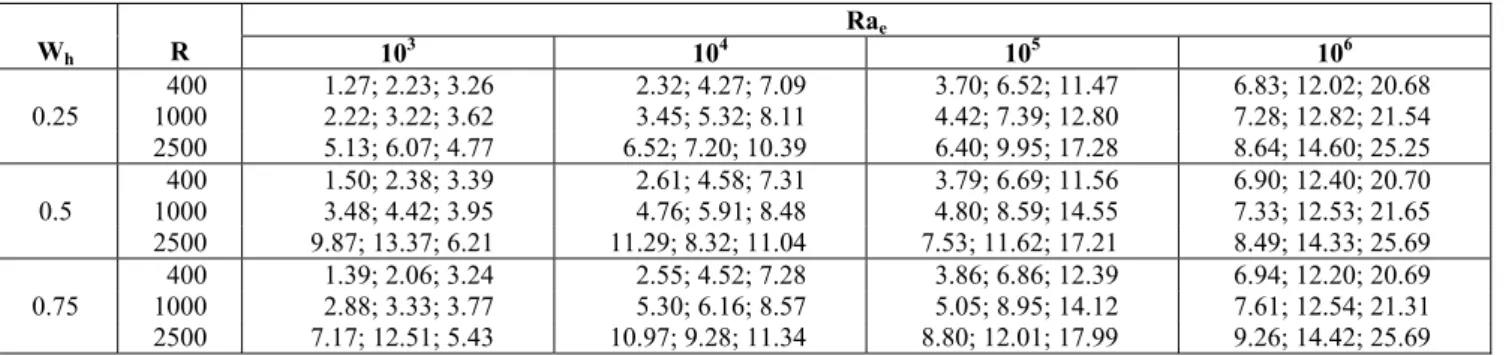
increasing of enclosures height from H/W = 1 to H/W = 2 and H/W = 2 to H/W = 4. In Table 4 the dependence of Nu on R, Rac e, H/W, and Wh is
shown. In the range studied, Nu increases with R c
and Rae. Nu is generally larger when the local heat c source is closer to the cold wall. When the enclosure height increases, Nu increases significantly. c
Table 2: Maximum dimensionless temperature for H/W = 1, 2, and 4, respectively.
Rae
Wh R 103 104 105 106
400 3.29; 4.39; 5.20 2.66; 3.49; 3.89 2.06; 2.53; 2.84 1.49; 1.83; 2.10
1000 6.95; 9.39; 10.97 5.56; 7.15; 7.94 4.19; 4.78; 5.55 3.05; 3.49; 4.01
0.25
2500 15.34; 20.77; 23.54 11.97; 14.58; 16.61 8.54; 9.64; 11.36 6.32; 7.22; 8.25
400 3.50; 4.92; 6.02 2.62; 3.60; 3.89 1.95; 2.47; 2.73 1.36; 1.71; 2.00
1000 7.64; 10.52; 12.02 5.62; 7.14; 7.74 4.19; 4.77; 5.40 2.97; 3.45; 3.91
0.5
2500 16.08; 21.20; 38.31 11.47; 14.41; 15.99 8.56; 9.68; 11.18 6.29; 7.22; 8.14
400 3.01; 4.39; 5.37 2.46; 3.72; 3.79 1.86; 2.40; 2.72 1.33; 1.58; 1.95
1000 7.08; 10.10; 11.19 5.58; 7.16; 7.64 4.13; 4.73; 5.37 2.93; 3.39; 3.88
0.75
2500 15.29; 20.28; 23.24 11.50; 14.33; 15.89 8.48; 9.60; 11.13 6.33; 7.17; 8.11
Table 3: Average Nusselt number on the hot wall for H/W = 1, 2, and 4, respectively.
Rae
Wh R 103 104 105 106
400 -2.14; -4.59; -8.74 -0.94; -1.77; -3.49 1.95; 4.88; 7.33 8.61; 14.81; 23.33
1000 -6.87;-14.42;-26.74 -5.25;-10.50;-21.02 -1.92; -3.51; -9.40 4.83; 5.87; 8.61
0.25
2500 -18.03;-35.19;-68.5 -15.59;-29.9;-62.48 -11.53;-24.15;-51.9 -4.98;-12.44;-28.48
400 -1.26; -3.41; -6.39 -0.50; -0.97; -2.28 2.30; 5.35; 8.37 9.13; 14.90; 24.55
1000 -4.50;-11.09;-20.99 -3.38; -7.85; -18.1 -0.78; -3.46;-9.47 5.69; 8.85; 11.82
0.5
2500 -11.28;-20.27;-55.0 -9.20;-23.17;-55.43 -8.03;-19.97;-44.25 -1.50; -7.07;-19.77
400 -0.29; -0.85; -2.03 -0.03; -0.29; -0.59 2.47; 5.19; 6.54 9.46; 15.25; 25.11
1000 -1.82; -6.34;-13.56 -2.06; -5.99; -15.04 -0.27; -2.24; -6.25 5.21; 9.82; 14.38
0.75
2500 -5.89;-16.79;-43.45 -8.67;-18.12;-48.79 -5.49;-15.95;-39.21 -1.15; -4.80; -15.42
Table 4: Average Nusselt number on the cold wall for H/W = 1, 2, and 4, respectively.
Rae
Wh R 103 104 105 106
400 1.27; 2.23; 3.26 2.32; 4.27; 7.09 3.70; 6.52; 11.47 6.83; 12.02; 20.68
1000 2.22; 3.22; 3.62 3.45; 5.32; 8.11 4.42; 7.39; 12.80 7.28; 12.82; 21.54
0.25
2500 5.13; 6.07; 4.77 6.52; 7.20; 10.39 6.40; 9.95; 17.28 8.64; 14.60; 25.25
400 1.50; 2.38; 3.39 2.61; 4.58; 7.31 3.79; 6.69; 11.56 6.90; 12.40; 20.70
1000 3.48; 4.42; 3.95 4.76; 5.91; 8.48 4.80; 8.59; 14.55 7.33; 12.53; 21.65
0.5
2500 9.87; 13.37; 6.21 11.29; 8.32; 11.04 7.53; 11.62; 17.21 8.49; 14.33; 25.69
400 1.39; 2.06; 3.24 2.55; 4.52; 7.28 3.86; 6.86; 12.39 6.94; 12.20; 20.69
1000 2.88; 3.33; 3.77 5.30; 6.16; 8.57 5.05; 8.95; 14.12 7.61; 12.54; 21.31
0.75
Streamlines and isotherms for R = 2500 are shown in Figs. 2 to 7 for all enclosures and Wh = 0.25, 0.5, and 0.75. An analysis of these figures
indicates that when the heating source is located at the center, Wh = 0.5, or close to the opening of
the enclosure, Wh = 0.75, various differences occur
in the flow pattern according to the change in Rae or
R. When the local heat source is located at the position Wh = 0.25 close to the hot wall, its influence
on the flow patterns and on the heat transfer is negligible.
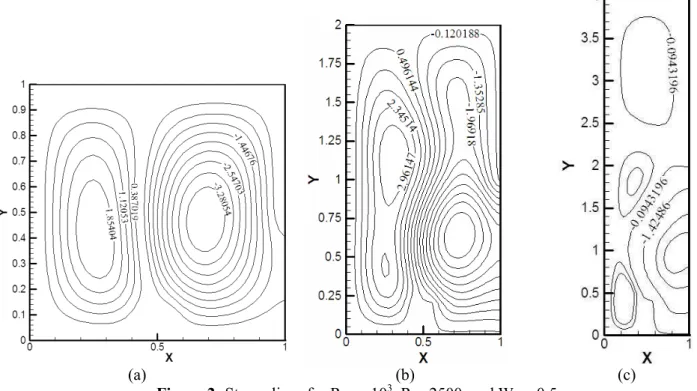
Verifying the position Wh = 0.5 in Figs. 2 and 3,
it can be seen that for Rae = 103 two eddies appear
inside the enclosures with H/W = 1 and 2 (see Fig. 2a and 2b) and three eddies appear inside the enclosure with H/W = 4 (see Fig. 2c). They circulate counterclockwise at the left of the enclosure and clockwise at the bottom right, where the intensity of both eddies is important for H/W = 1, i.e., flow and heat transfer are controlled by the internal local heat source and the difference in temperature on the vertical walls has a negligible influence. The left eddy close to the hot wall for H/W = 2 and 4 is less intense than the main flow because the local heat source becomes less important than the difference in temperature between the vertical walls.
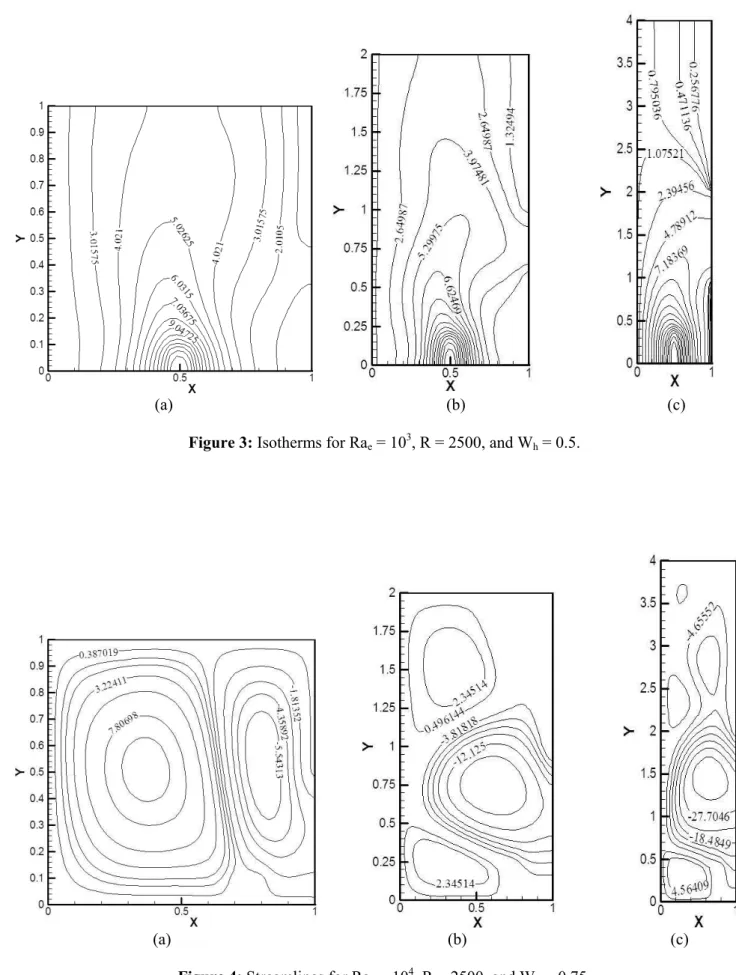
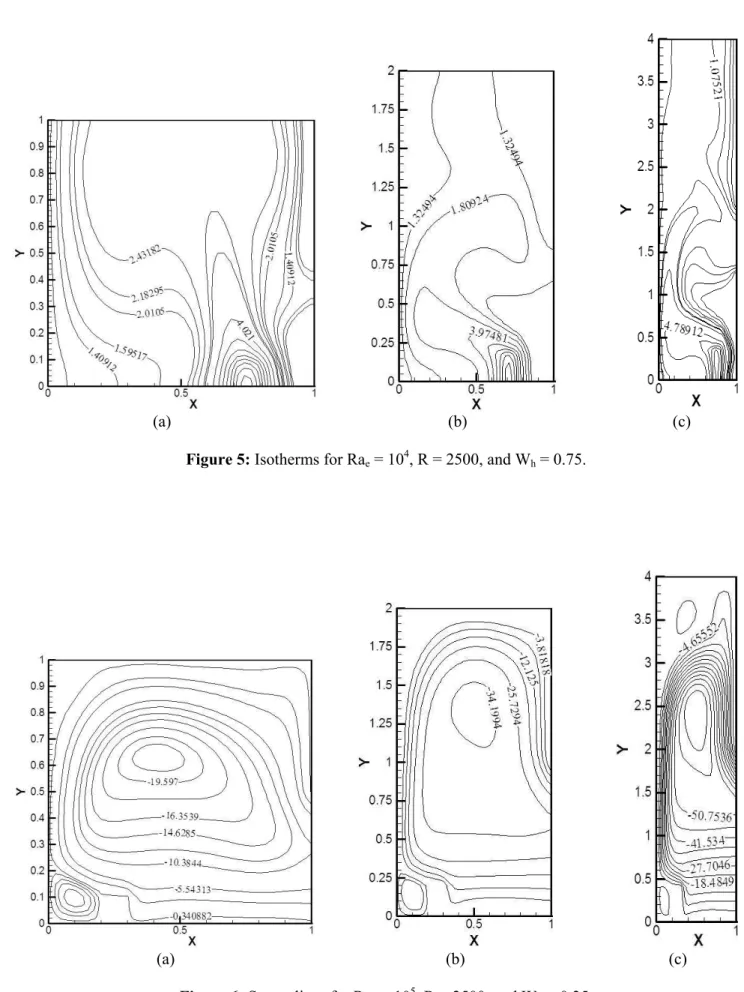
In Figs. 4 and 5, for the position Wh = 0.75 it can
be seen that at Rae = 104 two main eddies emerge in
the enclosure, one circulating counterclockwise close to the hot wall and the other circulating clockwise
close to the cold wall. In Figs. 4a and 5a the flow and heat transfer are controlled by the internal local heat source because the intensity of the counterclockwise eddy is much greater than that of the clockwise eddy, while in Figs. 4b, 4c, 5b, and 5c, the flow and heat transfer are controlled by the difference in temperature on the vertical walls.
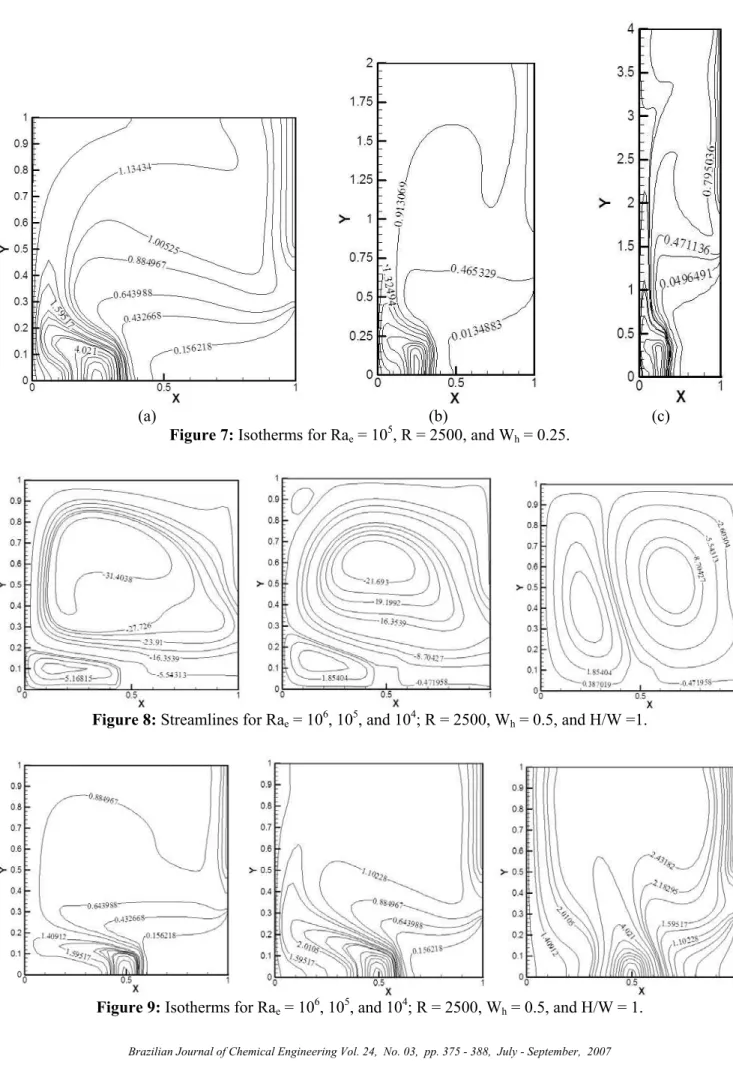
In Figs. 6 and 7, it can be observed that at Wh =
0.25 for Rae = 105 the enclosures have only a very
weak counterclockwise eddy at the backwind side of the local heat source and the larger eddy is a clockwise flow moving upwards along the hot wall and downwards along the cold wall, through the inflow and outflow openings. In these enclosures the flow and heat transfer are controlled by the difference in temperature of the vertical walls.
In Fig. 8 the fluid dynamic behavior of the air in the square enclosure (H/W = 1) is shown. Note that the increase in temperature differences between the vertical walls (Rae number) affects the fluid dynamic
behavior, increasing the intensity of the flow in the enclosure. This behavior was observed for the various values of R employed, but is illustrated here only for R = 2500 and for the local heat source at the central position on the bottom wall. The main eddy increases with the Rae number, although it reaches
the full height of the enclosure. In Fig. 9 some of the isotherms obtained for differents Rae are shown.
Note that the thermal behavior changes as a function of the increasing Rae number.
(a) (b) (c)
(a) (b) (c)
Figure 3: Isotherms for Rae = 103, R = 2500, and Wh = 0.5.
(a) (b) (c)
(a) (b) (c)
Figure 5: Isotherms for Rae = 104, R = 2500, and Wh = 0.75.
(a) (b) (c)
(a) (b) (c)
Figure 7: Isotherms for Rae = 105, R = 2500, and Wh = 0.25.
Figure 8: Streamlines for Rae = 106, 105, and 104; R = 2500, Wh = 0.5, and H/W =1.
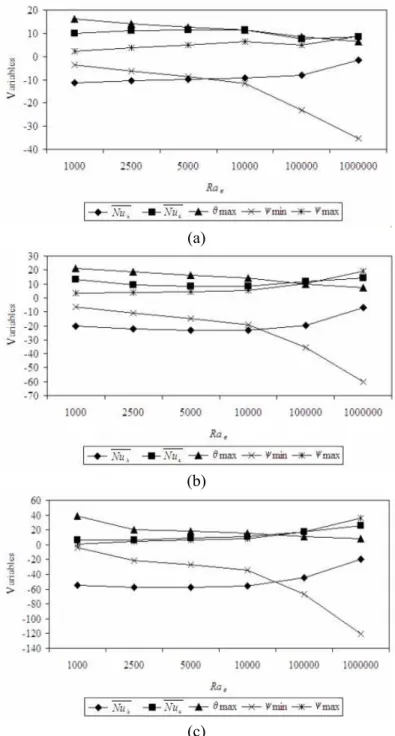
The Nu on the hot and cold walls are shown in Figs. 10a, 10b, and 10c, respectively, for H/W = 1, 2, and 4 at Wh = 0.5 and R = 2500, as a function of Rae.
As shown in the isotherms in Fig. 3 and by the dimensionless temperature in Table 2, the fluid temperature decreases with increasing Rae for the
same R in all enclosures studied in this work. The temperature gradient on the hot wall increases with
Rae, as shown in Table 3. In this table for
approximately R > 400, the Nuh has negative values, meaning that the fluid temperature next to the
hot wall is higher than the hot wall temperature and the heat flow changes direction from the enclosure to the hot wall, while Nuc increases with Rae, meaning
that the heat flow from the enclosure to the cold wall increases with this parameter. For example, Nu and c
h
Nu for Rae = 105 are larger than those for Rae = 104
for the same R and all enclosures, due to the increasing convective heat transfer with increasing Rae. The dimensionless stream functions ψmax and
|ψmin|increase with Rae.
(a)
(b)
(c)
Figure 10: Effect of Rae on various variables with R = 2500, Wh = 0.5,
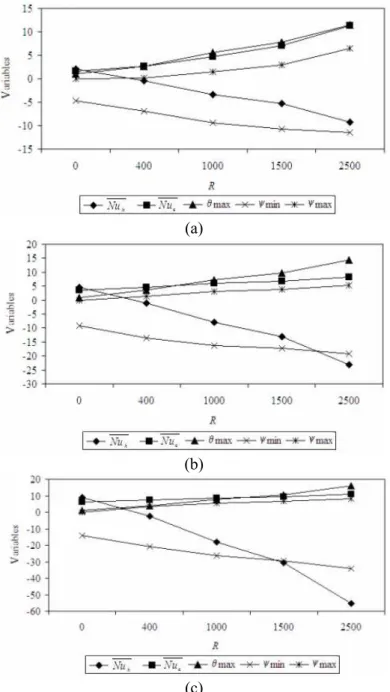
In Fig. 11 the variation in Nu , h Nu , c θmax,
dimensionless ψmax, and ψmin with the R ratio is
shown. In the range studied, the curves are similar, independent of the H/W value; nevertheless the values obtained are different. The Nu increases c with R, meaning that the heat flow from the enclosure to the cold wall increases with this parameter, and on the hot wall, Nu undergoes a h process from positive to negative with increasing R; this effect was shown in the results in Table 3. The dimensionless stream functions ψmax and |ψmin|
increase with R. The other variables increase with R for fixed Rae. If the effect of external heating on heat
transfer in the partially open enclosure is larger than
that of the local heat source, then Nu is positive h and decreases with the increasing R at a given Rae.
Fig. 12 illustrates the variation in Nu , h Nu , c
θmax, dimensionless ψmax, and ψmin with the location
of local heat source for Rae = 104 and R = 1000. For
this configuration, when the local heat source moves on the adiabatic wall (bottom wall) small changes in the average Nusselt number and in the other variables occur. When the heat source is located near the opening of the enclosures, theNu , h Nu c (generally) and ψmax values become larger in all
enclosures studied. It can be seen in Fig. 12 that the values of all variables are modified smoothly with the change in aspect ratio of all enclosures.
(a)
(b)
(c)
Figure 11: Effect of R on various variables with Rae = 104, Wh = 0.5,
(a)
(b)
(c)
Figure 12: Effect of location of heat source on various variables with R = 1000, Rae = 104, and H/W = (a) 1, (b) 2, and (c) 4, respectively.
CONCLUSIONS
This work was concerned with the numerical modeling of natural convection in three enclosures, within which there is a local heat source, occupying 1% of the total volume of the enclosures, located on the bottom wall at three different positions. The governing parameters were the Rayleigh number and the R ratio characterizing the heat transfer regime in natural convection. In view of the results, the findings may be summarized as follows:
i) with the increase in Rayleigh number (Rae), i. e.,
in the difference in temperature between the vertical walls, the maximum dimensionless temperature in the internal enclosures decreases, maintaining the R ratio constant, while Nu and h Nu increase. c
iii)the position of the local heat source, Wh,
influences the fluid dynamics of the air as well as the heat transfer rate in the enclosures.
iv)the aspect ratio H/W influences meaningfully the results obtained (for example, for maximum dimensionless temperature, small enclosures have lower temperatures, however large enclosures have higher temperatures for the same configurations) forNu , when the value is positive then it increases h
and when Nu is negative it decreases with h
increasing height of the enclosure, while Nu c increases with increasing height of the enclosure.
v) The opening is advantageous for the flow and
heat transfer in the enclosures, and its characteristics are complicated and change with location of internal heat source and external and internal Rayleigh numbers.
NOMENCLATURE
cp heat capacity (J/kg K)
g acceleration of gravity (m/s2)
H enclosure height (m)
k thermal conductivity (W/m K)
K ratio of the thermal
conductivities between the heated source and the fluid
(-)
Nu average Nusselt number (-)
p pressure (Pa)
P dimensionless pressure 3
2
( (p gy)H / )
= + ρ ρα
Pr Prandtl number (= ν/α)
q rate of local heat generation by the heated protrusion
(W/m2)
R Rayleigh number ratio (-)
Rae external Rayleigh number h
3 c
( (g (T T )H / ))
= β −
να
Rai internal Rayleigh number ( (g qH /5
k))
= β να
T temperature (K)
u velocity in x direction (m/s)
v velocity in y direction (m/s)
U dimensionless velocity in x
direction
(= uH/α)
V dimensionless velocity in y
direction
(= vH/α)
W enclosure width (m)
Wh heat generation source
location
(m)
x, y Cartesian coordinates (m)
X, Y dimensionless Cartesian coordinates
(= x/H, = y/H)
α thermal diffusivity (= k/ρcp)
(m2/s)
β volumetric coefficient of thermal expansion
(K-1)
θ dimensionless temperature (=(T-Tc)/(Th- Tc))
θs dimensionless temperature
in the heated source
(-)
θf dimensionless temperature
in the fluid
(-)
µ dynamic viscosity (Pa s)
ν kinematic viscosity (m2/s)
ρ fluid density (Kg/m3)
ψ stream function (m2/s)
Subscripts
c cold (-)
dim dimensionless (-)
e external (-)
h hot (-)
i internal (-)
max maximum value (-)
min minimum value (-)
w wall (-)
REFERENCES
Angirasa, D., Eggels, J. G. M. and Nieuwstadt, F. T. M., Numerical simulation of transient natural convection from an isothermal cavity open on a side, Numerical Heat Transfer, Part A: Applications, Vol. 28, No. 6, pp. 755-768 (1995). Bazylak, A., Djilali, N. and Sinton, D., Natural
convection in an enclosure with distributed heat sources, Numerical Heat Transfer, Part A: Applications, Vol. 49, No. 7, pp. 655-667 (2006). Ben-Nakhi, A. and Chamkha, A. J., Effect of length
and inclination of a thin fin on natural convection in a square enclosure, Numerical Heat Transfer, Part A: Applications, Vol. 50, No. 4, pp. 389-407 (2006).
Bilgen, E. and Oztop, H., Natural convection heat transfer in partially open inclined square cavities, International Journal of Heat and Mass Transfer, Vol. 48, No. 8, pp.1470-1479 (2005).
Heat Mass Transfer, Vol. 28, No. 3, pp. 603-612 (1985).
Chu, H. H. and Churchill, S. W., The effect of heater size, location, aspect-ratio and boundary conditions on two-dimensional laminar natural convection in rectangular channels, Journal of Heat Transfer, Vol. 98, No. 2, pp. 194-201 (1976).
Corcione, M., Effects of the thermal boundary conditions at the sidewalls upon natural convection in rectangular enclosures heated from below and cooled from above, International Journal of Thermal Sciences, Vol. 42, No. 2, pp. 199-208 (2003).
Davis, G. de V., Natural convection of air in a square cavity: A benchmark solution, International Journal for Numerical Methods in Fluids, Vol. 3, No. 3, pp. 249-264 (1983).
Deng, Q. and Tang, G., Numerical visualization of mass and heat transport for conjugate natural convection/heat conduction by streamline and heatline, International Journal of Heat and Mass Transfer, Vol. 45, No. 11, pp. 2373-2385 (2002). Farouk, B., Turbulent thermal convection in an
enclosure with internal heat generation, Journal of Heat Transfer, Vol. 110, No. 1, pp. 126-132 (1988).
Ha, M. Y., Jung, M. J. and Kim, Y. S., Numerical study on transient heat transfer and fluid flow of natural convection in an enclosure with a heat-generating conducting body, Numerical Heat Transfer, Part A: Applications, Vol. 35, No. 4, pp. 415-433 (1999). Ho, C. J. and Chang, J. Y., A study of natural
convection heat transfer in a vertical rectangular enclosure with two-dimensional discrete heating: Effect of aspect ratio, International Journal of Heat and Mass Transfer, Vol. 37, No. 6, pp. 917-925 (1994).
Hortmann, M., Peric, M. and Scheuerer, G., Finite volume multigrid prediction of laminar natural convection: Benchmark solutions, International Journal for Numerical Methods in Fluids, Vol. 11, No. 2, pp. 189-207 (1990).
Keyhani, M., Prasad, V. and Cox, R., An experimental study of natural convection in a vertical cavity with discrete heat sources, Journal
of Heat Transfer, Vol. 100, No. 3, pp. 616-624 (1988).
Khalilollahi, A. and Sammakia, B., Unsteady natural convection generated by a heated surface within an enclosure, Numerical Heat Transfer, Part A: Applications, Vol. 9, No. 6, pp. 715-730 (1986). Lauriat, G. and Desrayaud, G., Effect of surface
radiation on conjugate natural convection in partially open enclosures, International Journal of Thermal Sciences, Vol. 45, No. 4, pp. 335-346 (2006).
Le Quéré, P., Accurate solutions to the square thermally driven cavity at high Rayleigh number, Computers Fluids, Vol. 20, No. 1, pp. 29-41 (1991).
Mohamad, A. A., Benchmark solution for unsteady state CFD problems, Numerical Heat Transfer, Part A: Applications, Vol. 34, No. 6, pp. 653-672 (1998).
Oztop, H. F., Dagtekin, I. and Bahloul, A., Comparison of position of a heated thin plate located in a cavity for natural convection, International Comm. Heat Mass Transfer, Vol. 31, No. 1, pp. 121-132 (2004).
Patankar, S. V., Numerical heat transfer and fluid flow, Hemisphere Washington, D.C. (1980). Polat, O. and Bilgen, E., Laminar natural convection
in inclined open shallow cavities, International Journal of Thermal Sciences, Vol. 41, No. 4, pp. 360-368 (2002).
Reinehr, E. L., Souza, A. A. U. and Souza, S. M. A., Fluid dynamic behavior of air with natural convection and heat generation source in confined environment, In Proceedings of XIV Brazilian Congress of Chemical Engineering, Natal, Rio Grande do Norte, Brazil, pp. 1-8 (2002) (in Portuguese).
Xia, J. L. and Zhou, Z. W., Natural convection in an externally heated partially open cavity with a heated protrusion. FED-vol. 143/HTD, Vol. 232, Measurement and Modeling of Environmental Flows - ASME, Vol. 232, pp. 201-208 (1992). Yang, K. T., Natural convection in enclosures, in