ISSN 0104-6632 Printed in Brazil
www.abeq.org.br/bjche
Vol. 34, No. 01, pp. 143 - 158, January - March, 2017 dx.doi.org/10.1590/0104-6632.20170341s20150509
Brazilian Journal
of Chemical
Engineering
QUALITY, PERFORMANCE ANALYSIS, MASS
TRANSFER PARAMETERS AND MODELING OF
DRYING KINETICS OF SOYBEAN
H. Darvishi
*Department of Biosystems Engineering; Faculty of Agriculture, University of Kurdistan, P.O. Box: 416, Sanandaj, Iran. Phone: + (98) 087336277724; Fax: + (98) 08733624249
E-mail: [email protected]
(Submitted: August 15, 2015 ; Revised: November 5, 2015 ; Accepted: December 22, 2015)
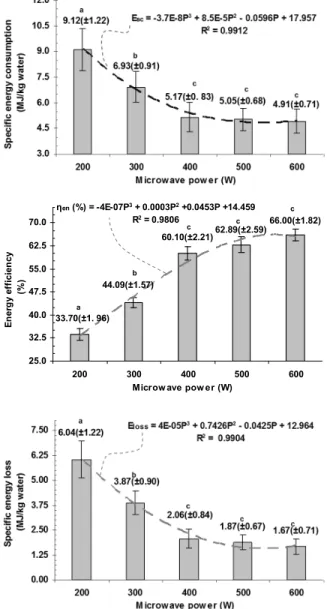
Abstract - Different aspects of soybean drying such as energy and exergy analyses, quality, mass transfer parameters, and modeling of drying kinetics were investigated in a microwave dryer. Results showed that energy and exergy efficiency increased with increasing microwave power, while values of energy efficiency (33.70 to 66.0%) were higher than exergy efficiency (23.38 – 48.30%). Specific energy consumption and energy loss varied 4.93 to 9.11 MJ/kg water and 5.04 to 8.89 MJ/kg water, respectively. Approximately 8.94 to 20.07% of the total energy input is consumed by increasing of the product temperature. The values of improvement potential changed between 1.31- 5.35 MJ/kg water. Bulk density, degree of shrinkage and rehydration ratio varied from 726.6 to 762.8 kg/m3, 0.888 to 0.910, and 0.618 – 0.799, respectively.
Parameters total color change (14.68 - 19. 89) and hue angle (88.07 to 91.73º) increased with increasing microwave power. Effective diffusivity and mass transfer coefficient varied from 1.99×10⁻⁹ to 12.25×10⁻⁹
m2/s and 2.71×10⁻⁶ to 19.98×10⁻⁶ m/s, respectively. The activation energy was found to be 4.98 W/g for a
diffusion model and 5.33 W/g for a mass transfer model. Among the models, the Page model was found to best describe the drying behavior of soybean.
Keywords: Soybean, Quality; Energy consumption; Exergy efficiency; Drying.
INTRODUCTION
Soybeans are harvested typically at moisture con-tents in the range 25-33% wet basis. But for safe storage, it is necessary to have a moisture content of soybeans less than 10% wet basis according to the local climate conditions (Darvishi et al., 2014a). Also, raw soybean cannot be consumed as human food or animal feed because of the presence of anti-nutritional substances, some of which may harm the consumer. In the treatment of raw soybeans after harvest, several methods are available such as cook-ing, roasting and drying (Gowen et al., 2008; Don-dee et al., 2011; Pfeifer et al., 2010).
possible mass transport mechanisms (Pathare and Sharma, 2006; Aboltins, 2013; Celma et al., 2012).
Drying is the most energy intensive process in the food industry. Therefore, improving drying processes by reducing energy consumption and providing high quality with minimal increase in economic input has become the goal of modern drying (Doymaz, 2011; Darvishi et al., 2014a; Alibas, 2007). In recent years, thermodynamic analyses, particularly exergy anal-yses, have appeared to be an essential tool for the system design, analyses and the optimization of thermal systems. From the thermodynamics point of view, exergy is defined as the maximum amount of work that can be produced by a system or a flow of matter or energy as it comes to equilibrium with a reference environment (Akpinar et al., 2006, Prom-mas et al., 2012).
Convective drying in hot air is still the most popu-lar method applied to reduce the moisture content of fruits and vegetables. Nevertheless, this method has a number of disadvantages such as very long-lasting drying period, high energy consumption, contamina-tion problems, low energy efficiency and high costs, which is not a desirable situation for the food industry (Alibas, 2007; Ozbek and Dadali, 2007, Al-Harahsheh et al., 2009). The desire to reduce the above prob-lems, as well as to achieve a fast and effective ther-mal process led to the use of microwave and dielec-tric heating methods for food drying (Bondaruk et al., 2007; Orsat et al., 2007). Microwave drying has several advantages such as higher drying rate, shorter drying time, decreased energy consumption, and better quality of the dried products (Sarimeseli et al., 2011; Wang et al., 2007; Soysal et al., 2006).
Therefore, the objectives of this work were to (1) present energy and exergy analyses of microwave drying of soybean, (2) estimate the improvement potential of the microwave drying process, (3) calcu-late mass transfer parameters (moisture diffusivity, mass transfer coefficient, activation energy for diffu-sion and mass transfer models), (4) determine of the quality aspects (rehydration ratio, shrinkage, colour), and (5) to fit the experimental data to six thin-layer drying models and estimate the constants.
MATERIALS AND METHODS
Sample Preparation
Fresh soybean seeds used for the drying experi-ments were obtained from the Gorgan region of Iran. The soybean samples were cleaned in an air screen to remove all foreign material (dust, dirt, broken
seeds) and stored at 4±0.5 °C before they were used in experiments. Soybean seeds had an initial moisture content of 24.5±0.2% wet basis (0.325±0.003 kg water kg dry matter), which was determined by oven drying at 103 ºC for 24 h (Darvishi et al., 2014b).
Drying Details
The schematic diagram of the experimental appa-ratus is shown in Figure 1. Drying studies were car-ried out with a domestic digital microwave oven (M945, Samsung Electronics Ins) with the technical feature of 230 V, 50 Hz and 1000 W. The oven is fitted with a controller to adjust the microwave out-put power and the time of processing. The dimen-sions of the inner cavity are 327×370×207 mm. The oven has a fan for air flow in the drying chamber and cooling of the magnetron. The moisture from the drying chamber was removed with this fan by pass-ing it through the openpass-ings on the right side of the oven wall to the outer atmosphere.
Figure 1: Schematic diagram of the experimental apparatus.
A digital analytical balance (GF-600, A & D, Ja-pan) with accuracy of ±0.01 g was positioned on the top of the microwave oven for mass determination at an interval of 15 s. A sample tray in the microwave oven chamber was suspended on the balance with a nylon wire through a ventilation hole in the center of the chamber ceiling. About 105 g of the prepared samples were uniformly spread in a thin layer (thick-ness of layer ≈ 2 cm) on the tray and dried to around 0.1291±0.009 moisture content (kg water/kg dry matter). The moisture content calculation was based on the following equation (Usub et al., 2010):
0 0
t
t (1 M ) m
M 1
m
(1)
Quality, Performance Analysis, Mass Transfer Parameters and Modeling of Drying Kinetics of Soybean 145
three times and the average values were used. The reference dead state conditions were considered as T0 = 20 ºC and P0= 101.325 kPa.
Energy Analyses
The energy conservation of the sensible heat, la-tent heat and source heat of microwave is written as (Jindarat et al., 2011):
energy input
in
energy absorption
latent heat energy of dry product energy of wet product
wp w
p dp p wp
energy loss
ref tra
P t
m
(mC T) (mC T)
E E (2)
Thermal drying efficiency is defined as the heat used to evaporate moisture from the samples divided by the heat input from the microwave source (Soysal et al., 2006):
en
in
energy absorption
P t
(3)
Specific heat capacity and latent heat of the sam-ple were calculated according to the following equa-tions (Hall, 1975; Sharqawy et al., 2010; Azadbakht et al., 2013; da Silve et al., 2012):
p
C 1.379 0.032M M30.5% w.b. (4)
wp
t fw
1 23exp( 40 M )
(5)
fw 2503 2.386T
(6)
where λw is obtained in kJ/kg when the temperaure is given in ºC. The specific energy loss is determined by (Darvishi et al., 2014a):
in
loss en
w
P t
E (1 )
m
(7)
The energy consumed for drying a kilogram of samples is calculated using Eq. (8):
in sc w P t E m
(8)
Exergy Analyses
The general exergy balance in the drying chamber was expressed as follows:
loss
energyinput
in
exergy absorption exergy of dry product exergy of wet product
evap dp wp EX ref tra P t ex t
(m ex) (m ex)
EX EX (9)
The rate of exergy transfer due to evaporation in the drying chamber was (Icier et al., 2008):
. 0
evap w wp
p T
ex 1 m
T
(10)
The specific exergy of wet or dry product was de-termined using Eq. (11) as follows (Akpinar et al., 2006):
p 0 0
0 T
ex C (T T ) T ln
T
(11)
The exergy efficiency of the dryer can be defined as the ratio of exergy output to exergy input, where the product is only the rate of exergy evaporation process and the electrical power is the rate of exergy input to the drying chamber. The exergy efficiency for any drying system is the ratio of exergy use (in-vestment) in the drying of the product to exergy of the drying source supplied to the system (Dincer and Sahin, 2004): evap ex in EX P
(12)
Exergy loss is determined by Eq. (13):
loss in out
EX EX EX (13)
The rate form as given by Hammond and Stapleton (2001) was used to determine the exergetic improve-ment potential of the drying process. The exergetic improvement potential is expressed as:
ex in out
Quality Aspects
Rehydration Ratio
Dried soybean seeds (5 g) were rehydrated at 25 ºC for 2 h by being immersed in 60 mL of distilled water. The rehydration ratio was described by:
1 d
1
m m
Rr m
(15)
Colour Measurement
L (lightness), a (redness), b (yellowness) colour values of the fresh and dehydrated products were measured using a spectral photometer before and after drying. Total colour change and hue angle were calculated as follows:
1
2 2 2 2
d f d f d f
E ((L L ) (a a ) (b b ) )
(16)
1 b h tan
a
(17)
Shrinkage
Shrinkage of bulk soybean is often represented by:
d 0 V Sh
V
(18)
The bulk density is the ratio of the mass of a sample of a seed to its total volume and it was de-termined by filling the seeds in a cylinder of known volume (30 mm diameter and 60 mm height) and weighing on an electronic balance.
b c m V
(19)
Drying Kinetics and Modeling
The change of moisture in soybean seeds during drying was expressed as the moisture ratio defined as:
t e
0 e
M M
MR
M M
(20)
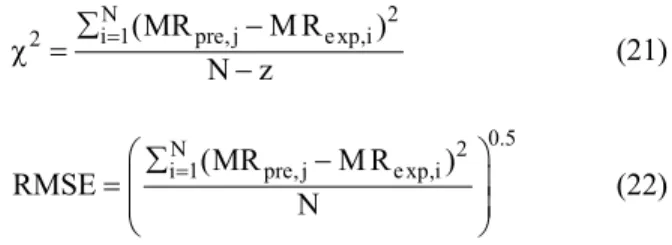
The values of Me are relatively small compared to Mt and M0 (especially for microwave drying), hence the error involved in the simplification by assuming that Me is equal to zero is negligible. Six well-known thin-layer drying models in Table 1 were tested to
select the best model for describing the drying curve of the soybean seeds. The non-linear regression analysis was performed using the SPSS.18 program and Microsoft Office 2003 Excel. Reduced chi-square (2), root mean square error (RMSE) and the coefficient of determination (R2) were used as the primary criteria to select the best equation to account for variation in the drying curves of the dried sam-ples. These parameters can be calculated as follows:
N 2
i 1 pre, j e xp,i
2 (MR M R )
N z
(21)
0.5
N 2
i 1(MRpre, j M Re xp,i) RMSE
N
(22)
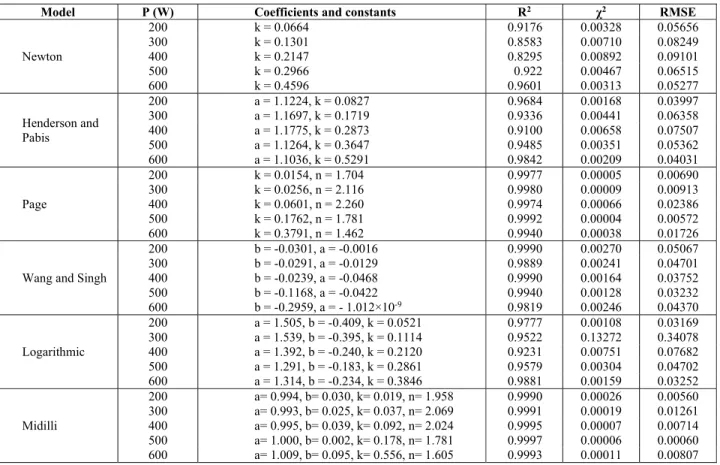
Table 1: Mathematical models given by various authors for the drying curves.
Model name Model References
Henderson and Pabis
MR = a exp (- kt) Darvishi et al. (2014a)
Newton MR = exp (- kt) Wang et al.
(2007)
Wang and Singh MR = 1 +bt + at2 Sarimeseli
(2011)
Page MR = exp (- ktn) Lee and Kim
(2009) Logarithmic MR = a exp (- kt) + b Kingsly et al.
(2007) Midilli MR = a exp (- ktn) + bt Midilli et al.
(2002) where k is the drying constant (1/min) and a, b, n are equation constants
Mass Transfer Parameters
Moisture Diffusivity
The Fick’s diffusion equation developed for solid objects with spherical geometry by Crank (1975) was applied to the experimental data on the assump-tion that there is a uniform initial moisture distribu-tion and negligible external resistance. The equadistribu-tion is in the form (Duc et al., 2011):
2 2 em
2 2 2
n 0
D
6 1
MR exp n t
n r
(23)Simplifying by taking the first term of the series solution:
2 em
2 2
D 6
MR exp t
r
Quality, Performance Analysis, Mass Transfer Parameters and Modeling of Drying Kinetics of Soybean 147
Effective diffusivity is also typically calculated by using the slope of Eq. (24), namely, when a natu-ral logarithm of MR versus time was plotted, a
straight line was obtained with a slope of 2 em 2 D
r
.
Mass Transfer Coefficient
Kaya et al. (2010) described a procedure to de-termine the mass transfer coefficient as follow:
p
p V
hm ln (MR)
A t
(25)
For a symmetrically heated sphere, V/A is equal to the radius (Torki‑Harchegani et al., 2014), hence for the soybean seeds Eq. (25) can be simplified to:
m r
h ln (MR )
t
(26)
Due to variation of time and Ln(MR) during the process, the average value of hm along the whole moisture content profile was calculated using the following expression:
final initial
final initial
M m M
m av M
M
h (M)dM h
dM
(27)
Activation Energy
In this study, the Arrhenius equation was used in a modified form to illustrate the relationship between moisture diffusivity, mass transfer coefficient and ratio of the microwave output power density to sam-ple amount instead of the temperature for calculation of the activation energy as the temperature is not a measurable variable in the standard microwave oven used for the drying process (Raquel et al., 2012; Torki‑Harchegani et al., 2014).
ad o
m 0
E m
D D exp
P
(28)
am o m av 0
E m
h h exp
P
(29)
Experimental Uncertainty
Errors and uncertainties in the experiments can result from the environmental conditions, instrument
selection, reading, calibration etc. In the present study, temperatures, air velocity, mass losses and times were measured with the appropriate instruments indicated before and total uncertainties for all these parameters were calculated using the method described by Ak-pinar and Bicer (2005). The sensitivity of ture sensors was ±1.5 °C, reading errors for tempera-ture measurements were assumed as ±1.5 °C and errors due to transfer of the data to computer by a RS232 connection were ±1.5 °C. The sensitivity of the power analyzer used in measuring microwave power was ±0.1 W and the reading error was also assumed to be ±0.1 W. The sensitivity of the digital balance used in measuring mass losses and moisture of the sample was ±0.01 g and reading errors were ±0.01 g. The uncertainty caused from vibration of the timer was assumed to be ±0.02 s, errors from the periodic measuring was assumed to be ±0.1 s and the errors recording temperature data were ±0.1 s. The uncertainties involved in the measurement of parame-ters are presented in Table 2.
Table 2: Measurement uncertainties.
Parameter unit Value
Uncertainty in mass loss
measurement g ±0.5
Uncertainty in moisture quantity
measurement g ±0.0141
Uncertainty in the time
measurement s ±0.141
Uncertainty in microwave power
measurement W ±0.10
Uncertainty in temperature
measurement °C ±2.12
RESULTS AND DISCUSSION
Energy Aspects
the literature, although energy consumption for soy-bean seeds under fluidized bed and microwave-fluidized bed drying was studied by Darvishi et al. (2014b) and Khoshtaghaza et al. (2014), no mention was found about investigation of the energy con-sumption and drying efficiency for soybean seeds undergoing microwave treatment. Darvishi et al. (2014b) studied fluidized bed drying of soybean seeds and found that the specific energy consumption var-ied from 96.8 and 399.7 MJ/kg water for 140 ºC with 1.8 m/s and 80 ºC with 4.5 m/s air velocity, respec-tively. Khoshtaghaza et al. (2014) showed that the minimum energy required for microwave-fluidized bed drying of soybean kernels was 50.94 (MJ/kg
water), which occurred at 500 W, 80 °C and 1.8 m/s, while the maximum energy requirement was 338.76 MJ/kg water observed at 200 W, 4.5 m/s and 100 °C. The values obtained in this present study, were lower than the values obtained by Darvishi et al. (2014b) and Khoshtaghaza et al. (2014), because of the lower drying times required under microwave treatment.
Figure 3 shows the average values (and percent-age) of energy consumed in the sensible and evapo-ration (latent) periods of microwave drying of soy-bean seeds at different microwave powers. Accord-ing to the results, approximately 11.27 to 14.45 kJ of the total energy input is consumed by increasing the product temperature (sensible heat).
Figure 2: Energy aspects of soybean drying.
a–c Different superscripts in the same column indicate significant differences (P < 0.05) A Values in parenthesis show the standard deviations
33.70(±1. 96) 44.09(±1.57)
60.10(±2.21)62.89(±2.59)
66.00(±1.82)
ηen (%) = -4E-07P3 + 0.0003P2 +0.0453P +14.459
R2 = 0.9806
25.0 32.5 40.0 47.5 55.0 62.5 70.0
200 300 400 500 600
Microw ave pow er (W)
E
n
er
g
y
ef
fi
cie
n
cy
(%
) b
c
a
Quality, Performance Analysis, Mass Transfer Parameters and Modeling of Drying Kinetics of Soybean 149
Figure 3: Energy consumed in the sensible and evaporation (latent) periods for microwave drying of soybean.
Exergy Aspects
According to the results in Figure 4, the exergy ef-ficiency increased with increasing microwave power. This can be explained by the fact that the surface moisture evaporates very quickly due to high heat and mass transfer coefficients at high microwave power, resulting in decreased drying time and conse-quently lower exergy consumption. The values of exergy efficiency for microwave drying of soybean studied were found to range between 23.38 – 48.30%, while the energy efficiency (Figure 4) was higher for the same condition (P ≤ 0.05). These re-sults were similar to the rere-sults of others (Darvishi et al., 2104a, Akpinar et al., 2006; Erbay and Icier, 2010).
Results showed that the specific exergy loss de-creased with increasing microwave power (Figure 4; P<0.05). The values changed between 6.99 MJ/kg water and 2.54 MJ/kg water evaporation. These re-sults are in contrast to the findings of Darvishi et al. (2014a) for microwave drying of white mulberry. These situations can be explained by the effect of drying time. An analysis of variance showed that the effect of drying time on exergy loss is more the ef-fect of microwave power (p≤0.05). The drying time is longer under low microwave power levels, hence results in an increase in exergy entering to the drying chamber. For this reason, it was observed that, as the microwave power decreased, the energy losses in-creased, in other words microwave exergy efficiency values decreased.
Figure 4: Exergy aspects of soybean drying. a–c Different superscripts in the same column indicate
sig-nificant differences (P < 0.05)
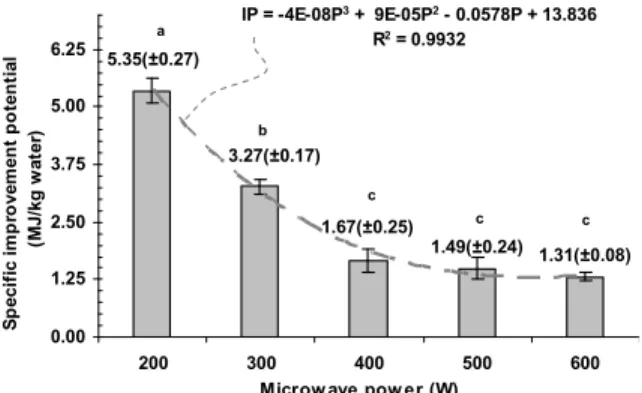
A Values in parenthesis show the standard deviations The average values of specific improvement po-tential are presented in Figure 5. As was expected, when the microwave power was increased, the exer-gy loss decreased, and the improvement potential 500 W 13.63kJ
18.18%
27.83kJ 37.11%
33.55kJ 44.72%
600 W
24.48kJ 34.0%
14.45kJ 20.07%
33.07kJ 45.92% 200 W
83.54kJ 66.30%
31.19kJ 24.76% 11.27kJ
8.94%
sensible period
evaporation (latent) period
energy loss
300 W
57.86kJ 55.91%
33.72kJ 32.58% 11.92 11.51%
400 W
31.12kJ 39.90%
12.83kJ 16.45%
34.05kJ 43.65%
23.38(±1.67) 31.30(±1.54)
43.20(±2.66)45.62(±2.75)
48.30(±1.80)
ηex (%) = -3E-07P3 + 0.0002P2 +0.0399P +8.345
R2 = 0.9829
15.0 22.5 30.0 37.5 45.0 52.5
200 300 400 500 600
Microw ave pow er (W)
E
xer
g
y
ef
fi
cien
cy
(%
)
b
c
a
c c
2.54(±0.10) 2.74(±0.39)
2.94(±0.38) 4.76(±0.20) 6.99(±0.27)
exloss = -3E-08P3 + 8E-05P2 - 0.0588P + 15.78
R2 = 0.9918
2.00 3.25 4.50 5.75 7.00 8.25
200 300 400 500 600
Microw ave pow er (W)
S
p
ecif
ic
exer
g
y
lo
ss
(M
J/kg
w
a
te
r)
b
c a
decreased from 5.35 to 1.31 MJ/kg water. The spe-cific improvement potential obtained in the drying process using 600 W was 4.08-fold lower than 200 W microwave power levels.
Figure 5: Average improvement potential at different microwave powers.
a–c Different superscripts in the same column indicate
sig-nificant differences (P < 0.05)
A Values in parenthesis show the standard deviations
Quality Aspects
The rehydration ratio of dried samples at 200– 900 W varied in the range of 0.618 – 0.799 and in-creased with increasing microwave power (Table 3). The rehydration ratio at high microwave power im-proves rehydration due to the effect of temperature on cell wall and tissue (Singh et al. 2006; Doymaz and Ismail 2011). This can be explained by the high internal pressure produced by microwave heating, which can cause the structure of soybean seeds to expand. Also, Khoshtaghaza et al. (2014) reported that microwave heating had a significant effect on the rehydration ratio of soybeans (0.695 to 0.819), because the heat applied during drying increased both hydration of the starch and elasticity of the cell walls, thereby increasing the water-holding capacity. Table 3 shows the colour parameters for dried soybean seeds as a function of microwave drying power. An increase in ΔE was observed with drying power. The total color change falls within the range
reported for fluidized bed drying of soybean (ΔE = 19.29–23.41) (Darvishi, 2013) but higher than that reported for near-infrared-fluidized bed dried soy-bean seeds (ΔE = 2.9–4.2) (Dondee et al., 2011). Mi-crowave drying pushes liquid onto the surface and the liquid is usually converted into vapour. This pro-cess results in drying without causing surface over-heating phenomena. Therefore, in terms of surface colour degradation, preservation of the product colour was good. It is estimated that the products are sub-jected to high temperature with increasing power levels during microwave drying. Therefore, the product colour is adversely affected in the drying processes at very high microwave powers (Ozkan et al., 2007).
The Hue angle values also increased from about 88.07 to 91.73 during drying processes (Table 3). It suggested a reduction from a more green (when Hue > 90°) to an orange-red (when Hue < 90°) colour of the dried seeds (Waliszewski et al., 1999). A larger value of the hue angle indicates a greater shift from red to yellow. Hawlader et al. (2006) stated that a decrease in hue angle values is an indication of more browning colour and a shifting away from yellow-ness, which is not the case in this study, where the values of hue angles increased with drying micro-wave powers, shifting towards yellow and red.
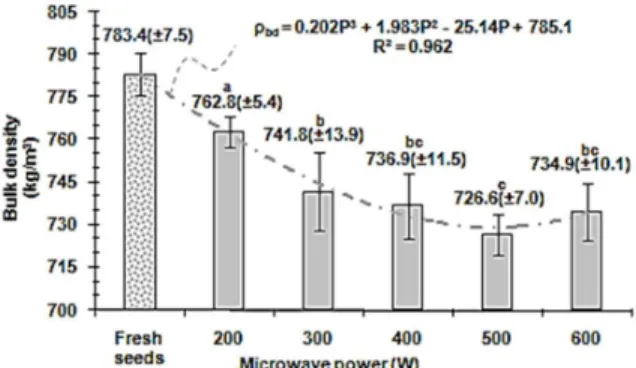
The variation of the bulk density at different mi-crowave powers is illustrated in Figure 6. They ranged from 726.6 to 762.8 kg/m3 for dried soybean seeds and decreased with increasing microwave power. Also, bulk density values for dried soybean were lower than the fresh soybean (783.4 kg/m3). The shrinkage varied from 0.860 to 0.948 over the microwave power range (Table 3). Shrinkage de-creased with increasing microwave power. During the drying process, water escapes the cell, causing a decrease in tension that the liquid exerts against the cell wall. This decrease in tension causes shrinkage of the materials (Hashemi et al., 2009; Janjai et al., 2010). Also, Mayor and Sereno (2004) reported that heating and loss of water cause stresses in the cellu-lar structure of the food and this leads to changes in shape and a decrease in dimensions.
Table 3: Different quality of soybean drying.
P (W) ΔE (-) h (degree) Shrinkage Rehydration ratio
200 14.68 (±2.59A)a 88.07 (±5.11)a 0.948 (±0.021)a 0.618 (±0.019)a
300 18.80 (±3.90)ab 90.52 (±3.14)a 0.897 (±0.024)b 0.716(±0.017)bc
400 18.13 (±3.54)ab 91.51 (±7.41)ab 0.885 (±0.034)b 0.745 (±0.027)c
500 19.61 (±7.46)ab 91.73 (±9.47)ab 0.860 (±0.011)bc 0.703 (±0.039)bc
600 19. 89 (±5.83)ab 90.85 (±3.16)ab 0.880 (±0.033)bc 0.799(±0.029)d
a–b Different superscripts in the same column indicate significant differences (P < 0.05) A Values in parenthesis showed their standard deviations
1.31(±0.08) 1.49(±0.24)
1.67(±0.25) 3.27(±0.17) 5.35(±0.27)
IP = -4E-08P3 + 9E-05P2 - 0.0578P + 13.836
R2 = 0.9932
0.00 1.25 2.50 3.75 5.00 6.25
200 300 400 500 600
Microw ave pow er (W)
S
p
eci
fi
c
i
m
p
ro
vem
e
n
t
p
o
te
n
ti
al
(M
J/
kg
w
a
te
r) b
c a
Quality, Performance Analysis, Mass Transfer Parameters and Modeling of Drying Kinetics of Soybean 151
Figure 6: Comparison between bulk density of fresh and dried soybean at different microwave powers. a–c Different superscripts in the same column indicate
sig-nificant differences (P < 0.05)
Drying Kinetics and Modeling
The changes in the moisture ratio of soybean with drying time are shown in Figure 7. It is clear that the moisture content decreases continuously with drying time. The moisture content of the samples was very high during the initial phase of the drying, which resulted in a higher absorption of microwave power and higher drying rates due to the higher moisture diffusion. As the drying progressed, the loss of mois-ture in the product caused a decrease in the absorp-tion of microwave power and resulted in a fall in the drying rate. Higher drying rates were obtained at higher microwave output powers. In other words, as the microwave output power was increased, the dry-ing time of samples was significantly decreased (P≤0.05). Examination of Figure 8 reveals that, in general, two distinct periods are identifiable, namely warming-up and falling rate periods. The initial short warming-up stage corresponds to sample heating, and consequently to non-isothermal drying condi-tions, this followed by a falling rate period. The presence of falling-rate drying behavior is indicative of a progressive increase in the internal resistance to both heat and mass transfer. This arises as a direct consequence of the absence of a complete surface of water. Rather, moisture movement from the interior to the surface must occur prior to surface evapo-ration. The drying time requirement at 200, 300, 400, 500, and 600 W was 10.5, 6.5, 3.25, 2.5 and 2 min respectively. By working at 600W instead of 200 W, the drying time was shortened by 81%. The drying time obtained in the present study was extremely low compared to the results obtained by Darvishi et al. (2014b) for fluidized bed drying of soybean (50-380 min), Dondee et al. (2011) for infrared-fluidized-bed drying (≥120 min), Darvishi et al. (2014b) for mi-crowave-fluidized bed drying (3.3-38.5 min), Rafiee
et al. (2009) for convective drying of soybean (70-210 min), Gowen et al. (2008) for microwave–hot-air drying (20-120 min), Sangkram and Noomhrom, (2002) for hot air drying (120-450 min).
Figure 7: Drying curves of soybean at various mi-crowave powers.
Figure 8: Variation of drying rates with moisture content soybean seeds.
The statistical results from models are summa-rised in Table 4. The statistical parameter estimations showed that R2, χ2 and RMSE values ranged from 0.8295 to 0.9997, 0.00004 to 0.13272, and 0.00060 to 0.34078, respectively. The level of χ2 as well as R2 for the Midilli and Page models were always very close to each other. Although the Midilli model showed the best fit among the selected models, the Page model was selected as the appropriate model for this research because it is simple with two parameters while the Midilli model has four parameters.
the Page model and the air temperature can be repre-sented as:
2
k0.0028 exp(0.0081P) R 0.991 (30)
5 2 2
n0.0782 0.011P 1.47 10 P R 0.904 (31)
Figure 9 compares the experimental data with the predicted ones using the Page model for soy-bean samples. The prediction using the Page model showed MR values distributed along a straight line, which proved the suitability of this model in describing the drying characteristics of soybean samples.
Table 4: Statistical analysis of the models fitted to the drying data for microwave drying soybean seeds.
Model P (W) Coefficients and constants R2 χ2 RMSE
Newton
200 k = 0.0664 0.9176 0.00328 0.05656
300 k = 0.1301 0.8583 0.00710 0.08249
400 k = 0.2147 0.8295 0.00892 0.09101
500 k = 0.2966 0.922 0.00467 0.06515
600 k = 0.4596 0.9601 0.00313 0.05277
Henderson and Pabis
200 a = 1.1224, k = 0.0827 0.9684 0.00168 0.03997
300 a = 1.1697, k = 0.1719 0.9336 0.00441 0.06358
400 a = 1.1775, k = 0.2873 0.9100 0.00658 0.07507
500 a = 1.1264, k = 0.3647 0.9485 0.00351 0.05362
600 a = 1.1036, k = 0.5291 0.9842 0.00209 0.04031
Page
200 k = 0.0154, n = 1.704 0.9977 0.00005 0.00690
300 k = 0.0256, n = 2.116 0.9980 0.00009 0.00913
400 k = 0.0601, n = 2.260 0.9974 0.00066 0.02386
500 k = 0.1762, n = 1.781 0.9992 0.00004 0.00572
600 k = 0.3791, n = 1.462 0.9940 0.00038 0.01726
Wang and Singh
200 b = -0.0301, a = -0.0016 0.9990 0.00270 0.05067
300 b = -0.0291, a = -0.0129 0.9889 0.00241 0.04701
400 b = -0.0239, a = -0.0468 0.9990 0.00164 0.03752
500 b = -0.1168, a = -0.0422 0.9940 0.00128 0.03232
600 b = -0.2959, a = - 1.012×10⁻⁹ 0.9819 0.00246 0.04370
Logarithmic
200 a = 1.505, b = -0.409, k = 0.0521 0.9777 0.00108 0.03169
300 a = 1.539, b = -0.395, k = 0.1114 0.9522 0.13272 0.34078
400 a = 1.392, b = -0.240, k = 0.2120 0.9231 0.00751 0.07682
500 a = 1.291, b = -0.183, k = 0.2861 0.9579 0.00304 0.04702
600 a = 1.314, b = -0.234, k = 0.3846 0.9881 0.00159 0.03252
Midilli
200 a= 0.994, b= 0.030, k= 0.019, n= 1.958 0.9990 0.00026 0.00560
300 a= 0.993, b= 0.025, k= 0.037, n= 2.069 0.9991 0.00019 0.01261
400 a= 0.995, b= 0.039, k= 0.092, n= 2.024 0.9995 0.00007 0.00714
500 a= 1.000, b= 0.002, k= 0.178, n= 1.781 0.9997 0.00006 0.00060
600 a= 1.009, b= 0.095, k= 0.556, n= 1.605 0.9993 0.00011 0.00807
Quality, Performance Analysis, Mass Transfer Parameters and Modeling of Drying Kinetics of Soybean 153
Moisture Diffusivity and Mass Transfer Coefficient
According to the results in Figure 10, the micro-wave power level had a significant effect on the moisture diffusivity of the soybean seeds, as ex-pected (P<0.05). Effective diffusivity varied from 1.99×10⁻⁹ to 12.25×10⁻⁹ m2/s and increased greatly with increasing microwave power. This might be explained by the increased heating energy, which would increase the activity of the water molecules, leading to higher moisture diffusivity when samples were dried at higher microwave power. These values fell within the normally expected range of Dem (10−11 to 10−9 m2/s) for food materials (Arumuganathan et al., 2009). The resultant values of Dem are com-parable to 6.25×10⁻¹⁰ to 42.14×10⁻¹⁰ m2/s mentioned for microwave-fluidized bed drying of soybean seeds (Khoshtaghaza et al., 20114); 1.22×10⁻¹⁰ to 2.86×10⁻¹⁰ m2/s for wheat (Mohapatra and Rao, 2005); 4.595×10⁻¹¹ to 3.325×10⁻¹⁰ m2/s for fluidized bed drying of soybean, (Darvishi et al., 2014b); 1.39×10⁻¹⁰ to 5.72×10⁻¹⁰ m2/s for hot air-infrared drying of green peas (Eshtiagh and Zare, 2015); and 1.79×10⁻¹⁰ to 5.87×10⁻¹⁰ m2/s for microwave drying of millet (Radhika et al., 2013). The values obtained in this study are higher than those found by Darvishi et al. (2014b) and Khoshtaghaza et al. (20114) for the fluidized bed and microwave-fluidized bed drying of soybean, respectively. This is due to the fact that drying by microwave power, which leads to higher temperatures, implied a larger driving force for heat transfer, as compared with fluidized bed or micro-wave-fluidized bed drying. In other words, in mi-crowave drying, the volumetric heat generation in the wet sample due to the directly transmitted and absorbed energy by the water molecules results in higher interior temperatures and increase the activity of water molecules, thus reaching the boiling point of water substantially faster than would be possible in convective drying. The rate of Dliquid/Dvapor was given as 1/10,000 by Reid et al. (1987). This value is important for the use of microwave dryers in the food industry and explains the higher total diffusivity obtained in this study at lower moisture content compared to the results obtained in fluidized bed drying. In the case of fluidized bed drying, the mois-ture is in liquid phase form in capillary vessels of seeds. All capillary vessels in seeds have different widths. The vapor occurring on the water surface in these capillary vessels is transported from the water surface to the fruit surface during drying. The vapor transport velocity in a narrow capillary vessel is higher than in a wide capillary vessel. Therefore, in the case of fluidized bed drying, water crosses
be-tween two different width capillary vessels. But, in the microwave drying, the amount of water crossing between vessels is lower than in fluidized bed drying. Since a material is heated intensely, the temperature gradient in the material is formed within a short period and vapor transportation in all different width vessels is higher than water crossing between capil-lary vessels (Caglar et al., 2009).
Figure 10: Variation of effective diffusivity for soy-bean with microwave power.
a–e Different superscripts in the same column indicate
sig-nificant differences (P < 0.05)
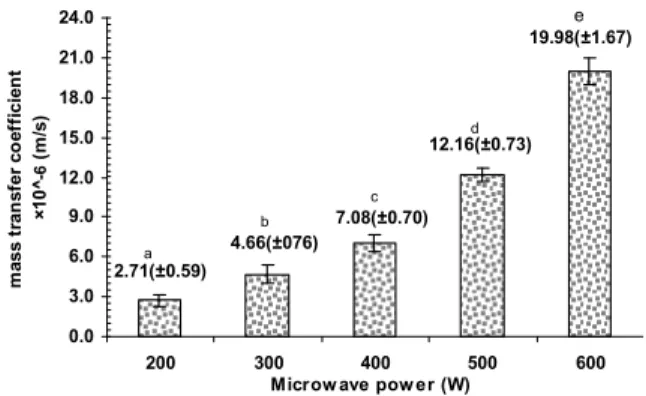
Figure 11 shows the changes of the mass transfer coefficient with microwave power. The values of the mass transfer coefficient vary from 2.71×10⁻⁶ m/s at 200 W to 19.98×10⁻⁶ m/s at 600 W. It is apparent that hm increased with the increase in microwave power. When samples were dried at higher power, increased heating energy would increase the activity of water molecules, resulting in a higher mass trans-fer rate (Thuwapanichayanan et al., 2011; Rhim and Lee, 2011). Additionally, these values are compara-ble to 5.13×10⁻⁷ to 27.8×10⁻⁶ m/s for drying of pumpkin (Raquel et al., 2012); 16.1x10⁻⁹ m/s for drying of okra (Dincer and Hussain, 2002), 20.9×10⁻⁷ to 32.8×10⁻⁶ m/s for drying potato slabs (McMinn et al., 2003), and 9.2×10⁻⁸ to 26.4 ×10⁻⁸ m/s for drying of banana (Queiroz and Nebra, 2001).
Activation Energy
The functions expressing the variations of Dm and hm versus the mass of sample/power [m0/P] are pre-sented in Figures 12-13. The activation energy values were found to be 4.98 W/g for the diffusion model and 5.33 W/g for the mass transfer model. These results indicate that the activation energy for the mass transfer model is higher than that for the diffusion model. These values are comparable to 13.6 W/g for pandanus leaves (Rayaguru and Routray, 2011), 14.19 W/g for pepper (Darvishi et al., 2014c),
1.99(±0.43)
4.31(±070)
6.48(±0.64) 8.69(±0.52)
12.25 (±1.02)
0.0 2.5 5.0 7.5 10.0 12.5 15.0
200 300 400 500 600
Microw ave pow er (W)
E
ff
e
ct
iv
e m
o
ist
u
re
d
if
fu
s
iv
it
y
×1
0
^
-9
(m
²/
s
)
a
b
c d
5.54 W/g for okra (Dadali et al., 2007), 12.284 W/g for mint leaves (Ozbek and Dadali, 2007), and 3.986 W/g for white mulberry (Darvishi et al., 2014a). The lower activation energy translates to higher moisture diffusivity or mass transfer coefficient in the drying process (Sharma and Prasad, 2004).
Figure 11: Effect of microwave power on mass transfer coefficient of soybean seeds.
a–e Different superscripts in the same column indicate
sig-nificant differences (P < 0.05)
Figure 12: Fitting of the experimental points to the Arrhenius relationship for the diffusion model.
Figure 13: Fitting of the experimental points to the Arrhenius relationship for the mass transfer model.
CONCLUSIONS
Moisture content of soybean kernel at harvest time is too high for storage, and needs to be reduced. In this research, energy and exergy analyses of dry-ing characteristics, quality and mass transfer parame-ters for microwave drying of soybean seeds were studied and the process was modeled. Results showed that values of the energy efficiency (33.70 to 66.0%) were higher than exergy efficiency (23.38 – 48.30%). The values of specific energy consumption and improvement potential varied from 4.93 to 9.11 MJ/kg water, and 1.31 to 5.35 MJ/kg water, respec-tively. Increasing the microwave power decreases both the shrinkage and bulk density of soybean. Colour analysis showed that the values of the pa-rameters ΔE and h increased with microwave power, shifting it towards yellow and red. The highest rehy-dration capacity (0.799) was recorded for the sam-ples dried at 600 W and the lowest (0.618) at 200 W. The moisture diffusivity and mass transfer coef-ficient varied from 1.99×10⁻⁹ to 12.25×10⁻⁹ m2/s and 2.71×10⁻⁶ to 19.98×10⁻⁶ m/s, respectively. The acti-vation energy was found to be 4.98 W/g and 5.33 W/g for the diffusion and mass transfer models, re-spectively. It is expected that this research will help growers reduce the cost of drying and obtain better quality dried soybeans. They are also usable in dryer design for scale up work.
NOMENCLATURE
a, b, n experimental constants Ap sample surface area, (m2) Cp specific heat capacity, (J/kg.K) D0 pre-exponential factor of the Arrhenius
equation, (m2/s)
Dem moisture diffusivity, (m2/s)
Dr drying rate, (kg water/kg dry matter, (s) Eab energy absorbed, (J)
Ead activation energy for the diffusion model, (W/g)
Eam activation energy for the mass transfer model, (W/g)
Eloss specific energy loss, (J/kg water) Eref energy reflected, (J) Etran energy transmition, (J)
Esc specific energy consumption, (J/kg water) ex specific exergy, (J/kg)
exevap rate of exergy evaporation, (J/s) EXloss specific exergy loss, (J/kg) EXref exergy reflected, (J) 19.98(±1.67)
12.16(±0.73)
7.08(±0.70) 4.66(±076)
2.71(±0.59)
0.0 3.0 6.0 9.0 12.0 15.0 18.0 21.0 24.0
200 300 400 500 600
Microw ave pow er (W)
m
a
ss
t
ran
s
fer
c
o
e
ff
icie
n
t
×1
0
^
-6
(m
/s
)
a
b
c d
e
hm = 37.344E-6 exp(-5.3305m /P) R2 = 0.9023
0.0 3.0 6.0 9.0 12.0 15.0 18.0 21.0 24.0
0.15 0.23 0.31 0.39 0.47 0.55 Mass of sam ple/Pow er (g/W)
M
a
ss
t
ra
n
sf
e
r c
o
e
ff
ici
en
t
×1
0
^
-6
(
m
/s
Quality, Performance Analysis, Mass Transfer Parameters and Modeling of Drying Kinetics of Soybean 155
EXtran exergy transmission, (J)
F0 Fourier number, (dimensionless) h hue angle, (degree)
h0 pre-exponential factor of the Arrhenius equation, (m/s)
hm mass transfer coefficient, (m/s) IP improvement potential, (J) k drying rate constant, (1/s) m mass of sample, (kg)
mt mass of sample at any time, (kg) m0 initial mass of sample, (kg) md mass of dry product, (kg) mw mass of evaporated water, (kg)
. w
m rate of evaporated water, (kg/s) M0 initial moisture content,
(kg water/kg dry matter) Me equilibrium moisture content,
(kg water/kg dry matter) Mt moisture content at any time,
(kg water/kg dry matter)
MR moisture ratio, (dimensionless) MRexp,i ith experimental moisture ratio MRpre,i ith predicted moisture ratio N number of observations
P microwave power, (W)
Pin microwave power emitted by the magnetron, (W)
r radius of sample, (m) R2 coefficient of determination RMSE root mean square error
Rr Rehydration ratio
Sh shrinkage, (-)
t time, (s)
T temperature, (K)
To ambient temperature, (K) Tp temperature of product, (K) Vc volume of the cylinder, (m3) Vd volume of the dry sample, (m3) Vf volume of the fresh sample, (m3) Vp sample volume, (m3)
z number of constants in the drying model
Greek Symbols
ηen energy efficiency, (%) ηex exergy efficiency, (%)
λfw latent heat of free water, (J/kg) λwp latent heat of product, (J/kg) ρb bulk density, (kg/m3)
E
total colour change
REFERENCES
Aboltins, A., Theoretical study of material drying coefficient. Engineering for Rural Development, Jelgava, 5, 23-24 (2013).
Akpinar, E. K. and Bicer, Y., Modelling of the drying of eggplants in thin-layers. International Journal of Food Science and Technology, 40, 273-281 (2005). Akpinar, E. K., Midilli, A. and Bicer, Y., The first
and second law analyses of thermodynamic of pumpkin drying process. Journal of Food Engi-neering, 72(4), 320-331 (2006).
Al-Harahsheh, M., Al-Muhtaseb, A. H. and Magee, T. R. A., Microwave drying kinetics of tomato pomace: Effect of osmotic dehydration. Chemical Engineering and Processing, 48, 524-531 (2009). Alibas, I., Microwave, air and combined microwave–
air-drying parameters of pumpkin slices. LWT– Food Science and Technology, 40, 1445-1451 (2007).
Arumuganathan, T., Manikantan, M. R., Rai, R. D., Anandakumar, S. and Khare, V., Mathematical modeling of drying kinetics of milky mushroom in a fluidized bed dryer. International Agrophys-ics, 23, 1-7 (2009).
Azadbakht, M., Khoshtaghaza, M. H., Ghobadian, B. and Minaei, S., Thermal properties of soybean pod as a function of moisture content and tempera-ture. American Journal of Food Science and Technology, 1(2), 9-13 (2013).
Bondaruk, J., Markowski, M. and Blaszczak, W., Effect of drying conditions on the quality of vac-uum-microwave dried potato cubes. Journal of Food Engineering, 81, 306-312 (2007).
Caglar, A., Togrul, I. T. and Togrul, H., Moisture and thermal diffusivity of seedless grape under infra-red drying. Food and Bioproducts Processing, 87, 292-300 (2009).
Celma, A. R., Cuadros, F. and López-Rodríguez, F., Convective drying characteristics of sludge from treatment plants in tomato processing industries. Food and Bioproducts Processing, 90(2), 224-234 (2012).
Crank J., The Mathematics of Diffusion. Clarendon, Oxford (1975).
da Silva, W. P., da Silva, C. M. D. P., de Almeida Gama, F. J. and Gomes, J. P., An empiric equation for the latent heat of vaporization of moisture in bananas during its isothermal drying. Agricultural Science, 3 (2), 214-220 (2012).
25(5), 917-924 (2007).
Darvishi, H., Development of Combined Fluidized-Bed / Microwave Dryer and Optimization of Soybean Drying Thermal Process. Ph.D Thesis, Tarbiat Modaers University, Tehran, Iran (2013). Darvishi, H., Khoshtaghaza, M. H. and Minaee, S.,
Fluidized bed drying characteristics of soybeans. Journal of Agricultural Science and Technology, 16(5), 1017-1031 (2014).
Darvishi, H., Rezaeiasl, A., Asghari, A., Azadbakht, M., Najafi, G. and Khodaei, J., Study of the dry-ing kinetics of pepper. Journal of the Saudi So-ciety of Agricultural Sciences, 13(2), 130-138 (2014c).
Darvishi, H., Zarein, M., Minaei, S. and Khafajeh, H., Exergy and energy analysis, drying kinetics and mathematical modeling of white mulberry drying process. International Journal of Food En-gineering, 10(2), 269-280 (2014a).
Dincer, I. and Hussain, M. M., Development of a new Bi–Di correlation for solids drying. Interna-tional Journal of Heat and Mass Transfer, 45(15), 3065-3069 (2002).
Dincer, I. and Sahin, A. Z., A new model for thermo-dynamic analysis of a drying process. Interna-tional Journal of Heat and Mass Transfer, 47(4), 645-652 (2004).
Dondee, S., Meeso, N., Soponronnarit, S. and Siri-amornpun, S., Reducing cracking and breakage of soybean grains under combined near-infrared ra-diation and fluidized-bed drying. Journal of Food Engineering, 104(1), 6-13 (2011).
Doymaz, I. and İsmail, O., Drying characteristics of sweet cherry. Food and Bioproducts Processing, 89(1), 31-38 (2011).
Doymaz, I., Infrared drying of sweet potato ( Ipo-moea batatas L.) slices. Journal of Food Science and Technology, 49(6), 760-766 (2012).
Duc, L. A., Han, J. W. and Keum, D. H., Thin layer drying characteristics of rapeseed (Brassica na-pus L.). Journal of Stored Products Research, 47(1), 32-38 (2011).
Erbay, Z. and Icier, F., A review of thin layer drying of foods: theory, modeling, and experimental re-sults. Critical Reviews in Food Science and Nu-trition, 50, 441- 464 (2010).
Eshtiagh, A. and Zare, D., Modeling of thin layer hot air-infrared drying of green peas. Agric Eng Int: CIGR Journal, 23(4), 246-258 (2015).
Gowen, A. A., Abu-Ghannam, N., Frias, J. and Oliveira, J., Modeling dehydration and rehydra-tion of cooked soybeans subjected to combined
microwave–hot-air drying. Innovative Food Sci-ence and Emerging Technologies, 9, 129-137 (2008).
Hall, C. W., Drying and Storage of Agricultural Crops. AVI Publication Company, Inc., Westport, Connecticut (1990).
Hammond, G. P. and Stapleton, A. J., Exergy analy-sis of the United Kingdom energy system. Pro-ceedings of the Institution of Mechanical Engi-neers, 215(2), 141-162 (2001).
Hashemi, G., Mowla, D. and Kazemeini, M., Mois-ture diffusivity and shrinkage of broad beans dur-ing bulk drydur-ing in an inert medium fluidized bed dryer assisted by dielectric heating. Journal of Food Engineering, 92, 331-338 (2009).
Hawlader, M. N. A., Perera, C. O. and Tian, M., Properties of modified atmosphere heat pump dried foods. Journal of Food Engineering, 74, 392-401 (2006).
Icier, F., Colak, N., Erbay, Z., Hanciglu, E. and Hep-bali, A., A comparative study on exergetic effi-ciency of two different drying processes. Tarim Makinalari Bilimi Dergisi, 4(3), 279-284 (2008). Janjai, S., Mahayothee, B., Lamlert, N., Bala, B. K.,
Precoppe, M., Nagle, M. and Muller, J., Diffusivi-ty, shrinkage and simulated drying of litchi fruit (Litchi Chinensis Sonn.). Journal of Food Engi-neering, 96, 214-221 (2010).
Jindarat, W., Rattanadecho, P. and Vongpradubchai, S., Analysis of energy consumption in microwave and convective drying process of multi-layered porous material inside a rectangular wave guide. Experimental Thermal and Fluid Science, 35(4), 728-737 (2011).
Kaya, A., Aydin, O. and Dincer, I., Comparison of experimental data with results of some drying models for regularly shaped products. Heat Mass Transfer, 46, 555-562 (2010).
Khoshtaghaza, M. H., Darvishi, H. and Minaei, S., Effects of microwave - fluidized bed drying on quality, energy consumption and drying kinetics of soybean kernels. Journal of Agricultural Sci-ence and Technology, 16, 1017-1031 (2014). Kingsly, R. P., Goyal, R. K., Manikantan, M. R. and
Ilyas, S. M., Effects of pretreatments and drying air temperature on drying behavior of peach slice. International Journal of Food Science and Tech-nology, 42, 65-69 (2007).
Quality, Performance Analysis, Mass Transfer Parameters and Modeling of Drying Kinetics of Soybean 157
Mayor, L. and Sereno, A. M., Modeling shrinkage during convective drying of food material: A re-view. Journal of Food Engineering, 18, 373-386 (2004).
McMinn, W. A. M., Khraisheh, M. A. M. and Magee, T. R. A., Modelling the mass transfer during con-vective, microwave and combined microwave-convective drying of solid slabs and cylinders. Food Research International 36, 977-983 (2003). Midilli, A., Kucuk H. and Yapar Z., A new model for
single layer drying. Drying Technology, 20(7), 1503-1513 (2002).
Mohapatra, D. and Rao, S. P., A thin layer drying model of parboiled wheat. Journal of Food Engi-neering, 66 (4), 513-518 (2005).
Orsat, V., Yang, W., Changrue, W. and Raghavan, G. S. V., Microwave-assisted drying of biomaterials. Food and Bioproducts Processing, 85(C3), 255-263 (2007)
Ozbek, B. and Dadali, N., Thin-layer drying charac-teristics and modelling of mint leaves undergoing microwave treatment. Journal of Food Engineer-ing, 83, 541-549 (2007).
Ozkan, I. A., Akbudak, B. and Akbudak, N., Micro-wave drying characteristics of spinach. Journal of Food Engineering, 78, 577-583 (2007).
Pfeifer, A. A., Murata, V. V. and Barrozo, M. A. S., Modelling of soybean seed drying in concurrent sliding bed dryers: Effect of the number of stages on the seed quality and drying performance. Bio-systems Engineering, 107, 341-348 (2010). Prasad, S. and Sharma, G. P., Effective moisture
diffusivity of onion slices undergoing infrared convective drying. Biosystems Engineering, 93 (3), 285-291(2006).
Prommas, R., Rattanadecho, P. and Jindarat, W., Energy and exergy analyses in drying process of non-hygroscopic porous packed bed using a com-bined multi-feed microwave-convective air and continuous belt system (CMCB). International Communications in Heat and Mass Transfer, 39, 242-50 (2012).
Queiroz, M. R. and Nebra, S. A., Theoretical and experimental analysis of the drying kinetics of bananas. Journal of Food Engineering, 47, 127-132 (2001).
Radhika, G. B., Satyanarayana, S. V. and Rao, D. G., An investigation on drying of millets in a micro-wave oven. International Journal of Emerging Technology and Advanced Engineering, 3, 583-589 (2013).
Raquel, P. F. G., Henrriques, F. and Barroca, M. J., Mass transfer coefficients for the drying of pumpkin (Cucurbita moschata) and dried product
quality. Food Bioprocess Technology, 5(1), 176-183 (2012).
Rayaguru, K. and Routray, W., Microwave drying kinetics and quality characteristics of aromatic Pandanus amaryllifolius leaves. International Food Research Journal, 18, 1035-1042 (2011). Reid, R. C., Prausnitz, J. M. and Poling, B. E., The
Properties of Gases and Liquids. (4th Ed.). McGraw-Hill, New York (1987).
Rhim, J. W. and Lee, H., Drying kinetics of whole and sliced shiitake mushrooms (Lentinus edodes). Food Science and Biotechnology, 20(2), 419-427 (2011).
Sangkram, U. and Noomhorm, A., The effect of dry-ing and storage of soybean on the quality of bean, oil, and lecithin production. Drying Technology, 20 (10), 2041-2054 (2002).
Sarimeseli, A., Microwave drying characteristics of coriander (Coriandrum sativum L.) leaves. Ener-gy Conversion and Management, 52, 1449-1453 (2011).
Sharma, G. P. and Prasad, S., Effective moisture diffusivity of garlic cloves undergoing micro-wave-convective drying. Journal of Food Engi-neering, 65, 609-617 (2014).
Sharqawy, M., John, H. L. V. and Syed, M. Z., The thermo physical properties of seawater: A review of existing correlations and data. Desalination and Water Treatment, 16, 354-380 (2010)
Singh, S., Raina, C. S., Bawa, A. S. and Saxena, D. C., Effect of pretreatments on drying and de-hydration kinetics and colour of sweet potato slice. Drying Technology, 24(10), 1487-1494 (2006).
Soysal, A., Oztekin, S. and Eren, O., Microwave drying of parsley: Modelling, kinetics, and energy aspects. Biosystems Engineering, 93(4), 403-413 (2006).
Thuwapanichayanan, R., Prachayawarakorn, S., Kunwisawa, J. and Soponronnarit, S., Determina-tion of effective moisture diffusivity and assess-ment of quality attributes of banana slices during drying. LWT - Food Science and Technology, 44, 1502-1510 (2011).
Torki-Harchegani, M., Ghanbarian, D. and Sadeghi, M., Estimation of whole lemon mass transfer pa-rameters during hot air drying using different modeling methods. Heat Mass Transfer, 51(8), 1121-1129 (2014).
Waliszewski, K. N., Cortes, H. D., Pardio, V. T. and Garcia, M. A., Color parameter changes in banana slices during osmotic dehydration. Drying Tech-nology, 17, 955-960 (1999).
Wang, J. and Sheng, K., Far-infrared and micro-wave drying of peach. LWT - Food Science and
Technology, 39, 247-255 (2006).