Analysis of the availability of the resources necessary for urgent
and emergency healthcare in São Paulo between 2009-2013
SILVANA HEBE COIMBRA1*, ELIETE DOMINGUEZ LOPEZ CAMANHO2, LINDOLFO CARLOS HERINGER1, RICARDO VIEIRA BOTELHO1,
CIDIA VASCONCELLOS1
1Graduate Program, Instituto de Assistência Médica ao Servidor Público Estadual, São Paulo, SP, Brazil 2Fundação para o Desenvolvimento Cientíico e Tecnológico da Odontologia, São Paulo, SP, Brazil
S
UMMARYStudy conducted by the Health Sciences Graduate Program at Instituto de Assistência Médica ao Servidor Público Estadual, São Paulo, SP, Brazil
Article received: 10/11/2016
Accepted for publication: 11/20/2016
*Correspondence:
Address: Av. Ibirapuera, 981, Cedep, 2º andar São Paulo, SP – Brazil Postal code: 04029-000 [email protected]
http://dx.doi.org/10.1590/1806-9282.63.06.538
Introduction: The Regulatory Complex is the structure that operationalizes actions for making resources available to meet the needs of urgent and emergency care in the municipality of São Paulo. In the case of urgent care, needs are immediate and associated with high morbidity and mortality.
Objective: To identify the most frequently requested resources, the resolution capacity and the mortality rate associated with the unavailability of a certain resource.
Method: Our study was based on data from medical bulletins issued by the Urgent and Emergency Regulation Center (CRUE) in the city of São Paulo from 2009 to 2013.
Results: 91,823 requests were made over the ive years of the study (2009 to 2013). Neurosurgery requests were the most frequent in all years (4,828, 5,159, 4,251, 5,008 and 4,394, respectively), followed by computed tomography (CT) scans, adult intensive care unit (ICU) beds, cardiac catheterization, and pediatric ICU beds. On average, requests for neurosurgery, adult ICU, pediatric ICU, CT scans, catheterization and vascular surgery were answered in 70%, 27%, 39%, 97%, 87% and 77% of cases. The total number of deaths relating to requests for neurosurgery, CT scans, adult ICU, pediatric ICU, catheterization and vascular surgeon assessment were 182, 9, 1,536, 1,536, 135, 49 and 24 cases, respectively.
Conclusion: There is a lack of resources to meet urgent and emergency needs in
the city of São Paulo.
Keywords: health systems, health care coordination and monitoring, emergency medical services, health care (public health), uniied health system, neurosurgery.
I
NTRODUCTIONThe metropolitan areas of large urban centers require a large amount of resources for the treatment of the population’s health.1 In urgent and emergency cases, these needs are immediate due a high morbidity and mortality.2-4
The Regulatory Complex is the structure that opera-tionalizes actions for making resources available to a particular population, providing them according to pre-established criteria and protocols to be followed. It was created to ensure access to the resources by the many existing demands.5
In this sense, “regulation” means the intermediation of actions to improve access in a planned manner, in order to reduce shortfalls in the pursuit of eficiency, qual-ity and effectiveness.6
The Municipal Regulatory Complex of São Paulo is administrated by the Municipal Health Department (SMS)
and regulates the population’s access to health resources in the city of São Paulo.7
O
BJECTIVETo identify the need for the most frequently requested resources, the resolution capacity and mortality rate as-sociated with the unavailability of the resource and trends throughout the years of our study.
M
ETHODOur study was based on data from medical bulletins issued by the Urgent and Emergency Regulation Center (CRUE) in the city of São Paulo from 2009 to 2013.
Variables included
The need for urgent and emergency resources
The six most frequently requested resources for emer-gency care in the city of São Paulo (absolute igures) in the ive years of the study were tabulated. Absolute igures and proportions for the other requested resources were described, as well as the trends per year.
Resolution of requests
Resolution capacity was deined by the number of cases resolved and their percentage in relation to the number of requests. These were described per year of the study.
Deaths per type of request
The number of deaths related to certain request and the percentage in relation to the number of requests and their trends per year were described. Deaths were noted as one of the types of outcomes (resolution) of the request.
Use of the Zero Vacancy (“Vaga Zero”) tool
A separate analysis of the Zero Vacancy tool used for care requiring neurosurgical evaluation. The Zero Vacancy tool is based on the Federal Board of Medicine (CFM) no. 1671/03, published in the Federal Oficial Gazette in July 2003, in accordance with MS (Ministry of Health) Ordi-nance no. 2048/2002. It states that, even in situations where there are no vacant beds for patient hospitalization, the hospital unit must still guarantee care. From the point of view of urgent and emergency care, there is a tool for access of patients at imminent death risk in the case of inexistent local resources or the refusal of the evaluation from the referencial service. Therefore, the amount of care provided with the Zero Vacancy tool was recorded as an increasing percentage over the years of study.
Trends were evaluated between the years of the study in the resource requests, resolution of resources and fatal-ity trends (deaths).
Statistical analysis
EPI INFO 6.0 software and Excel spreadsheets were used. Data treatment and analysis was performed descrip-tively, with numbers and percentages.
R
ESULTSNeed for resources Largest resource requests
A total of 91,258 requests were made over the ive years of the study (2009 to 2013).
The six largest requests were described per year of the study (Figure 1).
Neurosurgery requests were the most frequent in all years. Between 2009 and 2013, 4,828, 5,159, 4,251, 5,008 and 4,394 requests were made, respectively.
CT scan requests were the second most frequent. The type of CT scan most frequently requested was skull. The number of requests per year was 2,946, 2,612, 2,287, 1,641 and 3,106, respectively.
Adult intensive care unit (ICU) beds were the third most frequent request, totaling 2,809, 3,164, 1,869, 1,691 and 1,496, respectively, over the years studied.
The request for cardiac catheterization appeared in the year 2010 for the irst time on record, as the fourth most frequent request. Between 2009 and 2013, 811, 1,041, 1,803 and 1,146 examinations were requested, respectively.
Pediatric ICU admission was the ifth cause of requests. These occurred at a frequency of 897, 1,002, 822, 818 and 686, respectively. Other less frequent requests were de-scribed in Figure 1.
Resolutions of requests
The resolution of the requested resources were described in absolute igures and as a proportion of the resolutions in relation to the requested resource, over the ive years of the study (Figure 1).
Requests for neurosurgery, adult ICU, pediatric ICU, CT scans, catheterization and vascular surgery were an-swered (resolved) in 70%, 27%, 39%, 97%, 87% and 77% of cases, respectively.
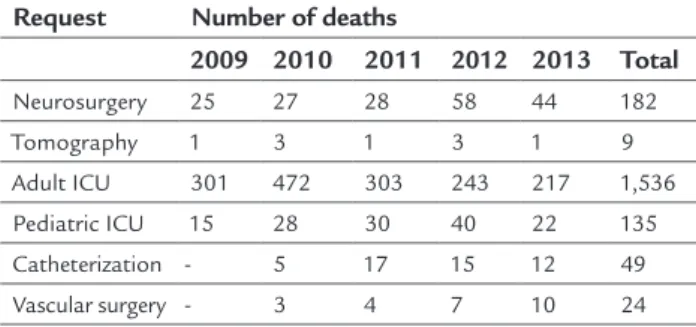
Deaths by type of unanswered request (Table 1)
Over the ive years of the study, the total number of deaths relating to requests for neurosurgery, CT scans, adult ICU, pediatric ICU, catheterization and vascular surgeon assessment were 182, 9, 1,536, 135, 49 and 24 cases, respectively.
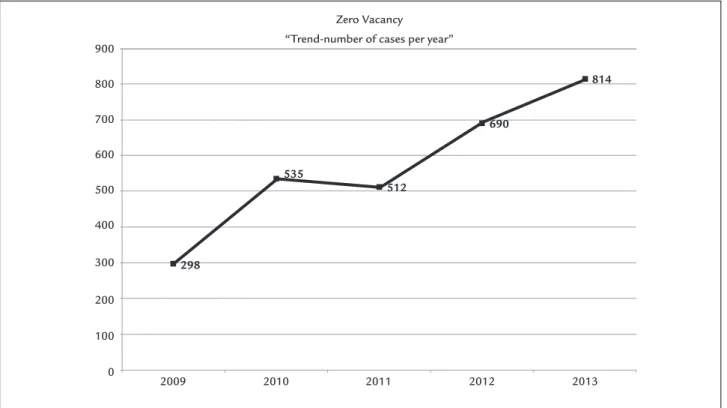
Use of the Zero Vacancy tool
The Zero Vacancy tool was used 298, 535, 512, 690 and 814 times in the years 2009 to 2013, respectively (Figure 2).
TABLE 1 Number of deaths/year (per type of request).
Request Number of deaths
2009 2010 2011 2012 2013 Total
Neurosurgery 25 27 28 58 44 182
Tomography 1 3 1 3 1 9
Adult ICU 301 472 303 243 217 1,536 Pediatric ICU 15 28 30 40 22 135
Catheterization - 5 17 15 12 49
FIGURE 1 Trends in resources requested and delivered from 2009 to 2013.
Neuro: neurosurgery; A ICU: adult ICU; Tomo: CT scan; Ped ICU: pediatric ICU; Endosc: endoscopy; Angio: angiography; Vasc: vascular surgery; Maxillo: oral and maxillofacial surgery. Resources requested x delivered
6,000
5,000
4,000
3,000
2,000
1,000
0
2009
Requests Deliveries
2010 2011 2012 2013
Neuro A ICU
P
ed ICU Tomo Endosc Maxillo Neuro A ICU Ped ICU Tomo Angio V
asc
Neuro A ICU
P
ed ICU Tomo Angio V
asc
Neuro A ICU
P
ed ICU Tomo Angio V
asc
Neuro A ICU
P
ed ICU Tomo Angio V
asc
FIGURE 2 Trends in neurosurgery request resolution, such as Zero Vacancy, per year.
Zero Vacancy
“Trend-number of cases per year” 900
800
700
600
500
400
300
200
100
0
2009 2010
298
535
512
690
814
Trends
Trends in resource requests
The requests for neurosurgery remained high throughout the period but stable, with no upward or downward trends. Catheterization requests also remained stable (Figure 1). Tomography and adult ICU beds had a decrease in requests. In 2009, 2,946 tomography scans were request-ed, and 1,641 in the year 2013. In 2009, 2,809 beds were requested at the adult ICU, while in 2013 this number was 1,496. Vascular surgery had an increase of 4.7 times in the number of requests over the ive years studied (Figure 1).
Trends in resource resolutions
There was a trend towards a decrease in resolutions for neurosurgery. The percentage of resolutions in the other requests was stable. The resolution percentage related to the need for pediatric and adult ICU resources was very low, at 39 and 27%, respectively.
Trends in mortality (Table 1)
The average mortality rate associated with the need for adult ICU is 8.4 times that of neurosurgery. The trend of fatality rates in the adult ICU, although high, decreased between 2010 to 2013, falling from 472 deaths to 217. The mortality of neurosurgery and vascular surgery shows
an upward trend over the period.
Trends in the use of the Zero Vacancy tool
The Zero Vacancy tool was used more times in 2013 than in 2009, thus showing an upward trend of use (Figure 2). This trend increased inversely with the availability of the “neuro-surgery” resource at the CRUE of São Paulo.
D
ISCUSSIONIn Brazil, the annual investment in the health area is 4.1% of the gross domestic product (GDP), which is considered insuficient in providing care and access for all.1
At the time of the study, the city of São Paulo, Brazil’s most populous city, had a population of 10,886,518 in-habitants, and was 9th in total area.2
The implementation of the Regulatory Complex was undertaken to prioritize the low of care and reconcile the needs with the capacity of each health unit.6 The CRUE-SP regulates the inter-hospital low of emergency care in the city of São Paulo for diagnosis, clinical evalu-ation, surgical or ICU needs linked to the public health-care system (SUS). It is estimated that the absence of the CRUE’s intervention in the regulation would lead to greater mortality among patients.
In order to evaluate the capacity to meet the needs of urgencies and emergencies in the years 2009 to 2013, we investigated the most frequent requests. Neurosurgery evaluation (NCR), vascular surgery evaluation, CT scans, adult ICU, catheterization and pediatric ICU were the greatest care needs.
Tomography requests were met in 98 to 99% of cases. The lack of local imaging resources implies the need for referral to the Regulation Center in order to remedy these local shortcomings, as recommended by the Organization for Economic Cooperation and Development (OECD).8
Catheterization requests were incorporated into the CRUE-SP in 2010 and met in 80 to 88% of cases.
Adult ICU requests were only met in 20.8 to 36% of requests, due to lack of resources.
For the pediatric ICU, there was an average request resolution of 40% of requests.
The resource most often requested among all was the neurosurgical service. There is a lack of neurosurgical care in the network.9 Head trauma and stroke are a frequent cause of demand for imaging examinations for diagnosis, intensive care, neurosurgical evaluation and treatment. These are serious conditions, with a high potential for morbidity and mortality.10
A discussion on the trends in the provision of resources and their consequences is required. The mortality of the most requested resource, that is, neurosurgery, increased in 2012 and 2013. Resolution of the neurosurgery resource has been gradually decreasing and the use of the Zero Va-cancy tool has been increasing, probably to resolve the demand for the latter. We do not have information on the prognosis of patients cared for under the Zero Vacancy tool. Mortality related to lack of cardiac catheterization has decreased, probably due to greater supply of the re-source through centers that carry out the procedure con-tracted by the SMS.
Mortality due to lack of vascular surgery continued increasing in the years investigated.
Less frequent needs such as oral and maxillofacial surgery, endoscopy etc., which only appeared among the most frequent requests in the irst year, also deserve the attention of speciic studies.
Knowledge of the real needs of the population has not been established since SMS Ordinance 245/2007.11 The study and mapping of these needs has the potential to reveal the lack of resources and the risks to the population, in order to guide the allocation of the necessary resources.
C
ONCLUSIONThe most requested resource was neurosurgery, followed by CT scans, adult ICU beds, cardiac catheterization and pediatric ICU beds. There was a downward trend in neu-rosurgery resolutions associated with increased use of the Zero Vacancy resource. Resolution of pediatric and adult ICU needs was low. There was signiicant mortality as-sociated with the lack of resources.
C
ONFLICT OF INTERESTThe authors declare no conlict of interest.
R
ESUMOAnálise da disponibilidade de recursos necessários para o atendimento de urgência e emergência em saúde no município de São Paulo entre 2009-2013
Introdução:O Complexo Regulador é a estrutura que operacionaliza as ações de acesso aos recursos para aten-dimento de urgência e emergência médicas no município de São Paulo. Nas urgências, as necessidades são imedia-tas e associadas a elevada morbidade e mortalidade.
Objetivo:Identiicar os recursos mais frequentemente
solicitados, a capacidade de resolução e o índice de mor-talidade associado à falta do recurso.
Método:Este trabalho foi baseado nos dados dos bole-tins médicos da Central de Regulação de Urgência e Emergência (CRUE) do Município de São Paulo, nos anos de 2009 a 2013.
Resultados:Foram feitas 91.823 solicitações nos cinco anos do estudo (2009 a 2013). As solicitações de neuroci-rurgia foram as mais frequentes em todos os anos (4.828, 5.159, 4.251, 5.008 e 4.394, respectivamente), seguidas pela tomograia, vaga de UTI adulto, cateterismo cardíaco e UTI
pediátrica. Em média, os pedidos de neurocirurgia, UTI adulto, UTI infantil, tomograia, cateterismo e cirurgia vascular foram atendidos em 70%, 27%, 39%, 97%, 87% e 77% dos casos. O número total de óbitos associados à falta de recurso para neurocirurgia, tomograia, UTI adulto, UTI infantil, cateterismo e avaliação de cirurgião vascular foram de 182, 9, 1.536, 135, 49 e 24 casos, respectivamente.
Conclusão:Há elevada falta de recursos para
suprimen-to das necessidades de urgência e emergência no municí-pio de São Paulo.
Palavras-chave: sistemas de saúde, regulação e
iscaliza-ção em saúde, serviços médicos de emergência, serviços de saúde, sistema único de saúde, neurocirurgia.
R
EFERENCES1. Paulus Júnior A, Cordoni Júnior L. Políticas públicas de saúde no Brasil. Espaço Saúde. 2006; 8(1):13-9.
2. Barbosa DV. Regulação médica do luxo das urgências: análise do complexo regulador de Goiânia [dissertation]. Anápolis (GO): UNIEVANGÉLICA – Centro Universitário de Anápolis; 2012.
3. Dallari SG, Pittelli SM, Pirotta WR, Oliveira ML. Atendimento médico e urgência na grande São Paulo. Saúde Soc. 2001; 10(2):75-99.
4. Martins EFF. Avaliar o cumprimento do protocolo nacional de traumatismo crânio-encefálico no serviço de urgência do hospital de Santo António [dissertation]. Porto (Portugal): Instituto de Ciências Biomédicas de Abel Salazar, Universidade do Porto; 2011. Available from: https://repositorio-aberto.up.pt/bitstream/10216/52783/2/Tese%20Mestrado%20%20 Eduarda%20Martins%20texto%20corrido.pdf.
5. Brasil. Ministério da Saúde. Portaria nº 373, de 27 de fevereiro de 2002. Available from: http://bvsms.saude.gov.br/bvs/sadelegis/gm/2002/ prt0373_27_02_2002.html
6. Paim J, Travassos C, Almeida C, Bahia L, Macinko J. The Brazilian health system: history, advances, and challenges. Lancet. 2011; 377(9779):1778-97. 7. Brasil. Ministério da Saúde. Portaria nº 1.559, de 1 de agosto de 2008. Available from: http://bvsms.saude.gov.br/bvs/saudelegis/gm/2008/ prt1559_01_08_2008.html
8. Santos DL, Leite HJ, Rasella D, Silva SA. Capacidade de produção e grau de utilização de tomógrafo computadorizado no Sistema Único de Saúde. Cad Saúde Pública. 2014; 30(6):1293-304.
9. Brasil. Ministério da Saúde. Secretaria de Vigilância à Saúde. Instituto Brasileiro de Geograia e Estatística – IBGE. Sistema de informações de mortalidade 2013. Available from: http://ces.ibge.gov.br/base-de-dados/metadados/ ministerio-da-saude/sistema-de-informacoes-de-mortalidade-sim. 10. Martins SCO, Seewald RA, Brondani R, Alves CV. Doença cerebrovascular.
In: Chaves MF, Finkelsztejn A, Stefani MA, editors. Rotinas em neurologia e neurocirurgia. Porto Alegre: Artmed; 2008. p. 93-6.