SAGE Open
July-September 2013: 1 –12 © The Author(s) 2013 DOI: 10.1177/2158244013497721 sgo.sagepub.com
Article
Introduction
In 2012, there were 34 million people living with HIV glob-ally. However, 23.5 million (69%, 1 in every 20 adults) of them resided in Sub-Saharan Africa (SSA; UNAIDS, 2012). The HIV/AIDS pandemic spans more than three decades and most Kenyans are at high risk of acquiring HIV despite the intensified educational programs to combat the disease. Kenya continues to experience a high prevalence of HIV (7%), and there are ongoing programs that seek to increase voluntary counseling and testing (VCT) services (Cheluget et al., 2006). Understanding the role of media in programs geared toward “scaling-up” HIV/AIDS testing is very crucial, because differ-ent populations in Kenya obtain media information from dif-ferent channels of communication. Global HIV/AIDS funding to Kenya proportionally has increased through the years. The funding has resulted in increased VCT sites in the country (National AIDS and STD Control Programme [NASCOP], 2001); however, has not yet expanded VCT especially among Kenyans. This is because the majority of them will only seek VCT services when already ill (Miller & Rubin, 2007).
Media Campaigns in Africa
There have been several efforts to use mass media in creating HIV/AIDS awareness in Africa (Agha, 2003; Grabbe et al.,
2010; Kalichman & Simbayi, 2003; Marum, Morgan, Hightower, Ngare, & Taegtmeyer, 2008; Painter, 2001; Vidanapathirana, Abramson, Forbes, & Fairley, 2005). For example, in Ghana, folk media have been used along with mass media (radio) to educate local communities about HIV/ AIDS. The use of folk media involves the use of narratives and stories where the local culture and social factors are used to deliver preventive messages (Panford, Nyaney, Amoah, & Aidoo, 2001).
Health organizations understand the importance of com-munication in reducing the spread of HIV/AIDS. Moreover, the mass media can be helpful in “encouraging safer behaviors” (Liskin, 1990, p. 49). Agencies, such as Africa Consultants International (ACI) that advocates for good health for people in Africa through effective communication, have used various forms of communication to reduce HIV/ AIDS (ACI, 2009). ACI has partnered with various agencies
1
Winston-Salem State University, Winston-Salem, NC, USA
2
Johnson C. Smith University, Charlotte, NC, USA
3
African Population and Health Research Center, Nairobi, Kenya
Corresponding Author:
Elijah O. Onsomu, Division of Nursing, Winston-Salem State University, 601 S. Martin Luther King Jr. Drive, 240 F.L. Atkins Bldg, Winston-Salem, NC 27110, USA.
Email: [email protected]
Importance of the Media in Scaling-Up
HIV Testing in Kenya
Elijah O. Onsomu
1, DaKysha Moore
2, Benta A. Abuya
3, Peggy
Valentine
1, and Vanessa Duren-Winfield
1Abstract
The main objective of this study was to examine the association between media exposure and voluntary counseling and testing (VCT), and factors that influenced VCT among Kenyan women and men. Retrospective cross-sectional data from Kenya Demographic and Health Survey 2003 were used, adjusting for weights and strata to account for survey complex design. The study sample comprised women aged 15 to 49 (n= 8,050) and men aged 15 to 54 (n= 3,539). Among those who read newspapers/magazines almost every day, fewer women (15%) had been tested for HIV than men (31%), p< .001. Among women, those who read newspapers/magazines at least once a week (adjusted odds ratio [AOR] = 1.29, p< .001) and almost every day (AOR = 1.3, p< .001) were more likely to be tested than those who did not read at all. Among men, this was nonsignificant. However, those who read newspapers/magazines almost every day (AOR = 1.14, p< .05) were more likely to be tested than those who did not read at all. Significant odds of being tested for HIV were observed among men who watched television almost every day (AOR = 1.21, p< .001) versus women (AOR = 1.07, p< .05) compared with those who did not watch television at all. Results suggest a need to increase HIV messages in all media to scaling-up HIV testing in Kenya.
Keywords
2 SAGE Open
such as Population Reference Bureau (PRB) and Family Health International (FHI) to help reduce health issues in African countries by using female journalists (ACI, 2009). There have been many other efforts to increase the media’s role in HIV/AIDS prevention efforts in Africa. During the early 2000s, the U.S. Agency for International Development (USAID) gave more than US$2 million to the Internews Network for Nigerian and Kenyan broadcast media outlets (USAID, 2002). The money assisted media administrators to better inform the audience about HIV/AIDS (USAID, 2002).
Kenya and HIV/AIDS Media Strategies
The aforementioned literature shows that there are several programs in place to keep HIV/AIDS on the consciousness of Africans. The mass media in Kenya have targeted young sexually active people through media such as billboards to promote VCT (Ginsberg & Gekonge, 2004). Marum et al. (2008) analyzed data from more than 130 VCT sites in Kenya and found that utilization of mass HIV testing services increased with the use of “professional, intensive mass media campaigns” (p. 2019). They found that media campaigns led to an increase in the use of VCT in the participating sites. In the first phase, the increase was 28.5% compared with 42.5 % increase in the fourth phase.
Another strategy used for educating people about HIV/ AIDS has been entertainment education (E-E). E-E is a strat-egy used to influence audience behavior (Bandura, 2001) by using techniques of sharing educational content while enter-taining the participants (Singhal & Rogers, 2003; The Henry J. Kaiser Family Foundation, 2004; Vaughan, Rogers, Singhal, & Swalehe, 2000). Several African countries have used E-E for HIV/AIDS prevention, including Kenya. These
shows (radio soap opera) in Kenya included Ushikwapo Shikamana (If Assisted, Assist Yourself) with the main mes-sage being HIV/AIDS prevention. It was aired between 1987-1989 and 1998-2003 (Mazrui & Kitsao, 1988; Populations Communications International, n.d.) and dis-cussed HIV/AIDS. In 1999, a comic strip of the popular radio soap opera was published in the newspaper Taifa Leo. There was a positive response from the community for the soap opera and the comic strip (Singhal & Rogers, 2003). Studies show mass media campaigns can play a significant role in Kenyans’ perceptions and self-efficacy regarding the severity of HIV/AIDS (Agha, 2003).
Other forms of media in Kenya included the distribution of HIV/AIDS printed materials. Witte, Cameron, Lapinski, and Nzyuko (1998) collected printed HIV/AIDS material, showed pamphlets and brochures to commercial sex work-ers, truck drivwork-ers, and their assistants, and to young men along the truck stops on the Trans-Africa highway. In focus group discussions where they sought various reactions to the campaign materials, they found that pamphlets had a more favorable response in reference to “self-efficacy and response-efficacy perceptions” (p. 357) toward condom use,
condom use negotiation, and “accurate information on symp-toms of AIDS” (p. 345); hence, indicating that Kenyans are willing to pay attention to media messages.
VCT and Media
VCT is important in reducing the spread of HIV/AIDS espe-cially in countries where there are high prevalence and inci-dence rates of the disease. VCT is used to help people learn about their HIV status (Kalichman & Simbayi, 2003; Leaity et al., 2000). Furthermore, it offers several services that include pre- and posttest HIV/AIDS counseling (McKee, Bertrand, & Becker-Benton, 2004; Taegtmeyer, Kilonzo, Mung’ala, Morgan, & Theobald, 2006). In countries such as Kenya and Zambia, VCT has been used to help expecting mothers learn of their HIV status and prevent mother to child transmission (Homsy et al., 2006; Rutenberg, et al., 2003). A study that explored VCT among youth in Kenya and Uganda found an association between VCT and intentions to practice less risky behaviors associated with HIV (Horizons Program, 2001).
Increased funding in Kenya has allowed the government and health officials to increase VCT sites especially during the early through middle 2000s (Marum, Taegtmeyer, & Chebet, 2006). Despite this, the majority (63%) of Kenyans are afraid of getting tested because of the social stigma asso-ciated with being HIV positive (FHI, 2007; WHO/UNAIDS, 2009). One approach to reducing the fears of being tested for HIV/AIDS is through strategic communication. According to McKee et al. (2004), “communication plays a vital role in VCT services in three ways: (a) improving the quality of counseling at VCT facilities, (b) creating demand for VCT, and (c) creating a supportive environment for VCT” (p. 197).
The mass media are important in VCT services, because they can reach a large audience. However, expecting the media to reach Kenyans about VCT can be challenging because of the diverse nature of the Kenyan population in terms of culture and the differences in media preference. Furthermore, media preference and access might vary based on rural and urban differences. For example, in rural areas, there is little access to television. Because there are increased resources for VCT, it is important to continue to understand the relationship between media use and VCT especially in this era of “scaling-up” HIV testing services. We examine the association between VCT and media in a high HIV/AIDS prevalence population. We hypothesize that VCT will be positively associated with utilization of media. Furthermore, we examined factors associated with the uptake of VCT.
Method
Data Source
September 15, 2003. The survey used a complex design with two-stage sampling design derived from the 1999 Population and Housing Census Enumeration Areas. The first stage involved the identification of clusters from a national master sample frame—a total of 400 clusters (271 rural and 129 urban) were selected. The second stage involved a system-atic sampling of the households from a sampling list (Central Bureau of Statistics [CBS], 2004).
The survey was cross-sectional, and collected information from women and men on demographic characteristics and health indicators. The survey response rate for women and men was 94% and 86%, respectively. A more detailed sam-pling procedure for the KDHS-2003 has been previously reported (Otieno & Opiyo, 2003). The current study involved secondary data analysis of the KDHS-2003 and was approved by the University Institutional Review Board under exempt status due to nonidentifiable information.
Measures and Variables
The main outcome measure under this study is whether an individual had been tested for HIV. VCT was measured by an individual’s response to whether they have been tested for HIV. The three main predictor variables were newspapers/ magazines reading, television watching, and radio listening. Both predictors had a response of “not at all,” “sometime,” “at least once a week,” and “almost every day.” The three predictor variables were included in separate multivariate logistic regression models.
Confounding was controlled in this study using the fol-lowing variables: (a) education, (b) age at first sex, (c) mari-tal status, (d) ethnicity, (e) occupation, (f) circumcision, and (g) wealth. Marital status variable was manually selected and added back in the model. This was because among married couples, decisions made by one partner (especially men) can influence the other on which type(s) of media they can be exposed to. The variable wealth measures the socioeconomic status of an individual. Wealth was derived from total assets an individual/family owned indicative of sustaining a certain socioeconomic status in the society.
Data Analysis
Variables used to control for confounding were identified through stepwise forward multivariate analysis method and manual selection. Data analysis involved a multiple logistic regression approach to identify the association between HIV testing and the media (newspapers/magazines reading, tele-vision watching, and radio listening) use. Association between the dichotomous outcome and categorical predic-tors were assessed using three unadjusted and adjusted mul-tivariate logistic regression models. The analytical framework used is svy: logit [Pr(Yx = 1)] = e(Z) / 1 + e(Z); z = β0 + β1X1 +
β2X2 + . . . + βkXk + ε. Where Yx represents the outcome of interest (VCT—tested for HIV, Yx = 1) or otherwise (not
tested for HIV; Yx = 0). X1, X2, . . . Xk represents the different independent variables, β0, β1, β2, . . . βk represent the corre-sponding regression coefficients to be estimated, which mea-sure the effect of the independent variable and covariates on the probability of being tested for HIV. ε represents the ran-dom error term that has a normal distribution with a mean that is zero, E(ε | x) = 0 (Dupont, 2002; Wooldridge, 2006).
Descriptive statistics (sample size, frequencies) are reported, bivariate analysis was used to determine differ-ences between the predictors and the main outcome measure of interest (not tested vs. tested) with sample size, frequen-cies, and significance levels reported. Univariate and multi-variate logistic regression analyses were performed to estimate the unadjusted/crude odds ratios (CORs) and adjusted (AORs) odds ratios and 95% confidence intervals (CIs); study significance was set at p < .05. The exponential
of the coefficients (β1, β2, . . . βk) gives the ORs indicating the likelihood that those using a certain form of media (newspa-pers/magazines reading, television watching, and radio lis-tening) will be different from those not using any form of media. All analyses in this study were stratified by sex. The logistic regression analyses determined the slope coefficient and constant for the independent variables and the main out-come measure while taking into account the survey design due to clustering in the primary sampling units. This allowed for accurate estimation of the standard errors (Lumley, 2004; StataCorp, 2009). Stata Version 11 was used for all analyses (StataCorp, 2009).
Results
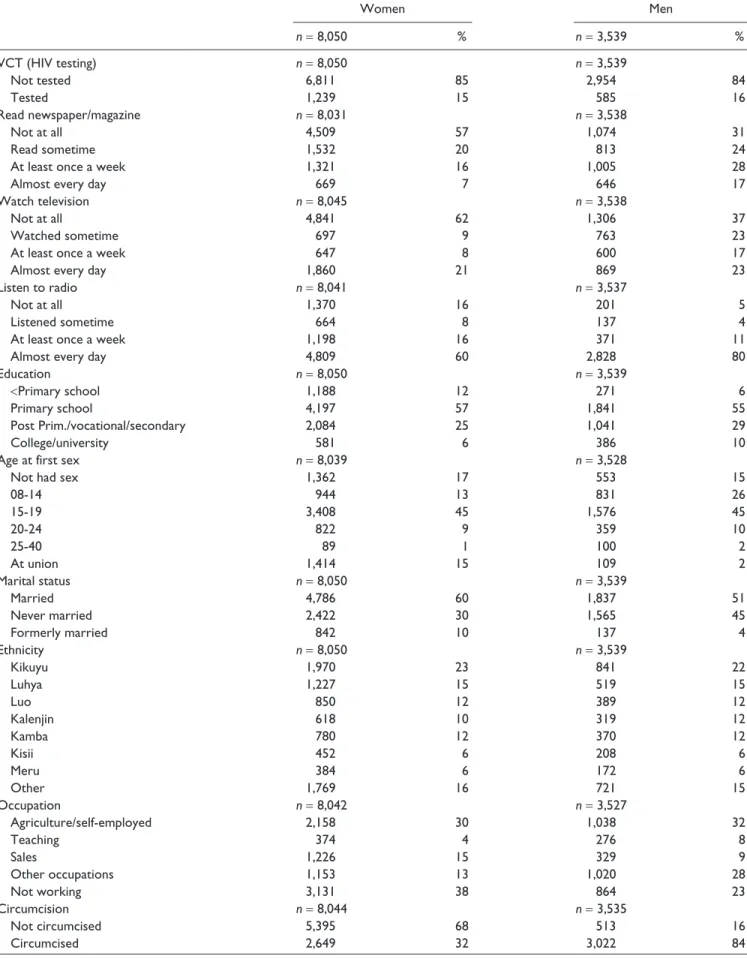
Descriptive statistics. The study included women (n = 8,050)
aged 15 to 49 and men (n = 3,539) aged 15 to 54. The
major-ity of women and men (85% and 84%) were not tested for HIV. Also the majority of women did not read newspapers/ magazines or watch television at all (58% and 62%, respec-tively); however, 60% of them listened to the radio almost every day. The majority of the respondents, women and men, had a primary school education (56% and 55%, respectively; see Table 1).
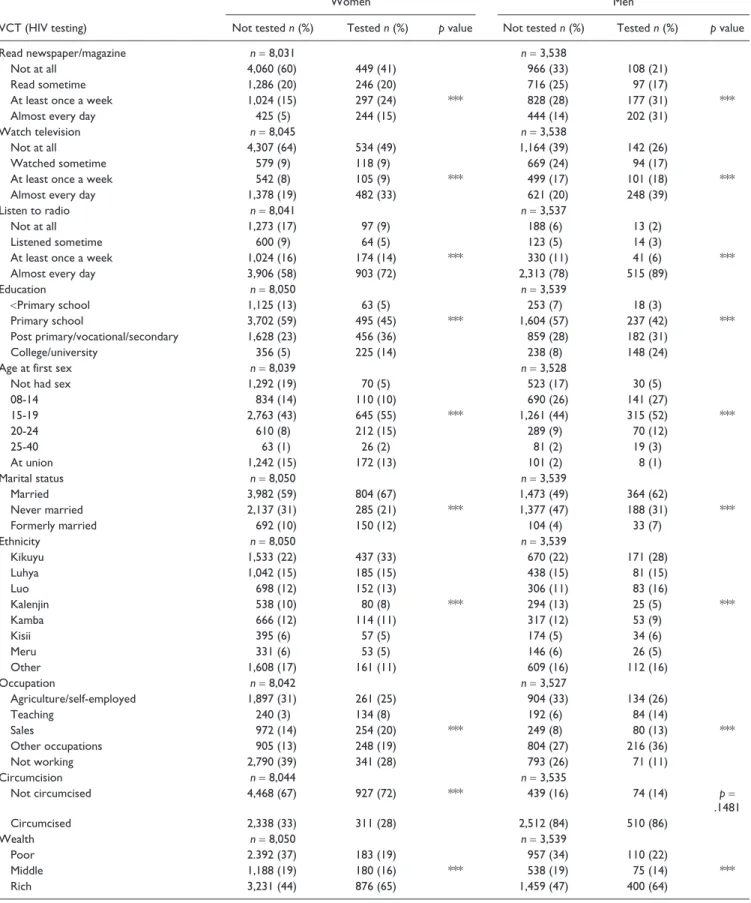
Bivariate analysis: Percentage of HIV testing by study characteris-tics. There were 15% of the women who read newspapers/ magazines almost every day who were tested for HIV com-pared with 41%, F(3, 616) = 63.42, p < .001, who were tested
and did not read newspapers/magazines at all. For television, it was 33% and 49%, F(3, 619) = 38.81, p < .001, respectively,
and for radio, it was 72% and 9%, F(3, 598) = 20.6, p < .001,
respectively. Thirty-one percent of men who read newspapers/ magazines almost every day were tested for HIV compared with 21%, F(3, 616) = 29.93, p < .001, who were tested and
did not read newspapers/magazines at all. For television, it was 39% and 26%, F(3, 615) = 30.16, p < .001, respectively,
and for radio, it was 89% and 2%, F(3, 620) = 9.26, p < .001,
4 SAGE Open
Table 1. Study Population Characteristics, Number and Percentages, KDHS-2003.
Women Men
n= 8,050 % n= 3,539 %
VCT (HIV testing) n= 8,050 n= 3,539
Not tested 6,811 85 2,954 84
Tested 1,239 15 585 16
Read newspaper/magazine n= 8,031 n= 3,538
Not at all 4,509 57 1,074 31
Read sometime 1,532 20 813 24
At least once a week 1,321 16 1,005 28
Almost every day 669 7 646 17
Watch television n= 8,045 n= 3,538
Not at all 4,841 62 1,306 37
Watched sometime 697 9 763 23
At least once a week 647 8 600 17
Almost every day 1,860 21 869 23
Listen to radio n= 8,041 n= 3,537
Not at all 1,370 16 201 5
Listened sometime 664 8 137 4
At least once a week 1,198 16 371 11
Almost every day 4,809 60 2,828 80
Education n= 8,050 n= 3,539
<Primary school 1,188 12 271 6
Primary school 4,197 57 1,841 55
Post Prim./vocational/secondary 2,084 25 1,041 29
College/university 581 6 386 10
Age at first sex n= 8,039 n= 3,528
Not had sex 1,362 17 553 15
08-14 944 13 831 26
15-19 3,408 45 1,576 45
20-24 822 9 359 10
25-40 89 1 100 2
At union 1,414 15 109 2
Marital status n= 8,050 n= 3,539
Married 4,786 60 1,837 51
Never married 2,422 30 1,565 45
Formerly married 842 10 137 4
Ethnicity n= 8,050 n= 3,539
Kikuyu 1,970 23 841 22
Luhya 1,227 15 519 15
Luo 850 12 389 12
Kalenjin 618 10 319 12
Kamba 780 12 370 12
Kisii 452 6 208 6
Meru 384 6 172 6
Other 1,769 16 721 15
Occupation n= 8,042 n= 3,527
Agriculture/self-employed 2,158 30 1,038 32
Teaching 374 4 276 8
Sales 1,226 15 329 9
Other occupations 1,153 13 1,020 28
Not working 3,131 38 864 23
Circumcision n= 8,044 n= 3,535
Not circumcised 5,395 68 513 16
Circumcised 2,649 32 3,022 84
characteristics (selected through stepwise forward multivari-ate analysis method and manual selection) and VCT for women and men except for circumcision among men (see Table 2).
Univariate logistic regression: Association between media and VCT in the unadjusted results. There was a statistically significant association between all the main predictor variables (reading newspapers/magazines, watching television, and listening to radio) and the main outcome measure (VCT) except for men and radio listening—listened sometime and at least once a week. Women who read newspapers/magazines almost every day, read at least once a week, and read sometime were 1.62, 1.55, and 1.53 times more likely to be tested for HIV com-pared with those who did not read newspapers/magazines at all. This was 1.49 and 1.31 among men who read newspaper/ magazine almost every day and at least once a week, respec-tively. Results indicate that women and men who watched television almost every day were 1.33 and 1.42 times more likely to be tested for HIV compared with those who did not watch television at all. This was 1.23 and 1.24 times more likely among women and men who watched television at least once a week compared with those who did not watch television at all. Women and men who listened to radio almost every day were 1.34 and 1.34 more likely to be tested for HIV compared with those who did not listen to radio at all. This was 1.33 among women who listened to radio at least once a week compared with those who did not listen to radio at all (see Table 3).
Multivariate logistic regression: Association between media and VCT in the adjusted results. After adjusting for confounding, there was attenuation in the ORs; however, there were still some associations between VCT and media noted (see Table 4). Women who read newspapers/magazines at least once a week and almost every day were 1.29 and 1.3 times as likely to be tested for HIV, respectively, compared with those who did not read newspapers/magazines at all. Among men, those who read newspapers/magazines almost every day were 1.14 times as likely to be tested for HIV compared with those
who did not read newspapers/magazines at all. In addition, women and men who watched television almost every day were 1.07 and 1.21 times as likely to be tested for HIV, respectively, compared with those who did not watch televi-sion at all. Also, women who listened to radio almost every day were 1.11 times as likely to be tested for HIV compared with those who did not listen to radio at all.
Other factors associated with the likelihood of being tested for HIV among women included education, age at first sex, occupation, and wealth. Among men, these were educa-tion, age at first sex, ethnicity (Luo), occupaeduca-tion, and circum-cision. Women who had a primary education, postprimary/ vocational/secondary, or college/university education and men who had a college/university education were more than 1.5 times as likely to be tested for HIV compared with those who had less than primary education. Women who experi-enced sexual debut aged 15 to 24 were between 2.08 and 3.23 times more likely to be tested for HIV compared with those who did not have sex at all. This was slightly more than 1.5 times among those experiencing sexual debut aged 25 to 29, and nearly a third (31%) among those experiencing sex-ual debut at union/marriage compared with those who did not have sex at all. This same scenario was observed among men aged 15 to 38 who were more likely to be tested for HIV compared with those who did not have sex at all. However, it was nonsignificant among men experiencing sexual debut at union/marriage, who were 2% less likely to be tested for HIV compared with those who did not have sex at all.
Among the various ethnic groups, only men from the Luo ethnicity were no more than 33% likely to be tested for HIV compared with those from the Kikuyu ethnicity who read newspapers/magazines, watched television, and listened to radio. For occupation, women and men in sales were between 17% and 27% more likely to be tested for HIV compared with those who were in agriculture or self-employed occupa-tion. Also, circumcised men were two thirds more likely to be tested for HIV compared with those who were not circum-cised for, those who read newspapers/magazines, watched television, and listened to radio. Women in the middle and rich wealth categories were between 28% and 46% more
Women Men
n= 8,050 % n= 3,539 %
Wealth n= 8,050 n= 3,539
Poor 2,575 34 1,067 32
Middle 1,368 19 613 18
Rich 4,107 47 1,859 50
6 SAGE Open
Table 2. Bivariate Analysis, Number, and Percentage of the Association Between Selected Characteristics and VCT, KDHS-2003.
Women Men
VCT (HIV testing) Not tested n (%) Tested n (%) p value Not tested n (%) Tested n (%) p value
Read newspaper/magazine n= 8,031 n= 3,538
Not at all 4,060 (60) 449 (41) 966 (33) 108 (21)
Read sometime 1,286 (20) 246 (20) 716 (25) 97 (17)
At least once a week 1,024 (15) 297 (24) *** 828 (28) 177 (31) ***
Almost every day 425 (5) 244 (15) 444 (14) 202 (31)
Watch television n= 8,045 n= 3,538
Not at all 4,307 (64) 534 (49) 1,164 (39) 142 (26)
Watched sometime 579 (9) 118 (9) 669 (24) 94 (17)
At least once a week 542 (8) 105 (9) *** 499 (17) 101 (18) ***
Almost every day 1,378 (19) 482 (33) 621 (20) 248 (39)
Listen to radio n= 8,041 n= 3,537
Not at all 1,273 (17) 97 (9) 188 (6) 13 (2)
Listened sometime 600 (9) 64 (5) 123 (5) 14 (3)
At least once a week 1,024 (16) 174 (14) *** 330 (11) 41 (6) ***
Almost every day 3,906 (58) 903 (72) 2,313 (78) 515 (89)
Education n= 8,050 n= 3,539
<Primary school 1,125 (13) 63 (5) 253 (7) 18 (3)
Primary school 3,702 (59) 495 (45) *** 1,604 (57) 237 (42) ***
Post primary/vocational/secondary 1,628 (23) 456 (36) 859 (28) 182 (31)
College/university 356 (5) 225 (14) 238 (8) 148 (24)
Age at first sex n= 8,039 n= 3,528
Not had sex 1,292 (19) 70 (5) 523 (17) 30 (5)
08-14 834 (14) 110 (10) 690 (26) 141 (27)
15-19 2,763 (43) 645 (55) *** 1,261 (44) 315 (52) ***
20-24 610 (8) 212 (15) 289 (9) 70 (12)
25-40 63 (1) 26 (2) 81 (2) 19 (3)
At union 1,242 (15) 172 (13) 101 (2) 8 (1)
Marital status n= 8,050 n= 3,539
Married 3,982 (59) 804 (67) 1,473 (49) 364 (62)
Never married 2,137 (31) 285 (21) *** 1,377 (47) 188 (31) ***
Formerly married 692 (10) 150 (12) 104 (4) 33 (7)
Ethnicity n= 8,050 n= 3,539
Kikuyu 1,533 (22) 437 (33) 670 (22) 171 (28)
Luhya 1,042 (15) 185 (15) 438 (15) 81 (15)
Luo 698 (12) 152 (13) 306 (11) 83 (16)
Kalenjin 538 (10) 80 (8) *** 294 (13) 25 (5) ***
Kamba 666 (12) 114 (11) 317 (12) 53 (9)
Kisii 395 (6) 57 (5) 174 (5) 34 (6)
Meru 331 (6) 53 (5) 146 (6) 26 (5)
Other 1,608 (17) 161 (11) 609 (16) 112 (16)
Occupation n= 8,042 n= 3,527
Agriculture/self-employed 1,897 (31) 261 (25) 904 (33) 134 (26)
Teaching 240 (3) 134 (8) 192 (6) 84 (14)
Sales 972 (14) 254 (20) *** 249 (8) 80 (13) ***
Other occupations 905 (13) 248 (19) 804 (27) 216 (36)
Not working 2,790 (39) 341 (28) 793 (26) 71 (11)
Circumcision n= 8,044 n= 3,535
Not circumcised 4,468 (67) 927 (72) *** 439 (16) 74 (14) p=
.1481
Circumcised 2,338 (33) 311 (28) 2,512 (84) 510 (86)
Wealth n= 8,050 n= 3,539
Poor 2.392 (37) 183 (19) 957 (34) 110 (22)
Middle 1,188 (19) 180 (16) *** 538 (19) 75 (14) ***
Rich 3,231 (44) 876 (65) 1,459 (47) 400 (64)
Note. KDHS = Kenya Demographic and Health Survey; VCT = voluntary counseling and testing.
likely to be tested for HIV compared with those who were poor among those reading newspapers/magazines, watching television, and listening to radio.
Discussion
The purpose of this study was to identify the association between VCT and media exposure among Kenyan women and men. We found VCT to be one of the most promising programs to address HIV/AIDS pandemic in Kenya for behavioral change especially when media are involved (Allen et al., 2003; Forsythe et al., 2002; Sweat et al., 2000). The importance of media in informing audiences on HIV/ AIDS issues has been underscored by other studies (Chatterjee, 1999; Duck, Terry, & Hogg, 1995; Myhre & Flora, 2000; Sood, Shefner-Rogers, & Sengupta, 2006) espe-cially when media are targeted to specific subgroups based on various cultural aspects (Airhihenbuwa & Obregon, 2000). However, all forms of media seemed to have a higher association with VCT on women compared with men. Women were more likely to be tested for HIV if they read newspapers/magazines at least once a week or almost every day and listened to radio almost every day than men com-pared with those who did not read newspapers/magazines or listen to radio at all. Women and men who watched televi-sion almost every day were more likely to be tested for HIV compared with those who did not watch television at all. This finding was surprising given in Kenya, men are the ones who quite often buy and read newspapers. But, it could point to the importance of audiovisual messages in enabling men to internalize HIV/AIDS messages.
We found surprising results in relation to wealth and HIV testing. Despite the fact that family wealth to a higher extent is controlled by men, there was no association between wealth and HIV testing among men who were moderately rich or those who were rich. Among women, those who were moderately rich or rich, tended to read newspapers/maga-zines, watched television, and listened to radio were more likely to be tested for HIV. The ability of moderately rich or rich women to access HIV testing could be explained by the possibility that higher income for women enhances their sta-tus in the household, thereby enabling them to be better advocates for their own health. However, being rich could equate to higher income for the women in the sample, high income could signify a relatively well-educated woman. Therefore, income serves as a proxy for the effect of educa-tion in women’s access to health care—in this case, HIV test-ing. The connection between education and income, which then leads to better health status, has been established in pre-vious literature (Abuya, Onsomu, Kimani, & Moore, 2011; Frost, Forste, & Haas, 2005; Martin, 1995).
Factors important to consider when constructing mes-sages for different media outlets that are likely to increase HIV testing programs among women include education (pri-mary school through college/university), age at sexual debut, occupation (especially those in sales), and wealth among those who are moderately rich or rich. The following factors are important to consider among men: education (college/ university), age at sexual debut excluding at union/marriage, those from the Luo ethnic group, occupation (especially those in sales), and circumcision. While these factors are cru-cial when implementing HIV testing programs, media Table 3. Unadjusted CORs and 95% CIs of VCT and Media in a Univariate Logistic Regression Model, KDHS-2003.
Women unadjusted Men unadjusted
VCT (HIV testing) COR 95% CI COR 95% CI
Read newspaper/magazine
Not at all 1 (Ref) 1 (Ref)
Read sometime 1.53*** [1.26, 1.85] 1.06 [0.76, 1.47]
At least once a week 1.55*** [1.39, 1.72] 1.31*** [1.14, 1.51]
Almost every day 1.62*** [1.50, 1.75] 1.49*** [1.35, 1.65]
Watch television
Not at all 1 (Ref) 1 (Ref)
Watched sometime 1.35* [1.07, 1.71] 1.05 [0.79, 1.40]
At least once a week 1.23** [1.08, 1.40] 1.24** [1.06, 1.44]
Almost every day 1.33*** [1.26, 1.40] 1.42*** [1.31, 1.54]
Listen to radio
Not at all 1 (Ref) 1 (Ref)
Listened sometime 1.14 [0.78, 1.68] 1.26 [0.58, 2.73]
At least once a week 1.33*** [1.13, 1.57] 1.08 [0.78, 1.49]
Almost every day 1.34*** [1.22, 1.47] 1.34** [1.10, 1.63]
Note. CORs = Crude Odds Ratios; CIs = Confidence Intervals; VCT = voluntary counseling and testing; KDHS = Kenya Demographic and Health Survey; Ref: Reference category.
8
Table 4. AORs and 95% CIs of VCT and Media in a Multivariate Logistic Regression Model, KDHS-2003.
Women adjusted Men adjusted
Read newspaper/magazine Watch television Listen to radio Read newspaper/magazine Watch television Listen to radio
VCT (HIV testing) AOR 95% CI AOR 95% CI AOR 95% CI AOR 95% CI AOR 95% CI AOR 95% CI
Media
Not at all 1(Ref) 1(Ref) 1(Ref) 1(Ref) 1(Ref) 1(Ref)
Sometime 1.18 [0.96, 1.44] 1.05 [0.81, 1.36] 0.98 [0.66, 1.46] 0.85 [0.61, 1.18] 0.92 [0.69, 1.23] 1.09 [0.52, 2.30]
At least once a week 1.29*** [1.15, 1.45] 1.07 [0.93, 1.22] 1.16 [0.98, 1.38] 1.08 [0.92, 1.27] 1.13 [0.96, 1.33] 0.91 [0.66, 1.24]
Almost every day 1.30*** [1.20, 1.42] 1.07* [1.00, 1.14] 1.11* [1.01, 1.23] 1.14* [1.01, 1.29] 1.21*** [1.09, 1.34] 1.11 [0.91, 1.35]
Education
<Primary school 1(Ref) 1(Ref) 1(Ref) 1(Ref) 1(Ref) 1(Ref)
Primary school 1.47* [1.03, 2.11] 1.59** [1.12, 2.26] 1.49* [1.04, 2.14] 1.53 [0.76, 3.08] 1.56 [0.79, 3.07] 1.46 [0.73, 2.92]
Post prim./vocational/secondary 1.54*** [1.26, 1.88] 1.69*** [1.40, 2.04] 1.64*** [1.36, 1.99] 1.33 [0.92, 1.93] 1.35 [0.95, 1.92] 1.34 [0.93, 1.93] College/university 1.52*** [1.28, 1.80] 1.69*** [1.44, 1.99] 1.68*** [1.43, 1.97] 1.57*** [1.20, 2.06] 1.56*** [1.20, 2.03] 1.63*** [1.25, 2.13] Age at first sex
Not had sex 1(Ref) 1(Ref) 1(Ref) 1(Ref) 1(Ref) 1(Ref)
15-19 3.23*** [2.23, 4.67] 3.06*** [2.11, 4.44] 3.05*** [2.10, 4.42] 2.37*** [1.41, 4.00] 2.41*** [1.41, 4.09] 2.33** [1.39, 3.92]
20-24 2.11*** [1.79, 2.47] 2.08*** [1.77, 2.44] 2.07*** [1.77, 2.43] 1.49** [1.16, 1.91] 1.51*** [1.17, 1.94] 1.46** [1.14, 1.88]
25-29 1.52*** [1.35, 1.72] 1.51*** [1.34, 1.70] 1.51*** [1.34, 1.70] 1.31** [1.08, 1.59] 1.33** [1.10, 1.61] 1.30** [1.07, 1.57]
30-38 1.33** [1.10, 1.61] 1.33** [1.10, 1.61] 1.33** [1.10, 1.61] 1.25* [1.04, 1.50] 1.25* [1.04, 1.51] 1.24* [1.03, 1.49]
At union 1.31*** [1.22, 1.41] 1.31*** [1.22, 1.41] 1.31*** [1.22, 1.41] 0.98 [0.79, 1.22] 0.99 [0.79, 1.23] 0.98 [0.79, 1.21]
Marital status
Married 1(Ref) 1(Ref) 1(Ref) 1(Ref) 1(Ref) 1(Ref)
Never married 0.79* [0.64, 0.97] 0.82 [0.67, 1.00] 0.83 [0.68, 1.02] 0.78 [0.61, 1.01] 0.77* [0.60, 0.98] 0.77* [0.60, 0.99]
Formerly married 1.02 [0.91, 1.13] 1.02 [0.92, 1.14] 1.03 [0.93, 1.15] 1.18 [0.94, 1.50] 1.18 [0.94, 1.50] 1.18 [0.93, 1.48]
Ethnicity
Kikuyu 1(Ref) 1(Ref) 1(Ref) 1(Ref) 1(Ref) 1(Ref)
Luhya 0.83 [0.65, 1.06] 0.82 [0.64, 1.06] 0.80 [0.63, 1.02] 0.97 [0.68, 1.38] 0.98 [0.69, 1.39] 0.93 [0.65, 1.32]
Luo 0.94 [0.82, 1.08] 0.95 [0.82, 1.09] 0.94 [0.82, 1.08] 1.32* [1.03, 1.70] 1.33* [1.03, 1.73] 1.33* [1.03, 1.70]
Kalenjin 0.88* [0.79, 0.99] 0.90 [0.80, 1.01] 0.90 [0.80, 1.01] 0.75*** [0.65, 0.87] 0.75*** [0.65, 0.87] 0.75*** [0.65, 0.87]
Kamba 0.92* [0.85, 0.99] 0.92* [0.85, 0.99] 0.92* [0.85, 0.99] 0.91 [0.82, 1.01] 0.93 [0.84, 1.02] 0.90* [0.82, 1.00]
Kisii 0.93* [0.87, 0.99] 0.93* [0.87, 1.00] 0.93* [0.87, 0.99] 1.01 [0.92, 1.10] 1.01 [0.93, 1.10] 1.00 [0.91, 1.09]
Meru 0.92* [0.86, 0.98] 0.92* [0.86, 0.98] 0.92* [0.86, 0.98] 0.95 [0.89, 1.01] 0.95 [0.89, 1.01] 0.94 [0.88, 1.00]
Other 0.94** [0.91, 0.98] 0.94** [0.91, 0.98] 0.95** [0.91, 0.98] 1.02 [0.98, 1.07] 1.03 [0.99, 1.08] 1.02 [0.98, 1.07]
Occupation
Agriculture/self-employed 1(Ref) 1(Ref) 1(Ref) 1(Ref) 1(Ref) 1(Ref)
Teaching 1.07 [0.74, 1.54] 1.20 [0.84, 1.73] 1.23 [0.85, 1.77] 0.99 [0.65, 1.50] 1.01 [0.67, 1.51] 1.06 [0.70, 1.62]
Sales 1.17** [1.04, 1.31] 1.19** [1.07, 1.33] 1.20** [1.07, 1.34] 1.22* [1.02, 1.45] 1.25* [1.05, 1.49] 1.27** [1.07, 1.50]
Other occupations 1.07 [0.98, 1.16] 1.09* [1.01, 1.18] 1.10* [1.01, 1.19] 1.07 [0.97, 1.18] 1.08 [0.98, 1.19] 1.09 [0.99, 1.20]
Not working 1.00 [0.94, 1.06] 1.01 [0.95, 1.07] 1.01 [0.95, 1.07] 0.92 [0.84, 1.02] 0.93 [0.85, 1.02] 0.94 [0.86, 1.03]
Circumcision
Not circumcised 1(Ref) 1(Ref) 1(Ref) 1(Ref) 1(Ref) 1(Ref)
Circumcised 1.02 [0.84, 1.24] 0.98 [0.80, 1.18] 0.97 [0.80, 1.18] 1.71** [1.16, 2.51] 1.64* [1.10, 2.44] 1.69** [1.15, 2.48]
Wealth
Poor 1(Ref) 1(Ref) 1(Ref) 1(Ref) 1(Ref) 1(Ref)
Middle 1.45** [1.10, 1.90] 1.46** [1.11, 1.91] 1.42* [1.08, 1.86] 1.06 [0.74, 1.51] 1.01 [0.71, 1.43] 1.03 [0.72, 1.46]
Rich 1.28*** [1.14, 1.44] 1.31*** [1.15, 1.49] 1.32*** [1.17, 1.49] 1.06 [0.92, 1.24] 1.01 [0.87, 1.17] 1.10 [0.95, 1.26]
outlets, education, and access to information need to be increased (Melkote, Muppidi, & Goswami, 2000). It is also crucial to increase awareness and HIV/AIDS education among students attending schools (Bennell, Hyde, & Swainson, 2002). We found that only 54% of women and 54% men who have a primary school education have not been tested for HIV compared with only 5% of women and 8% of men who have a college/university education. The current findings are in line with research from FHI (2007), which shows that adolescents between ages 15 and 19 did not feel the need to be tested for HIV/AIDS.
Our findings point to various policy implications’ as it relates to VCT and media. HIV/AIDS continues to be a prob-lem for many SSA countries, and the need for funding to support HIV/AIDS programs continue to be an important part in this fight. Kenya received US$534.8 million in finan-cial year 2008 (an increase of US$442.3 in 4 years) through the President’s Emergency Plan for AIDS Relief (PEPFAR, 2008). The majority of the money goes to prevention pro-grams that require HIV testing to use such funding. However, establishing VCT centers based on such funding will not guarantee their success, rather HIV/AIDS programs need to utilize media to communicate their services and increase awareness of such VCT centers especially during the forma-tive research initiaforma-tive.
Of importance is to identify different subgroups and target such messages to media outlets commonly used by them. As the current study shows, slightly more than half of males and females who have a primary school education have not been tested for HIV compared with less than 10% of males and females who have a college/university education. The infor-mation alerts HIV/AIDS campaign planners that media mes-sages need to stress the importance of being tested among various age groups. The messages should address stigma, confidentiality while testing, and a host of social and cultural issues. During a formative research initiative by FHI (2007), Kenyans cited fear of discrimination and stigma if they tested positive for HIV. Furthermore, they were afraid of testing because of inefficiencies in accurate and safe testing, dis-tance from testing locations, hospitality issues at centers, stigma associated with testing among other concerns. In addition, adolescents were nervous about an HIV test because of fear from peer pressure (FHI, 2007). Mass media have the ability to help reduce such barriers associated with social/ cultural factors that keep people from being tested for HIV or using such services. McKee et al. (2004) discussed that many planners are using a symbol so that people can recognize HIV testing services; therefore, symbols should also be a part of the media messages in Kenya.
Our findings point to the need of campaign planners, pub-lic health, and government officials to use various forms of media in convincing Kenyans to continuously learn about their HIV/AIDS status. Media, especially radio, appears to be a good tool for educating Kenyans about the importance of being tested for HIV. Newspapers/magazines also seem to
be very promising in communicating HIV/AIDS messages among women; hence, the need to be explored more particu-larly on ways to make such media available to women. Health educators and program planners must continue to use programs such as Ushikwapo Shikamana to increase cogni-tive awareness about HIV/AIDS and the importance of being tested for HIV among Kenyans.
Our findings are limited by the fact that the KDHS-2003 survey data is cross-sectional; hence, causal relationships cannot be made between VCT and influence of media. Furthermore, these findings are only within the Kenya con-text. Therefore, they cannot be generalized to other popula-tions particularly those in other SSA countries. While bias was unlikely due to random sampling, endogeneity bias could have been possible particularly among women—lack of reading newspapers/magazines and watching television could have been explained by other factors such as husband controlling attitudes. Lack of VCT could have also been explained by fear of learning one’s HIV status. Finally, the use of other media sources such as Internet and cell phone information were not captured by the KDHS-2003. Such information could have enriched the current research consid-ering the rate at which these technologies have been accepted by the population even in rural areas.
From a policy perspective, it is important to integrate the use of media in all health care services, education, and social services to reduce HIV/AIDS in Kenya. There is also a need for the government to recognize private media sources as key stakeholders in fighting HIV/AIDS pandemic; hence, subsi-dised HIV/AIDS coverage in such outlets should be encour-aged through various incentives. Public media should also be enhanced and keen in continuous and increased provision of HIV/AIDS messages.
10 SAGE Open
Conclusion
We found media to be crucial in “scaling-up” VCT services. Women who read newspapers/magazines at least once a week or almost every day, watched television almost every day, and listened to radio almost every day were more likely to be tested for HIV compared with those who did not. Men who watched television almost every day were more likely to be tested for HIV compared with those who did not. There is a need for more research on couple’s concordance for VCT services and the influence of media on such agreements. Moreover, research that is focusing on the media, VCT, and HIV/AIDS stigma among different ethnic groups needs to be conducted to understand the widespread and potential ethnic and/or HIV/AIDS funding disparities if any. Overall, strate-gies to improve increased VCT should be sensitive to the sociocultural factors that inhibit the human capacities to respond to the call for VCT, even from the media and other alternatives be sought to increase VCT.
Acknowledgments
Data for this study, the Kenya Demographic and Health Survey (KDHS) 2003 was approved and provided by MEASURE DHS (Demographic and Health Survey), ICF Macro, Calverton, MD, USA. We would also like to express our gratitude to the faculty at the Health Services Research Academy (HSRA) at the University of North Carolina at Charlotte for their review of the manuscript and valuable comment.
Declaration of Conflicting Interests
The author(s) declared no potential conflicts of interest with respect to the research, authorship, and/or publication of this article.
Funding
The author(s) received no financial support for the research and/or authorship of this article.
References
Abuya, B. A., Onsomu, E. O., Kimani, J. K., & Moore, D. (2011). Influence of maternal education on child immunization and stunting in Kenya. Maternal and Child Health Journal, 15, 1389-1399.
Africa Consultants International. (2009). Improving media
cov-erage of health issues in Africa. Retrieved from http://www.
acibaobab.org/fr/initiatives-sur-lepidemie-du-vihsida-et-la- sante-reproductive/improving-media-coverage-of-health-issues-in-africa.html
Agha, S. (2003). The impact of a mass media campaign on personal risk perception, perceived self-efficacy and on other behavioral predictors. AIDS Care, 15, 749-762.
Airhihenbuwa, C. O., & Obregon, R. (2000). A critical assessment of theories/models used in health communication for HIV/ AIDS. Journal of Health Communication, 5(Suppl), 5-15. Allen, S., Meinzen-Derr, J., Kautzman, M., Zulu, I., Trask, S.,
Fideli, U., & Haworth, A. (2003). Sexual behavior of HIV dis-cordant couples after HIV counseling and testing. AIDS, 17, 733-740.
Bandura, A. (2001). Social cognitive theory of mass communica-tion. Media Psychology, 3, 265-299.
Bennell, P., Hyde, K., & Swainson, N. (2002). The impact of the HIV/AIDS epidemic on the education sector in Sub-Saharan Africa: A synthesis of the findings and recommendations of
three country studies. Brighton, UK: University of Sussex,
Centre for International Education, Institute of Education. Central Bureau of Statistics [Kenya], Ministry of Health [Kenya],
and ORC Macro. (2004). Kenya demographic and health
sur-vey 2003. Calverton, MD: Author.
Chatterjee, N. (1999). AIDS-related information exposure in the mass media and discussion within social networks among mar-ried women in Bombay, India. AIDS Care, 11, 443-446. Cheluget, B., Baltazar, G., Orege, P., Ibrahim, M., Marum, L. H.,
& Stover, J. (2006). Evidence for population level declines in adult HIV prevalence in Kenya. Sexually Transmitted
Infections, 82(Suppl 1), i21-i26.
Duck, J. M., Terry, D. J., & Hogg, M. A. (1995). The perceived influence of AIDS advertising: Third person effects in the context of positive media content. Basic and Applied Social
Psychology, 17, 305-325.
Dupont, W. D. (2002). Statistical modeling for biomedical research-ers. Cambridge, UK: Cambridge University Press.
Family Health International. (2007). Impact project experience and lessons learned: From behavior change communication to strategic behavioral communication on HIV in Kenya, 1999– 2006. Nairobi, Kenya: Mwarogo.
Forsythe, S., Arthur, G., Ngatia, G., Mutemi, R., Odhiambo, J., & Gilks, C. (2002). Assessing the cost and willingness to pay for voluntary HIV counseling and testing in Kenya. Health Policy
and Planning, 17, 187-195.
Frost, M. B., Forste, R., & Haas, D. W. (2005). Maternal education and child nutritional status in Bolivia: Finding the links. Social
Science & Medicine, 60, 395-407.
Ginsberg, P. E., & Gekonge, M. (2004). MTV, technology, the sec-ular trend, and HIV/AIDS: Why Kenyan parents need to learn about adolescent development. Dialectical Anthropology, 28, 353-364.
Grabbe, K. L., Menzies, N., Taegtmeyer, M., Emukule, G., Angala, P., Mwega, I., & Marum, E. (2010). Increasing access to HIV coun-seling and testing through mobile services in Kenya: Strategies, utilization and cost-effectiveness. Journal of Acquired Immune
Deficiency Syndromes, 54, 317-323.
The Henry, J. Kaiser Family Foundation (2004). Entertainment
education and health in the United States. Retrieved from
http://kaiserfamilyfoundation.files.wordpress.com/2013/01/ entertainment-education-and-health-in-the-united-states-issue-brief.pdf
Homsy, J., Kalamya, J. N., Obonyo, J., Ojwang, J., Mugumya, R., Opio, C., & Mermin, J. (2006). Routine intrapartum HIV coun-seling and testing for prevention of mother-to-child transmis-sion of HIV in a rural Ugandan hospital. Journal of Acquired
Immune Deficiency Syndromes, 42, 149-154.
Horizons Program. (2001). HIV voluntary counseling and testing among youth: Results from an exploratory study in Nairobi,
Kenya, and Kampala and Masaka, Uganda. Washington, DC:
Population Council.
Kalichman, S. C., & Simbayi, L. C. (2003). HIV testing attitudes, AIDS stigma, and voluntary HIV counselling and testing in a black township in Cape Town, South Africa. Sexually
Leaity, S., Sherr, L., Wells, H., Evans, A., Miller, R., Johnson, M., & Elford, J. (2000). Repeat HIV testing: High-risk behaviour or risk reduction strategy? AIDS, 14, 547-552.
Liskin, L. (1990). Using mass media for HIV/AIDS prevention.
AIDS Care, 2, 419-420.
Lumley, T. (2004). Analysis of complex survey samples. Journal of
Statistical Software, 9, 1-10.
Martin, T. C. (1995). Women’s education and fertility: Results from 26 demographic and health surveys. Studies in Family
Planning, 26(4), 187-202.
Marum, E., Morgan, G., Hightower, A., Ngare, C., & Taegtmeyer, M. (2008). Using mass media campaigns to promote voluntary coun-seling and HIV-testing services in Kenya. AIDS, 22, 2019-2024. Marum, E., Taegtmeyer, M., & Chebet, K. (2006). Scale-up of
vol-untary HIV counseling and testing in Kenya. Journal of the
American Medical Association, 296, 859-862.
Mazrui, A., & Kitsao, J. (1988). A formative survey of Ushikwapo
Shikimana. Nairobi, Kenya: National Council for Population
and Development.
McKee, N., Bertrand, J. T., & Becker-Benton, A. (2004). Strategic
communication in the HIV/AIDS epidemic. Thousand Oaks,
CA: Sage.
Melkote, S. R., Muppidi, S. R., & Goswami, D. (2000). Social and economic factors in an integrated behavioral and societal approach to communication in HIV/AIDS. Journal of Health
Communication, 5(Suppl), 17-27.
Miller, A. N., & Rubin, D. L. (2007). Factors leading to self-dis-closure of a positive HIV diagnosis in Nairobi, Kenya: People living with HIV/AIDS in Sub-Sahara. Qualitative Health
Research, 17, 586-598.
Minkoff, H., Ahdieh, L., Massad, L. S., Anastos, K., Watts, D. H., Melnick, S., & Palefsky, J. (2001). The effect of highly active antiretroviral therapy on cervical cytologic changes associated with oncogenic HPV among HIV-infected women. AIDS, 15, 2157-2164.
Myhre, S. L., & Flora, J. A. (2000). HIV/AIDS communica-tion campaigns: Progress and prospects. Journal of Health
Communication, 5(Suppl), 29-46.
National AIDS and STD Control Programme. (2001). National
guidelines for voluntary counseling and testing. Nairobi,
Kenya: Author
Otieno, F., & Opiyo, S. (2003). Introduction: Survey organisation and sample design. In Kenya Demographic and Health Survey, final
report 2003. Calverton, Maryland: CBS, MOH, and ORC Macro.
Painter, T. M. (2001). Voluntary counseling and testing for couples: A high-leverage intervention for HIV/AIDS prevention in Sub-Saharan Africa. Social Science & Medicine, 53, 1397-1411. Panford, S., Nyaney, M. O., Amoah, S. O., & Aidoo, N. G. (2001).
Using folk media in HIV/AIDS prevention in rural Ghana.
American Journal of Public Health, 91, 1559-1562.
Populations Communications International. (n.d.). Kenya—
Ushikwapo Shikamana. Retrieved from
http://www.popula-tion.org/programs_ushikwapo_kenya.shtml
The President’s Emergency Plan for AIDS Relief. (2008). Country
profile: Kenya. Retrieved from http://www.pepfar.gov/press/
countries/profiles/116231.htm
Rutenberg, N., Siwale, M., Kankasa, C., Nduati, R., Oyieke, J., & Geibel, S. (2003). HIV voluntary counseling and testing: An essential component in preventing mother-to-child
transmis-sion of HIV (Horizons Research Summary). Washington, DC:
Population Council.
Singhal, A., & Rogers, E. M. (2003). Combating AIDS:
Communication strategies in action. Thousand Oaks, CA:
Sage.
Sood, S., Shefner-Rogers, C. L., & Sengupta, M. (2006). The impact of a mass media campaign on HIV/AIDS knowledge and behavior change in North India: Results from a longitudi-nal study. Asian Journal of Communication, 16, 231-250. StataCorp. (2009). Stata survey data reference manual. Release 11.
College Station, TX: StataCorp LP.
Sweat, M., Gregorich, S., Sangiwa, G., Furlonge, C., Balmer, D., Kamenga, C., & Coates, T. (2000). Cost-effectiveness of vol-untary HIV-1 counselling and testing in reducing sexual trans-mission of HIV-1 in Kenya and Tanzania. Lancet, 356(9224), 113-121.
Taegtmeyer, M., Kilonzo, N., Mung’ala, L., Morgan, G., & Theobald, S. (2006). Using gender analysis to build voluntary counseling and testing responses in Kenya. Transactions of the
Royal Society of Tropical Medicine and Hygiene, 100,
305-311.
UNAIDS. (2012). World AIDS day report: Global report 2012. Retrieved from http://www.unaids.org/en/resources/cam-paigns/20121120_globalreport2012/globalreport/
U.S. Agency for International Development. (2002). USAID funds efforts to improve HIV/AIDS REPORTING IN Africa: Media
must help in fighting epidemic, USAID says. Retrieved from
http://iipdigital.usembassy.gov/st/english/texttrans/2002/ 11/[email protected]. html#axzz2Y1UOJXIo
Vaughan, P. W., Rogers, E. M., Singhal, A., & Swalehe, R. M. (2000). Entertainment-education and HIV/AIDS preven-tion: A field experiment in Tanzania. Journal of Health
Communication, 5(Suppl), 81-100.
Vidanapathirana, J., Abramson, M. J., Forbes, A., & Fairley, C. (2005). Mass media interventions for promoting HIV testing (Review). The Cochrane Database of Systematic Reviews, 3, 1-38.
WHO, UNAIDS. (2009). Towards universal access: Scaling up
priority HIV/AIDS interventions in the health sector (Progress
report 2009). Geneva, Switzerland: Author.
Witte, K., Cameron, K. A., Lapinski, M. K., & Nzyuko, S. (1998). A theoretically based evaluation of HIV/AIDS prevention campaigns along the Trans-Africa highway in Kenya. Journal
of Health Communication, 3, 345-363.
Wooldridge, J. M. (2006). Introductory econometrics: A modern
approach (3rd ed.). Mason, OH: Thomson South-Western.
Wools-Kaloustian, K., Kimaiyo, S., Diero, L., Siika, A., Sidle, J., Yiannoutsos, C. T., & Tierney, W. M. (2006). Viability and effectiveness of large-scale HIV treatment initiatives in sub Saharan Africa: Experience from western Kenya. AIDS, 20(1), 41-48.
Author Biographies
12 SAGE Open
Green State University; and Department of Public Health and Preventive Medicine, College of Medicine-University of Toledo) and an MS from Indiana State University. He is also a Master Certified Health Education Specialist (MCHES). His research inter-est includes HIV/AIDS, maternal and child health, and dominter-estic and partner violence.
DaKysha Moore is an associate professor in the Department of Visual, Performing, and Communication Arts at Johnson C. Smith University. She received her PhD in communication studies from Bowling Green State University. She also holds an MS from Indiana State University. Her research interests include health communica-tion, HIV/AIDS, sickle cell disease, intimate partner violence, and mass communication.
Benta A. Abuya is a research associate at the African Population and Health Research Center (APHRC), in Nairobi, Kenya. She received her dual PhD in education theory and policy, and comparative and international education, with a minor in demography at the Pennsylvania State University, University Park. She is a 2008-2009 fellow in policy communication (population and health) with PRB in DC, Washington, and another year training fellowship with the Compton/PRB in 2009-2010. She also holds an MA from the Population Research Institute, University of Nairobi. Her research interests include intimate partner violence; comparative education; education policy issues of access, equity, and quality; the linkages between education and health outcomes for adolescents; gender issues in education; and the impact of families on the education, resources allocation, and health outcomes of their school-going children.
Peggy Valentine is dean and professor of the School of Health Sciences at WSSU. Her clinical experiences include registered nurse and physician assistant. She received the doctor of education degree from Virginia Tech, the master of arts degree and bachelor of science degree from Howard University. She is listed in “Who’s Who of American Women,” and was honored as “Educator of the Year” by the American Academy of Physician Assistants. She was elected fellow in the Association of Schools of Allied Health Professions, and Howard University Faculty Senate honored her for “Outstanding Contributions to the African Diaspora.” She has served as principal investigator for many national and international projects, including the Malawi Project—University Technical Assistance Program, funded by the Centers for Disease Control and Prevention (CDC) Global AIDS Program, and the Zimbabwe Project funded by the World AIDS Foundation. Her research inter-est includes HIV/AIDS, homeless, and health disparities. She cur-rently serves as editor in chief of the Journal of Best Practices in
Health Professions Diversity: Research, Education and Policy.