Are Early Somatic Embryos of the Norway
Spruce (
Picea abies
(L.) Karst.) Organised?
Jiri Petrek1,2, Ondrej Zitka1,3, Vojtech Adam1,3, Karel Bartusek4, Naser A. Anjum5, Eduarda Pereira5, Ladislav Havel2, Rene Kizek1,3*
1Department of Chemistry and Biochemistry, Mendel University in Brno, Zemedelska 1, CZ-613 00, Brno, Czech Republic, European Union,2Department of Plant Biology, Mendel University in Brno, Zemedelska 1, CZ-613 00, Brno, Czech Republic, European Union,3Central European Institute of Technology, Brno University of Technology, Technicka 3058/10, CZ-616 00, Brno, Czech Republic, European Union, 4Institute of Scientific Instruments, Academy of Sciences of the Czech Republic, Kralovopolska 147, CZ-612 64, Brno, Czech Republic, European Union,5CESAM-Centre for Environmental and Marine Studies & Department of Chemistry, University of Aveiro, 3810–193, Aveiro, Portugal, European Union
Abstract
Background
Somatic embryogenesis in conifer species has great potential for the forestry industry. Hence, a number of methods have been developed for their efficient and rapid propagation through somatic embryogenesis. Although information is available regarding the previous process-mediated generation of embryogenic cells to form somatic embryos, there is a dearth of information in the literature on the detailed structure of these clusters.
Methodology/Principal Findings
The main aim of this study was to provide a more detailed structure of the embryogenic tis-sue clusters obtained through thein vitropropagation of the Norway spruce (Picea abies (L.) Karst.). We primarily focused on the growth of early somatic embryos (ESEs). The data on ESE growth suggested that there may be clear distinctions between their inner and outer regions. Therefore, we selected ESEs collected on the 56thday after sub-cultivation to
dis-sect the homogeneity of the ESE clusters. Two colourimetric assays (acetocarmine and fluorescein diacetate/propidium iodide staining) and one metabolic assay based on the use of 2,3,5-triphenyltetrazolium chloride uncovered large differences in the metabolic activity inside the cluster. Next, we performed nuclear magnetic resonance measurements. The ESE cluster seemed to be compactly aggregated during the first four weeks of cultivation; thereafter, the difference between the1H nuclei concentration in the inner and outer clusters
was more evident. There were clear differences in the visual appearance of embryos from the outer and inner regions. Finally, a cluster was divided into six parts (three each from the inner and the outer regions of the embryo) to determine their growth and viability. The inner-most embryos (centripetally towards the cluster centre) could grow after sub-cultivation but exhibited the slowest rate and required the longest time to reach the common growth rate. To confirm our hypothesis on the organisation of the ESE cluster, we investigated the effect OPEN ACCESS
Citation:Petrek J, Zitka O, Adam V, Bartusek K, Anjum NA, Pereira E, et al. (2015) Are Early Somatic Embryos of the Norway Spruce (Picea abies(L.) Karst.) Organised? PLoS ONE 10(12): e0144093. doi:10.1371/journal.pone.0144093
Editor:Xianlong Zhang, National Key Laboratory of Crop Genetic Improvement, CHINA
Received:September 20, 2015
Accepted:November 12, 2015
Published:December 1, 2015
Copyright:© 2015 Petrek et al. This is an open access article distributed under the terms of the
Creative Commons Attribution License, which permits unrestricted use, distribution, and reproduction in any medium, provided the original author and source are credited.
Data Availability Statement:All relevant data are within the paper.
of cluster orientation on the cultivation medium and the influence of the change of the clus-ter’s three-dimensional orientation on its development. Maintaining the same position when transferring ESEs into new cultivation medium seemed to be necessary because changes in the orientation significantly affected ESE growth.
Conclusions and Significance
This work illustrated the possible inner organisation of ESEs. The outer layer of ESEs is formed by individual somatic embryos with high metabolic activity (and with high demands for nutrients, oxygen and water), while an embryonal group is directed outside of the ESE cluster. Somatic embryos with depressed metabolic activity were localised in the inner regions, where these embryonic tissues probably have a very important transport function.
Introduction
The process of somatic embryogenesis in conifer species (especially thePiceaandPinusgenera) has become a very important tool for thein vitropropagation of economically important forest or rare woody species. Due to its potential impact on the forestry industry, there has been rapid development of both a method for their propagation through somatic embryogenesis and a very potent experimental system to investigate the morphological, biochemical, physiological or molecular processes of differentiation and development [1,2,3,4,5,6]. The initiation of embryogenesis has been described in several species of genusPinus(e.g.,P.taedea,P.mariana,
P.roxburghii,P.bungeana,P.elliotii,P.nigra,P.massoniana,P.caribaea,P.silvestrisandP.
strobus), where the process of induction is more difficult in comparison with other conifers, and the genusPicea(especiallyPicea abies).Picea abiesis the first coniferous species (followed byLarix decidua) in which zygotic embryos have been used as explants [1,3].In vitro propaga-tion of these species has very important advantages compared to convenpropaga-tional methods becausein vitropropagation enables the selection of clones with desired attributes and gene transformation [7,8,9]. The process of embryogenesis starts from the induction of embryogenic tissue, usually from the hypocotyls of zygotic embryos. The previous process generated embryogenic cells that eventually formed somatic embryos. Embryogenic cells have common characteristics of meristematic cells with a high division rate (mitotic index) and higher meta-bolic activity. The embryogenic tissue consists of many somatic embryos that form clusters for use as the source material for the nextin vitropropagation. However, there is a dearth of infor-mation in the literature concerning the detailed structure of these clusters.
Therefore, the main aim of the present work was to determine a more detailed structure of the embryogenic tissue clusters obtained through thein vitropropagation of the Norway spruce (Picea abies(L.) Karst.). This work also supplied details on the biochemical differences between different areas (inner and outer) of the clusters during two months of cultivation. The outcome of this work will be significant for the subsequent transfer of different cluster regions into new cultivation media and their further development therein, as well as the development of an efficient protocol for the generation of somatic embryos.
Organization of Early Somatic Embryos
Results and Discussion
Growth analysis
The plant growth curve is the basic parameter for a plant physiologist and can be determined using several different methods. The most frequently used methods are based on the counting and/or weighing of cells or tissues. In recent years, image analysis (IA) has been used as a tool to study the growth and/or morphology and also for the study of somatic embryogenesis e.g.
Daucus carota[10,11,12],Betula pendula[13],Ipomoea batatas[14],Saccharumspp. [15] and
Picea abies[16]. Therefore, we decided to use this method in this study, too. The ESE clusters cultivated on solid culture medium formed masses with whitish or in some cases slightly yellowish colouring. During the 14-day cultivation, the ESE cluster uniformly expanded to the neighbouring area. The typical structures of individual somatic embryos in the ESEs were observed under a light microscope by very carefully disintegrating the ESEs in phosphate buffer. Each embryo consisted of an embryonal group (very intensely dividing cells), embryo-nal tube cells and embryoembryo-nal suspensor cells. Embryoembryo-nal group cells continually divide, and the tubular cells are formed due to their elongation at the distal end. These cells form the embryo-nal suspensor, whose cells are released into the medium. The ESE cluster is shaped by the production of new tubular and suspensor cells and their segregation in the direction from the embryonal group [17]. The stress reaction increased after the detachment of 50–100 individual
somatic embryos into the cultivation medium, which might account for the growth depression observed for 5–7 days. The growth rate increased from the 7thto 14thday, when very rapid ESE
growth was observed. This very rapid growth lasted until the 35th–40thday of sub-cultivation
(Fig 1). On the 40thday after sub-cultivation, the ESE cluster growth slowly decreased (inset in Fig 1). These growth characteristics were observed using two different methods: computer image analysis and weighing of individual ESE clusters of the 2/32 clone (Fig 1). These growth characteristics were repeatedly validated (n = 3). This rapid growth is often detected in ESEs of various species [4,18].
Metabolic changes
subsequently tested for viability using the fluorescent probes fluorescein diacetate and propi-dium iodide. Nearly 75% of the individual somatic embryos from the inner ESE cluster remained unstained, whereas the number of unstained embryos in the outer ESE cluster was limited to 10%. The number of non-viable cells in each cluster was approximately 15%. These results were confirmed by FDA/PI staining, which demonstrated that individual somatic embryos from the outer ESE cluster demonstrated high metabolic activity and were FDA-posi-tive (Fig 3B). FDA posiFDA-posi-tive clusters were determined based on green fluorescence as it is shown in upper inset photo inFig 3B. Dead cells were stained by red (bottom inset photo inFig 3B), whereas unstained cells were identified by superimposing figures with those obtained by stan-dard camera [17]. Average viability changes determined by the above-mentioned double FDA/ PI staining and esterase activity determination according to cultivation are shown inFig 3C andFig 3D, respectively. There was a gradual deceleration of the ESE metabolic activity that was concomitant with the period of cultivation. This effect could have been caused by the Fig 1.Picea abiesembryogenic culture.Growth curve of the embryogenic culture over 42 and 56 days (inset). The average area of a cluster was 46 mm2 and its fresh weight was 110 mg at the beginning of the experiment. The values represent an average of 10 clusters.
doi:10.1371/journal.pone.0144093.g001
gradual growth of FDA/PI unstainable cells. The potential factor responsible for the metabolic changes observed herein is not clear. Nonetheless, polysaccharide compounds could play a sig-nificant role in this process [21,22]. Moreover, there have been observed and documented cases, where the decrease in the metabolic activity of the clusters was associated with the exter-nal negative influence of metal ions [23]. Karcz and Kurtyka investigated the effect of cadmium (II) ions on growth, proton extrusion and membrane potential in maize coleoptile segments [24]. The cadmium(II) ions induced growth inhibition at almond seedlings [25], green micro-algaScenedesmus armatus(Chod.) [26] and others [27,28].
Metabolite transportation
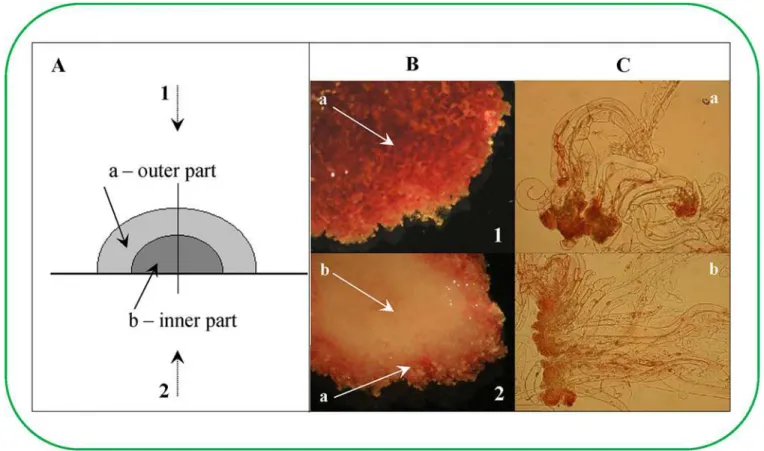
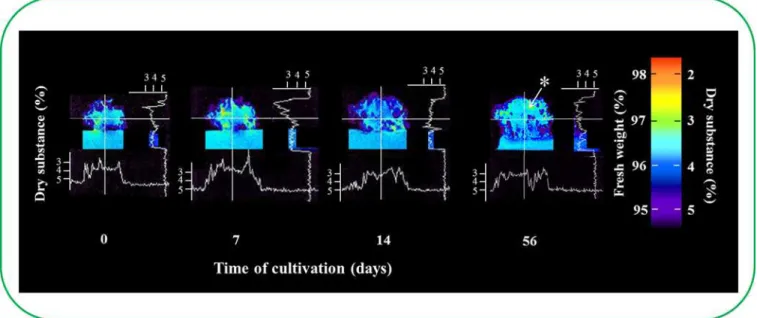
This study attempted to describe the differences in the cluster structure and to answer the ques-tion of whether the inner ESE cluster structure was connected with the transport of different substances from the cultivation medium into the cluster. In particular, the concentration of1H nuclei was determined by NMR to assess this method of transport. Concentration of1H nuclei determined the concentration of water in ESEs, which was reversely used to find the content of dry matter as it is shown inFig 4. Scans were taken of the weighted concentration of1H nuclei using MR imaging. A 2.0 mm thick incision was made in the selected sample position, and images were taken of a 30 × 30 mm (256 × 256 pixels) area with a resolution of 0.117 mm/ pixel. The samples were cultivated in plastic Petri dishes (50 mm in diameter) for 56 days. Mea-surements were performed on days 0, 7, 14 and 56 (Fig 4). At the same time, the dry weight Fig 2. Determination of viability of earlyPicea abiessomatic embryos in eight week old clusters (non-vital staining).(A) Schematic of the cluster structure of ESEs; (1) view from the top and (2) bottom, (a) inner part of cluster and (b) outer part of cluster. (B) Staining with 2,3,5-triphenyltetrazolium chloride (TTC). (C) Staining with acetocarmine; (a) embryos from the inner cluster, (b) embryos from the outer cluster.
was also determined. On the basis of the known dry weight in the cultivation medium, we determined the chromatic scale, dry weight quantity and consequently the water level in each cluster region. The obtained data indicated that there was a higher1H nuclei concentration in the outer ESE cluster compared with the inner cluster. This difference became more pro-nounced with the increasing cultivation time. These changes are associated with the changes in water content, which could be of interest for further studies because the fact that partial drying of somatic embryos at high relative humidity or desiccation in the presence of supersaturated solutions of salt is used to improve the efficiency of germination. Hazubska-Przybyl et al. found that ESEs of Norway Spruce used in this study react on the heat stress and their behav-iour differed from other ESEs [29]. During the first four weeks of cultivation, the ESE cluster seemed to be compactly aggregated; thereafter, the differences between the1H nuclei concen-tration in the inner and outer clusters were more evident. Additionally, embryos from both the outer and inner clusters appeared to be visibly different. The formation of a cavity was observed in the ESE clusters adjacent to the cultivation medium after more than 40 days of cultivation Fig 3. Determination of viability of regions ofPicea abiesembryos (vital staining).(A) A six week old cluster of ESEs was divided into six parts for subsequent cultivation. (B) Dependence of ESE viability on the cultivation time, which was detected by IA coupled with a fluorescence microscope. Embryos (~1 mg) used for the viability determination were prepared from six regions of the cluster. The cell material was mixed with fluorescein diacetate (FDA) and propidium iodide (PII), and the fluorescence was detected after 5 min by fluorescence microscopy. The percentage of green areas in the compact embryonal group of the embryos (marked by frames) was used to indicate live cells. Insets: upper inset–early somatic embryo (obtained from section 6b) stained with FDA/PI; bottom inset–early somatic embryo (obtained from section 1a) stained with FDA/PI. Average viability changes determined by (C) double FDA/PI staining and (D) esterase activity determination according to cultivation.
doi:10.1371/journal.pone.0144093.g003
(Fig 4) and it is label with an asterisk. Although ESEs from the outer cluster were clearly distin-guishable and the embryonal group was centrifugal-oriented, the inner parts of the cluster con-sisted of the mass formed by ESEs and polysaccharide [30,31,32]. The availability of the polysaccharide most likely inhibited the penetration of the fluorescent probes into the ESEs, thereby disabling the determination of ESE viability by double FDA/PI staining [30].
Growth of embryos obtained from various structures of the cluster
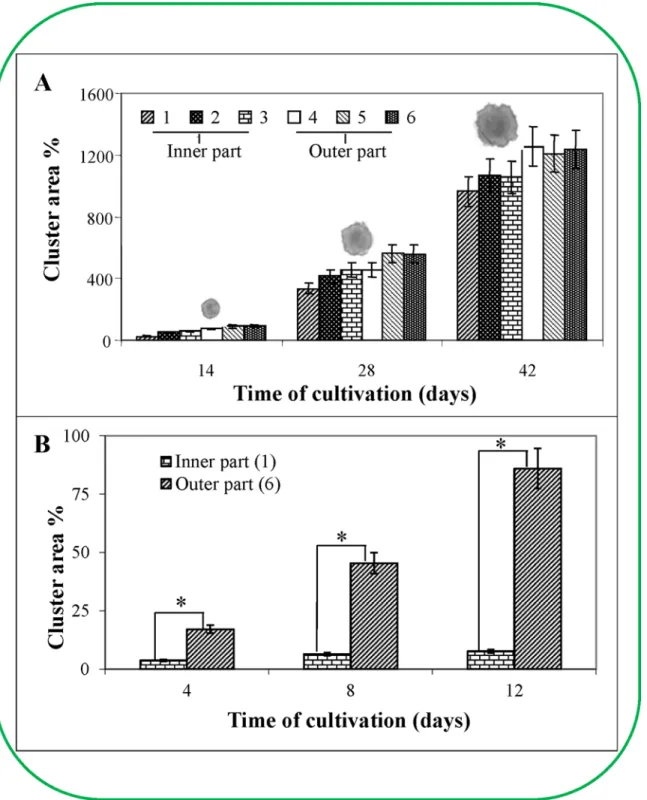
Based on the ESE viability determination, the embryos removed from individual ESE cluster regions cultivated for 45 days (6 parts similar to the viability determination) were placed into new cultivation medium and consequently cultivated for the next 45 days, with sub-cultiva-tions after each two week period. This experiment aimed to determine the cluster area from separate regions of a six-week old cluster. The most evident differences between the individual parts of the cluster were noted during the first 14 days of cultivation (Fig 5A). The outer regions were bigger (over 59.4%) than the inner regions. These differences decreased with the next sub-cultivation. Four weeks after the first cultivation, this distinction between the outer and inner clusters was 31.2%, and six weeks after the first cultivation the difference was only 6.5%. These data clearly indicated that there were differences in the growth characteristics between the outer and inner regions of various locations in the primary cluster (Fig 5A). Each region grew at a particular rate. For example, the inner parts where the older embryos predominated had the ability to grow and develop. The time required to reach the primary growth rate depended on the region of the ESE removed from the primary ESE cluster. As mentioned above, the embryos that originated in the outermost region of the primary six-week old clusters grew almost as quickly as the embryos from the two-week old clusters (the common time of sub-cultivation derived from the growth characteristics; please seeFig 5A). Interestingly, there was an increase in all six regions removed from different locations of the primary cluster (three from the outer and three from inner regions of the primary cluster, photos of the representa-tives of ESEs are as insets inFig 5A). It was also evident from the obtained data that the Fig 4. Comparison of the water volume in ESE clusters by NMR.Volume of dry substances in ESE clusters over time. Nuclear magnetic resonance was used to calculate the number of1H nuclei (colour scale). This number corresponds with the volume of water in the ESE clusters (dry substance in clusters).
*The formation of a cavity.
innermost embryos (centripetally towards the cluster centre) could grow after sub-cultivation, although they exhibited the slowest rate and required the longest time to reach the common Fig 5. The growth of six regions of the clusters.The growth of six regions of the ESE clusters was characterised by their area in culture medium at 2-week intervals (A) over 6 weeks (The average weight of a cluster was 40 mg at the beginning of the experiment. The values represent the average of 10 clusters.) (B) or 8 weeks of culture (The average weight of a cluster was 8.6 mg at the beginning of the experiment. The values represent the average of 10 clusters). In inset (A): photos of the representatives of ESEs.
doi:10.1371/journal.pone.0144093.g005
growth rate. The differences between the individual inner and outer regions (according toFig 3A) were very obvious and observable, especially during the first 14 days of cultivation. The most prominent differences were between the innermost and outermost regions from the pri-mary cluster surface, where the difference in the growth increase was up to 250% after 14 days of the first cultivation, 35% after 28 days and 30.1% after 42 days. There were found differences in some surface structures in seed ofPinus sylvestrisL. based on long term experiment with the aim on performing the experiments under various conditions [33]. Based on the obtained data, we could conclude that all embryos from the primary cluster were able to grow and develop despite the fact that vital embryonal cells from the inner regions of the primary cluster seemed to be nonvital due to their lack of double fluorescent FDA/PI staining. Vital (living) cells meta-bolise FDA to acetate and fluorescein, which is the proper fluorogenic substrate; in contrast, PI penetrates through damaged cytoplasmic membranes and then intercalates into the DNA, causing dead cells to fluoresce red [34]. This is very important because the lack of staining of the inner embryonal cells resulted in our inability to determine their viability despite the fact that these unstained cells were subsequently able to grow and develop.
Primary cluster
Next, we attempted to determine the age of the primary clusters. By measuring the oxidative-reduction reaction by TTC, we ascertained that the inner part of the primary ESE cluster remained unstained 65 days after the first cultivation, indicating that the cells were dead. We performed the analogous experiment with ESE clusters after 45 days of cultivation when the individual clusters were separated into six different parts. We found differences in the increase in the growth area between the inner and outer regions of the primary clusters. The time points chosen for this experiment were 4, 8 and 12 days (Fig 5B). After 12 days of cultivation, the increase in the area of the new clusters removed from the outer primary cluster was increased by 86%, which corresponded to the area increase of the two-week clusters. Conversely, the area increase in the regions removed from the inner primary cluster was 7.7% after 12 days of culti-vation. Thus, the embryonal cells originating from the inner regions of the ESE primary cluster grew very slowly after their transfer into new cultivation medium. These results indicate that the ESE characteristics change depending on the age (time of cultivation) of the ESEs. The results were further statistically treated and it was found that differences determined after 4 days long cultivation were significant (p<0.05, labelled with an asterisk,Fig 5B).
The effect of the cluster orientation
(p<0.05, labelled with an asterisk,Fig 6A). On the other hand, no significant difference was
found in 2 weeks old clusters, which could show the differences in structure among two and six weeks old clusters. The area increase after two weeks was approximately 40% higher than the increase observed in the six-week old clusters, which was found significant. This difference was probably due to the diverse ontogenetic stages of the investigated clusters [35]. The regions removed from the older ontogenetic embryos demonstrated slower growth than the regions removed from the two-week-old ESE clusters. However, this experiment was aimed at the investigation of different three-dimensional orientations of clusters in new cultivation medium. Fig 6. The effect of spatial orientation of the clusters by transposition into new culture medium on the growth of the cluster area after 14 days of cultivation.(A) Six week old ESE clusters of clone 2/32 placed in the normal orientation or upside-down in the culture medium after 14 days of cultivation. The average area of a cluster was 190 mm2at the beginning of the experiment. The values represent the average of 5 clusters. (B) Two week old ESE
clusters of clone 2/32 placed in the normal orientation or upside-down after 14 days of cultivation. The average area of a cluster was 22 mm2at the beginning of the experiment. The values represent the average of 5 clusters.
doi:10.1371/journal.pone.0144093.g006
The difference between two-week-old clusters with the same orientation and the inverse orien-tation was approximately 10% after 14 days of cultivation and 25% after 42 days of cultivation (Fig 6). Therefore, it may be necessary to keep ESEs in the same position when transferring them into new cultivation medium.
Experimental Section
Chemicals
All reagents were of ACS purity and were purchased from Sigma Aldrich Chemical Corp. (USA) unless otherwise noted. Celulysin was purchased from Calbiochem (USA). All solutions were prepared using deionised water (18.2 MO, Iwa 20, Watek, Czech Republic). Culture media were prepared using plant cell culture chemicals purchased from Duchefa Biochemie BV (Haarlem, The Netherlands) unless otherwise indicated. The pH value was measured using the WTW inoLab Level 3 with a level 3 terminal (Weilheim, Germany) controlled by a personal computer program (MultiLab Pilot; Weilheim, Germany). The pH-electrode (SenTix-H, pH 0–14/3 M KCl) was regularly calibrated with a set of WTW buffers (Weilheim, Germany).
Deionised water underwent demineralisation by reverse osmosis using the Aqua Osmotic 02 instrument (Aqua Osmotic, Tisnov, Czech Republic) and was subsequently purified using the Millipore RG (Millipore Corp., USA, 18 MΏ) MiliQ water system.
Plant culture
A culture of early somatic embryos (ESEs) of the Norway spruce (Picea abies(L.) Karst.) clone 2/32 was used in the current experiments. The clone was originally established at the Depart-ment of Plant Biology of Mendel University in Brno, Czech Republic, according to a procedure described by Durzan et al. [36]. The ESEs were maintained on a semisolid (Gelrite Gellan Gum, Merck, Germany) half-strength LP medium [37] modified by Havel [38,39]. The concen-trations of 2,4-dichlorofenoxyacetic acid and N6 benzyladenine were 4.4 and 9μM, respec-tively. The pH was adjusted to 5.7/5.8 prior to autoclaving (121°C, 100 kPa, 20 min). The organic part of the medium (except saccharose) was sterilised by filtration through a 0.2μm polyethylensulfone membrane (Puradisc 25 AS, Whatman, USA). Briefly, ten ESE clusters were cultivated in one plastic Petri dish (100 mm in diameter) containing 30 ml of medium. Sub-cultivation of the stock cultures was performed at 2 week intervals. The stock and experi-mental cultures were maintained in a cultivation box in the dark at 23±2°C.
Growth analysis
Weighing. The growth of ESE clusters was quantified by weighing on a digital balance (Denver Instrument, APX-153) at different time points. Before weighing, the semisolid medium was carefully cleared off from the clusters using phosphate buffer (pH 7.0). Weighing was performed as fast as possible to avoid desiccation of the clusters.
Computer image analysis. A charge-coupled device (CCD) camera was used to observe the growth of the spruce ESE cultures. Images of ESE clusters were recorded at the beginning of the cultivation period and at the indicated time points. The data were converted to digital images by the Grab–IT (version 1.3) program. The area of the ESE clusters in the digital images
was calculated by the Image–Pro Plus program (Sony, ver. 1.3). The data were processed in
Excel (Microsoft). Details regarding the other procedures used in this study can be found else-where [17].
with a cover slip. Subsequently, the sample was placed onto the platform of the microscope (Olympus AX 70, Japan). The images were magnified 40× by the Olympus 4040 digital camera and converted to a digital image in the Grab–IT (version 1.3) program.
Cell viability assay
Double staining. Modified double staining with fluorescein diacetate (FDA) and propidium iodide (PI) was performed to determine the viability of the ESEs [17]. FDA causes green fluores-cence in viable cells because the non-fluorescent FDA easily penetrates into viable cells and is hydrolysed to a brightly fluorescent fluorescein (λexcitation= 490 nm andλemission= 514 nm) that does not readily diffuse through the cytoplasmic membrane. The red fluorescence of PI (λexcitation= 536 nm andλemission= 620 nm) in cells shows that these cells are dead because this compound cannot pass through the functional cytoplasmic membrane. In our experiments, ESEs (~1.0 mg) were harvested and diluted with water to a final volume of 50μl. The stock solutions of PI and FDA were added to a final concentration of 20μg/ml and 1.0μg/ml, respectively. After 5 min of incubation at room temperature, the percentages of dead (red-stained cells) and viable cells (green-stained cells) were evaluated using an Olympus AX 70 fluorescence microscope with an Olympus cube U MWU coupled with a digital camera. The percent quantification of red (dead cells) and green areas (viable cells) in the compact embryonic group of single embryos was determined from the acquired digital images using an image analysis method (Image–Pro Plus,
ver. 1.3, Sony).
Metabolic assay. The viability test with 2,3,5-triphenyltetrazolium chloride (TTC) was used to obtain insights into metabolic processes. The TTC metabolic assay exploits enzymatic processes that occur in all living cells and organisms, such as oxidation-reduction reactions during photosynthesis or respiration. In this assay, the clusters of ESEs were incubated in a col-ourless 1% (w/w) solution of 2,3,5-triphenyltetrazolium chloride (TTC) for 24 hours. The TTC is taken up by the live cells and reduced to a water-insoluble red formazan by oxidative enzymes. Dead cells remain colourless after incubation with TTC. After 24 hours of incubation at room temperature, the results were photographed using an Olympus (SZH 10) microscope connected to an Olympus (4040 Zoom) digital camera.
Esterase assay. ESE cultivation medium was removed by centrifugation (360 × g; 5 min; 20°C; centrifuge: MR 22, Jouan, USA). The cells were washed twice with 50 mM potassium phosphate buffer (pH 8.7). The harvested ESEs (app. 200 mg) were mixed with extraction buffer (250 mM potassium phosphate, pH 8.7) to a final volume of 1.0 ml and homogenised using a Potter_Elvehjem homogeniser (Kavalier, Czech Republic) placed in an ice bath for 10 min. The redox state of the obtained solution was maintained by the addition of 1.0 mM dithiothreitol (DTT). The homogenised samples were sonicated for 1.0 min in an ice bath using a Transsonic T310 sonicator (Czech Republic). The homogenate was centrifuged at 10,000 rpm for 15 min at 4°C (centrifuge MR 22, Jouan, USA). An aliquot (5.0–20μl) of the
supernatant was mixed with potassium phosphate buffer (995–980μl, 1.0 M, pH 8.75). The
reaction was started with the addition of FDA to a final concentration of 5.0μM. The final vol-ume of the reaction mixture was 1.0 ml. An equal volvol-ume of the extraction buffer was used as a blank sample. After incubation (15 min, 45°C, dry block, Major Science, Taiwan), an aliquot (between 5.0 to 20μl) of the reaction mixture was added to 5.0 mM potassium phosphate buffer (pH 8.7, 1980–1995μl). The fluorescence (λexcitation490 nm andλemission514 nm) was
read immediately using a spectrofluorometric detector (RF-551, Shimadzu, USA). A stock solution of FDA was prepared in acetone and dried with anhydrous calcium chloride. The amount of acetone did not exceed 1% (v/v) in the reaction mixture. Esterase activity in interna-tional units (IU, one unit liberates oneμmol of fluorescein per minute under specified
conditions) was recalculated to relative units (100% represents the highest activity measured in an experiment).
Acetocarmine staining. The staining methods utilising non-living dyes are based on the penetration of the dyes through disrupted membranes of dead cells and are used to stain cells killed by fixation or directly on living cells. The staining process may also be connected with the tracking of cells killed by the respective staining mixture. This study employed a staining technique based on an aceto-staining agent called acetocarmine solution (solution of carmine in acetic acid). Carmine is a staining agent that penetrates through cell membranes and binds to chromatin. The bound chromatin is stained in bright to dark red colour tones depending on the type of chromatin (i.e., euchromatin and heterochromatin). Compared to other dyes (such as orcein), carmine distinguishes both the chromatin structure and chromosomes during mito-sis. In the present experiment, ESEs (~1.0 mg) were harvested and stained without delay with a 1.0% solution of carmine (1.5 g carmine in 100 ml 45% acetic acid;v/v). Herein, dead and non-living cells were markedly stained red (dark red nucleus, bright pink cytoplasm), whereas non-living and viable cells exhibited no colour.
Nuclear magnetic resonance
Tomography based on magnetic resonance was used to study changes in the1H nucleus spin density in ESEs. The experiments were performed on a 4.7 T/120 mm (i.e., 200 MHz for1H nuclei) MRI scanner (Magnex magnet, MR Solution electronics and software) at the Institute of Scientific Instruments, Brno. Actively shielded Magnex gradient coils yielded a maximum gradient field magnitude of 180 mT/m. The samples to be measured were cultivated in a plastic Petri dish (50 mm in diameter). MR images were acquired using a classic Spin Echo pulse sequence with the following parameters: echo time (TE) = 12 ms, repetition time (TR) = 3.8 s, matrix size = 256 × 256 pixels (30 × 30 mm with resolution 0.117 mm per pixel), slice thick-ness = 2 mm and number of averages of the MR signal was (NA) = 5. The obtained data were processed with the MAREVISI and MATLAB programs.
Descriptive statistics
Data were processed using MICROSOFT EXCEL1(USA) and STATISTICA.CZ Version 8.0 (Czech Republic) unless noted otherwise. Results are expressed as mean ± standard deviation (S.D.) unless noted otherwise (EXCEL1). Statistical significances of the differences between cluster area and time of cultivation were determined using STATISTICA.CZ. Differences with p<0.05 were considered significant and were determined by using of one way ANOVA test
(particularly Scheffe test), which was applied for means comparison.
Conclusion
Author Contributions
Conceived and designed the experiments: JP VA LH RK. Performed the experiments: JP OZ KB. Analyzed the data: NAA EP VA. Contributed reagents/materials/analysis tools: LH RK. Wrote the paper: OZ KB NAA LH RK.
References
1. Zimmerman JL (1993) Somatic embryogenesis—A model for early development in higher-plants. Plant Cell 5: 1411–1423. PMID:12271037
2. Boo KH, Cao DV, Pamplona RS, Lee D, Riu KZ, Lee DS (2015) In vitro plant regeneration of Aster sca-ber via somatic embryogenesis. Biosci Biotechnol Biochem 79: 725–731. doi:10.1080/09168451. 2014.996202PMID:25640866
3. Kumar V, Moyo M, Van Staden J (2015) Somatic embryogenesis of Pelargonium sidoides DC. Plant Cell Tissue Organ Cult 121: 571–577.
4. Leljak-Levanic D, Mihaljevic S, Bauer N (2015) Somatic and zygotic embryos share common develop-mental features at the onset of plant embryogenesis. Acta Physiol Plant 37: 1–14.
5. Nic-Can GI, Galaz-Avalos RM, De-la-Pena C, Alcazar-Magana A, Wrobel K, Loyola-Vargas VM (2015) Somatic Embryogenesis: Identified Factors that Lead to Embryogenic Repression. A Case of Species of the Same Genus. PLoS One 10: 1–21.
6. Raju CS, Aslam A, Shajahan A (2015) High-efficiency direct somatic embryogenesis and plant regener-ation from leaf base explants of turmeric (Curcuma longa L.). Plant Cell Tissue Organ Cult 122: 79–87. 7. Feher A (2015) Somatic embryogenesis—Stress-induced remodeling of plant cell fate. Biochim
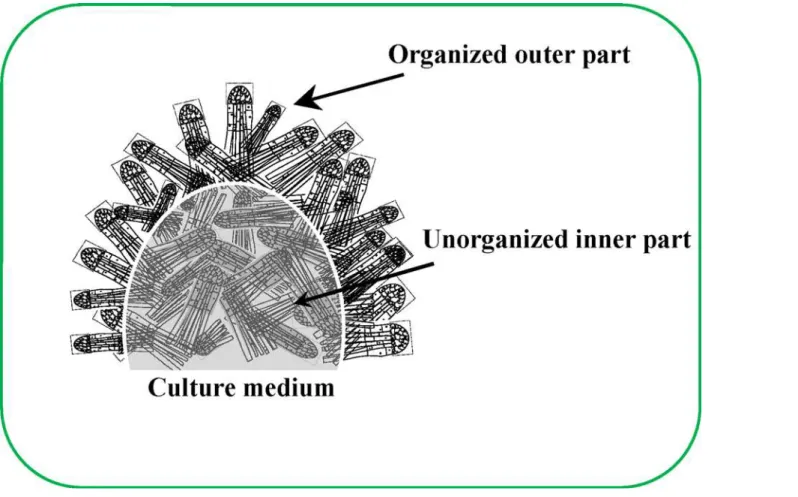
Bio-phys Acta-Gene Regul Mech 1849: 385–402. Fig 7. Schematic representation of the structure of the ESE cluster.
doi:10.1371/journal.pone.0144093.g007
8. Gomez-Garay A, Manzanera JA, Pintos B (2014) Embryogenesis in Oak species. A review. For Syst 23: 191–198.
9. Smertenko A, Bozhkov PV (2014) Somatic embryogenesis: life and death processes during apicalbasal patterning. J Exp Bot 65: 1343–1360. doi:10.1093/jxb/eru005PMID:24622953
10. Chi C-M, Vits H, Staba EJ, Cooke TJ, Hu W-S (1994) Morphological kinetics and distribution in somatic embryo cultures. Biotechnol Bioenerg 44: 368–378.
11. Chi C-M, Zhang C, Steba EJ, Cooke TJ, Hu W-S (1996) An andvanced image analysis system for eval-uation of somatic embryo development. Biotechnol Bioenerg 50: 65–72.
12. Olofsdotter M (1993) Image processing: a non-destructive method for measuring growth in cell and tis-sue culture. Plant Cell Rep 12: 216–219. doi:10.1007/BF00237057PMID:24197023
13. Hamalainen JJ, Kurten U, Kauppinen V (1993) Classification of plant somatic embryos by computer vision. Biotechnol Bioenerg 41: 35–42.
14. Padmanabhan K, Cantliffe DJ, Harrell RC, Harrison J (1998) Computer vision analyses of somatic embryos of sweet potato [Ipomoea batatas(L.) Lam.] for assessing their ability to convert to plants. Plant Cell Rep 17: 681–684.
15. Honda H, Ito T, Yamada J, Hanai T, Matsuoka M, Kobayashi T (1999) Selection of embryogenic sugar-cane callus by image analyses. J Biosci Bioeng 87: 700–702. PMID:16232542
16. Schroder P, Fischer C, Debus R, Wenzel A (2003) Reaction of detoxification mechanisms in suspen-sion cultured spruce cells (Picea abies L. Karst.) to heavy metals in pure mixture and in soil eluates. Environ Sci Pollut Res 10: 225–234.
17. Petrek J, Vitecek J, Vlasinova H, Kizek R, Kramer KJ, Adam V, et al. (2005) Application of computer imaging, stripping voltammetry and mass spectrometry for study of the effect of lead (Pb-EDTA) on growth and viability of early somatic embryos of Norway spruce (Picea abies /L./ Karst.). Anal Bioanal Chem 383: 576–586. PMID:16220262
18. Garcia-Mendiguren O, Montalban IA, Stewart D, Moncalean P, Klimaszewska K, Rutledge RG (2015) Gene Expression Profiling of Shoot-Derived Calli from Adult Radiata Pine and Zygotic Embryo-Derived Embryonal Masses. PLoS One 10: 1–19.
19. Duval I, Lachance D, Giguere I, Bomal C, Morency MJ, Pelletier G, et al. (2014) Large-scale screening of transcription factor-promoter interactions in spruce reveals a transcriptional network involved in vas-cular development. J Exp Bot 65: 2319–2333. doi:10.1093/jxb/eru116PMID:24713992
20. Vondrakova Z, Eliasova K, Vagner M, Martincova O, Cvikrova M (2015) Exogenous putrescine affects endogenous polyamine levels and the development of Picea abies somatic embryos. Plant Growth Regul 75: 405–414.
21. Capataz-Tafur J, Hernandez-Sanchez AM, Rodriguez-Monroy M, Trejo-Tapia G, Sepulveda-Jimenez G (2010) Sucrose induces arabinogalactan protein secretion by Beta vulgaris L. cell suspension cul-tures. Acta Physiol Plant 32: 757–764.
22. Letarte J, Simion E, Miner M, Kasha KJ (2006) Arabinogalactans and arabinogalactan-proteins induce embryogenesis in wheat (Triticum aestivum L.) microspore culture. Plant Cell Reports 24: 691–698. PMID:16133349
23. Huska D, Zitka O, Krystofova O, Adam V, Babula P, Zehnalek J, et al. (2010) Effects of cadmium(II) ions on early somatic embryos of Norway spruce studied by using electrochemical techniques and nuclear magnetic resonance. Int J Electrochem Sci 5: 1535–1549.
24. Karcz W, Kurtyka R (2007) Effect of cadmium on growth, proton extrusion and membrane potential in maize coleoptile segments. Biol Plant 51: 713–719.
25. Nada E, Ferjani BA, Ali R, Bechir BR, Imed M, Makki B (2007) Cadmium-induced growth inhibition and alteration of biochemical parameters in almond seedlings grown in solution culture. Acta Physiol Plant 29: 57–62.
26. Tukaj Z, Bascik-Remisiewicz A, Skowronski T, Tukaj C (2007) Cadmium effect on the growth, photo-synthesis, ultrastructure and phytochelatin content of green microalga Scenedesmus armatus: A study at low and elevated CO2 concentration. Environ Exp Bot 60: 291–299.
27. Wu Q, Su NN, Chen Q, Shen WB, Shen ZG, Xia Y, et al. (2015) Cadmium-Induced Hydrogen Accumu-lation Is Involved in Cadmium Tolerance in Brassica campestris by Reestablishment of Reduced Gluta-thione Homeostasis. PLoS One 10: 1–6.
28. Elloumi N, Zouari M, Chaari L, Ben Abdallah F, Woodward S, Kallel M (2015) Effect of phosphogypsum on growth, physiology, and the antioxidative defense system in sunflower seedlings. Environ Sci Pollut Res 22: 14829–14840.
30. Rejon JD, Delalande F, Schaeffer-Reiss C, Carapito C, Zienkiewicz K, Alche JD, et al. (2013) Proteo-mics profiling reveals novel proteins and functions of the plant stigma exudate. J Exp Bot 64: 5695– 5705. doi:10.1093/jxb/ert345PMID:24151302
31. Sala K, Potocka I, Kurczynska E (2013) Spatio-temporal distribution and methyl-esterification of pectic epitopes provide evidence of developmental regulation of pectins during somatic embryogenesis in Arabidopsis thaliana. Biol Plant 57: 410–416.
32. Vatankhah E, Niknam V, Ebrahimzadeh H (2014) Histological and biochemical parameters of Crocus sativus during in vitro root and shoot organogenesis. Biol Plant 58: 201–208.
33. Tillman-Sutela E, Kauppi A (2014) Maturity of surface structures in northern Pinus sylvestris L. seeds: A key to improved prediction of germination potential. Flora 209: 45–53.
34. Vitecek J, Petrlova J, Adam V, Havel L, Kramer KJ, Babula P, et al. (2007) A fluorimetric sensor for detection of one living cell. Sensors 7: 222–238.
35. Blazquez S, Olmos E, Hernandez JA, Fernandez-Garcia N, Fernandez JA, Piqueras A (2009) Somatic embryogenesis in saffron (Crocus sativus L.). Histological differentiation and implication of some com-ponents of the antioxidant enzymatic system. Plant Cell Tissue Organ Cult 97: 49–57.
36. Durzan DJ, Jokinen K, Guerra MP, Santerre A, Chalupa V, Havel L (1994) Latent diploid parthenogene-sis and parthenote cleavage in egg-equivalents of Norway spruce. Int J Plant Sci 155: 677–688. 37. VonArnold S (1987) Improved efficiency of somatic embryogenesis in mature embryos of Picea-abies
(L) Karst. J Plant Physiol 128: 233–244.
38. Havel L, Durzan DJ (1996) Apoptosis during diploid parthenogenesis and early somatic embryogenesis of Norway spruce. Int J Plant Sci 157: 8–16.
39. Havel L, Durzan DJ (1996) Apoptosis in plants. Bot Acta 109: 268–277.