Gas and Particle Flow in a Spray Roaster
S. Johansson
1†, L. G.Westerberg
1, and T. S. Lundstr¨om
1Division of Fluid and Experimental Mechanics, Lule˚a University of Technology, SE-971 87 Lule˚a, Sweden
†Corresponding Author Email:[email protected]
(Received April 19, 2013; accepted July 9, 2013)
ABSTRACT
In the steel industry, waste hydrochloric acid is produced through the process to pickle steel slabs for removal of corrosion. Regenerated hydrochloric acid is obtained by separating the chloride gas from the waste product through spray roasting. This process also produces a by-product in the form of iron oxide which is sold to different industries. The present study is a continuation of a study arising from the need to better understand the dynamics inside the regeneration reactor, which in turn will improve possibilities to optimize the regeneration process, which to date has been manually adjusted by trial and error. In this study the velocity and temperature distribution inside the reactor is numerically modelled together with the droplet motion through the reactor. The main objective is to investigate the influence of a changed spray nozzle position on the flow characteristics of the continuous and dispersed phase, and the relation between temperature and energy efficiency and the regeneration process. Numerical models of the type of flow present in the regeneration reactor are not represented to any major extent in the literature, making the present study relevant to the engineers and researchers active in the steel industry and the application in question.
Keywords: Two-phase flow, Hydrochloric acid regeneration, Particle transport, Energy efficiency, Spray nozzle position.
NOMENCLATURE
Af cross section area of a particle Cε1,Cε2 model constants
CFD computational Fluid Dynamics
e error
fi external force
GCI grid Convergence Index h latent heat of water
hc heat transfer due to convection hr heat transfer due to radiation k turbulent kinetic energy kf thermal conductivity L characteristic length
M million
Nu Nusselt number p order of solution
P ensamble-averaged pressure Pr Prandtl number
r radial co-ordinate
ri j ratio between indexed mesh sizes Re Reynolds number
Rep particle Raynolds number
RNG Renormalized Group RSM Reynolds Stress Model
RANS Reynolds Averaged Navier- Stokes S rate of strain
T temperature
Ta volume averaged temperature Ui ensamble-averaged velocity ui velocity fluctuations uiuj turbulent Reynolds stresses vp,f Particle/fluid velocity v0p particle velocity at the
beginning of the cell
ε dissipation rate of turbulent energy εm surface emissivity
λ thermal conductivity of the fluid µ laminar dynamic viscosity µt turbulent viscosity ρ fluid density σε,σk model constants
1. INTRODUCTION
Hydrochloric acid (HCl) is used in the steel indus-try to remove iron oxide complexes from sheets aimed for high strength steels Johansson (2010). The process is calledpicklingand implies that steel sheets are pulled through a container with acid whereupon the iron oxide on the metal surface re-acts with the acid and dissolves into it. In steel in-dustries it is generally preferred that the waste HCl is regenerated rather than being shipped away for destruction, as the latter is a more expensive alter-native. The regeneration process in question in the present study is carried out using thespray roasting technique, a process which is driven by four gas burners placed symmetrically along the periphery of the reactor at a level just above the conical sec-tion; seeFig. 1. Waste acid is sprayed into the reac-tor through spray nozzles near the top, while chlo-ride gas is collected at the top of the reactor. The by-product in the form of hematite, i.e. the mineral form of iron (III) oxide (Fe2O3), is produced and collected at the bottom of the reactor. The hematite is sold and used in e.g. the electronics industry and as filling material in road constructions. The by-product from the regeneration process is thus re-cycled, contributing to environmental sustainability and to economic benefits from HCl regeneration.
Up to around the 1960s, sulphuric acid (H2SO4) was used in most pickling plants, but nowadays HCl is the most used acid Kladnig (2008). The physical details of the regeneration process are not known. The quality of the regeneration/ drying pro-cess which directly mirrors the quality of the iron oxide is of certain importance since the profitabil-ity of the product is dependent on it. The pro-cess is tuned by adjusting the inflow of waste acid (speed and direction) and the burner mass flow rate. To better understand the drying process, it is es-sential to have a picture of the gas flow dynam-ics inside the reactor. The flow behaviour inside the reactor is also of interest from a specifically fluid mechanical perspective, as it is characterized by a complex flow including a turbulent swirling motion. Only a few studies have been presented that scrutinize the regeneration process in the spray roaster. Nevertheless the regeneration process it-self in terms of different approaches has attracted more attention within the research community in question. Two ways of regenerating HCl, through the membrane and pyrometallurgical techniques re-spectively, were presented in the work by Regel-Rosocka (2010). Other acid regeneration processes are theprecipitation/neutralization, and evaporation processes as described by Regel-Rosocka (2010) where it is shown that the pyrometallurgical tech-niques can be carried out in two ways, using flu-idized beds and the spray roasting process
respec-2
The present study is part of an overall approach of building a full numerical model of the regeneration process, and is a development of the work made byJohansson et al. (2010)andWesterberg et al.
(2011), who designed a first numerical approach to-wards resolving the flow dynamics in the regenera-tion reactor together with the temperature and par-ticle distribution. The focus in the present study is on the change in flow and temperature dynamics in-side the reactor due to a changed spray nozzle loca-tion, and their impact on droplet motion through the reactor together with the impact on the energy effi-ciency. The numerical models in the present study are made with specifications from an existing plant. There are however many similar plants around the world that works on the same principles, but the di-mensions might be different depending on the need of regeneration capacity of HCl.
CFD is generally a very useful tool to investigate both fundamental fluid flow properties and prob-lems related to engineering applications. Modern codes are also highly suitable for multiphysical ap-proaches like the present study. To exemplify the versatility of recent CFD simulations we highlight the following studies: byGibson and Schild (2009) using CFD in astrophysical applications, Stouffs (2011)on hot air engines,Marjavaaraet al. (2007) on hydraulic diffusers, Avinash et al. (2013) on Bingham flows,Choudhury and Hazarika (2013)on multi-physical magnetohydrodynamic flows, and Lundstr¨omet al.(2010)on fish guiding devices.
2. SET-UP
By resolving the temperature and velocity pro-files inside the reactor in combination with parti-cle transport, the effect of changing the nozzle po-sitions at the top of the reactor on these quantities will be investigated. Variables in focus are the out-let temperature and dropout-let position and time taken tively two techniques which are described in detail byKladnig (2008). In terms of numerical simula-tions of the regeneration process,Becket al.(2007b)
andBecket al.(2007a)have used Computational Fluid Dynamics (CFD) to model the flow in the re-actor with special emphasis on the coupling to the chemistry of the pickling process and the regenera-tion of the waste product. RecentlyShiemannet al.
(2012)performed a dual experimental and numeri-cal study of spray roasting of FeCl , in which a lab-oratory scale model was used. Numerical models of the regeneration chemistry, in isolation or in com-bination with the reactor flow and the thermal dy-namics, are relatively scarce in the literature. In ad-dition to the work byShiemannet al. (2012)cited above, Beck et al. (2007b) and Beck et al.
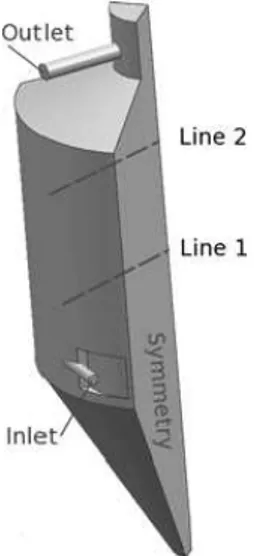
Fig. 1.Schematic view of the reactor geometry rep-resented by one quarter of the domain. The spray roasting process is driven by the four burners placed along the periphery of the reactor. Waste acid is in-jected through spray nozzles at the top of the reac-tor. Chloride gas is collected at the outflow location while precipitated solid iron oxide falls to the bot-tom of the reactor, where it is collected.
for the droplets to fully evaporate. The outlet is set perpendicular to gravity in order to reduce the in-flow of cold air into the process; see Fig. 1. The outlet temperature is of certain interest with respect to the regeneration process, since the thermal losses have to be minimized in order for the process to be as efficient as possible. Furthermore, for fuel effi-ciency, it is of particular interest to investigate the wall temperature and related heat loss through the wall. Droplet evaporation time and position are im-portant, since the quality of the particles has to be uniform; which means that their trajectories have to be as similar as possible. It is also important that particles are evaporated before they hit the wall in order to reduce agglomeration, which can cause problems. With regard to the velocity, the verti-cal component is most significant, since it together with gravity transports the droplets through the pro-cess. The whole-field temperature distribution is also of importance since it gives information about where particles evaporate.
3. GOVERNING EQUATIONS AND NU -MERICS
The simulations are carried out with the commer-cially available numerical code ANSYS CFX-13. The fluid is considered incompressible as the Mach number of the flow is significantly below 0.1, lead-ing to negligible changes in fluid density due to compression. Considering an unsteady flow of an incompressible Newtonian fluid, the
Reynolds-average Navier-Stokes (RANS) equations are writ-ten as
ρ∂Ui ∂t +ρ
∂UjUi ∂xj
=ρfi+
∂ ∂xj
−Pδi j+µ
∂Ui ∂xj
+∂Uj
∂xi
−ρuiuj
(1)
whereρ is the density of the fluid, µ the laminar dynamic viscosity,Pthe ensemble-averaged pres-sure,Uiand fithe ensemble-averaged velocity and external force components, and ui the fluctuating velocity. The last term on the right hand side is turbulent (Reynolds) stresses due to the fluctuations in velocity field, which are determined according to the Boussinesq eddy viscosity assumption. The continuity and energy equations additionally apply to the RANS equations.
3.1 Turbulence Model
The two-equation model k−εis one of the most used turbulence models today as it is applicable to a large variety of flow scenarios, and is also cheap to use in terms of computational cost. Today the k−εmodel is the more common name for a family of special variations of the model as originally de-scribed. Thek−εmodel has been tailored to work for different flow scenarios. One example is the Renormalized Group (RNG)k−εturbulence model which is sensitive enough to account for turbulent flow on a smaller scale through the re-normalized Navier-Stokes equations. Thek−εmodel is writ-ten as
∂(ρk)
∂t +
∂(ρUjk) ∂xj
= ∂
∂xj
µ+µt
σk
∂k
∂xj
+Pk−ρε
(2)
∂(ρε)
∂t +
∂(ρUjε) ∂xj
= ∂
∂xj
µ+µt
σε
∂ε
∂xj
+
+k
ε(Cε1Pk−Cε2ρε) (3)
whereµt is the turbulent viscosity andσε,σk,σε1 and σε2 are model constants Launder and Spald-ing (1974). Two variants of the k−ε model are represented by the Renormalized Group (RNG) model introduced above, and the Realizable model respectively Yakhot et al. (1992), Shih et al.
a comparison of how these threek−εturbulence models perform as compared to a more advanced Reynolds Stress Model (RSM). Experimental re-sults showed that the RNGk−εturbulence model performs better than the standardk−εmodel and the Realizablek−εmodel, and almost as good as the more computationally costly RSM. It was also shown that the standardk−εmodel and the Real-izablek−εmodel under-predicted the velocity in the inner region of the swirling velocity field. In this paper, the RNGk−εmodel is considered with respect to the actual application of swirling (spray) drying flow.
The Reynolds number for the continuous phase is of the order of 105at the inlet level (top of the re-actor), while the corresponding value at the burner level is of the order of 5·105.
3.2 Coupling Between Phases
The continuous phase is treated as Eulerian while the dispersed phase is modelled with a Lagrangian approach where the dispersed phase is solved every fifth iteration of the continuous phase. The phases are two-way coupled so that the dispersed phase is not only affected by the continuous phase but also contributes to the continuous phase by adding or subtracting source terms into the momentum, continuity and energy equationsSommerfeldet al.
(2008). A turbulence model solely for the dis-persed phase is not considered. The particles ve-locity is calculated through the analytical solution of the particle momentum equation
vp=vf+ v0p−vfe δt
τ +Fall
1−e δt
τ
, (4)
where index pand f denotes particles and fluid re-spectively. 0 is the particle velocity at the beginning of the cell andτthe aerodynamic relaxation time. Fall is the sum of forces acting on the particles in this case buoyancy and drag which are calculated as
FB= (mp−mf)g, (5)
FD= 1 2CDρfAf
vf−vp
(vf−vp), (6)
whereCD is the drag coefficient andAf the cross section area of the particle. The convective heat transfer is calculated by
QC=πdλNu(Tf−Tp), (7)
where λ is thermal conductivity of the fluid and Nu the Nusselt number which is calculated with
the Ranz-Marshall correlation according toTosun (2002)
Nu=2+0.6Re 1 2
pPr
1
3. (8)
HereRepandPris the Reynolds number based on the particle diameter and the Prandtl number re-spectively. The type mass transfer from drop to continuous phase is determined by the Antoines equation
pvap=pscalee ATdB
−C, (9)
where A, B and C are constants; see Johansson 2010. If the exponential term is larger than 1 the vapor pressurepvapis larger than the ambient pres-sure and boiling will occur, resulting in
dmd dt =−
QC
h , (10)
whereh is the latent heat of water. In the present paper boiling is the dominant mass transfer. For details about the non-boiling mass transfer readers are referred to Abrahamzon and Sirigano (1988). Mass, heat and the forces are introduced to the momentum-, continuity and energy equation as sources or sinks.
4. GEOMETRY, MESH AND BOUNDARY CONDITIONS
4.1 Geometry and Simulation Model
the quality and trust work is focused on the grid in-dependency and validation with data from the lab-scale model thatHuanget al.(2004)used. InTable 1, results from the grid study are presented. The results are from simulations with 10.6M, 6.4M and 1.3M nodes respectively. For the quality and trust in computational flow calculations it is highly im-portant that the numerical model should show grid independency characteristics, meaning that the re-sult for a chosen variable changes with the grid size up to a certain number of nodes. Grid independency is usually investigated using the Richardson extrap-olation method. Results from the Richardson ex-trapolation study are presented inTable 1. In the present study the mesh with 6.4M nodes is used. For details of the Richardson extrapolation method we refer toFerziger and Peric (2002).
Table 1 Results from the Richardson extrapolation whereris the ratio between indexed mesh sizes,Ta the volume averaged temperature,pthe order of the solution,ethe error and GCI the Grid Convergence Index. Subscripts 4, 5 and 6 denote the mesh num-ber andext denotes extrapolated values. Mesh #4 corresponds to the 1.3M grid, mesh #5 the 6.4M grid, and mesh #6 the 10.6M grid respectively.
r12 r32 Tamesh6 Tamesh5 Tamesh4 1.16 1.75 797.05 800.79 830.97
Taext Tapresent p e56 e56ext
791.94 791.46 2.92 0.47% 0.64%
GCI56ext − − − −
0.8% − − − −
4.2 Mesh
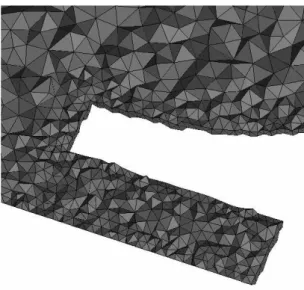
ANSYS ICEM CFD was used to create the meshes for the simulations. The geometry is complex at the inlet region, due to the inflow of burner gas and the location of a so called kick-out designed to redi-rect the flow in order to avoid inflow of gas into the burner chamber (Westerberget al. 2011). Due to the complexity at the burner region the mesh is generated by tetrahedrons with a bulk spacing of approximately 90 mm and a near-wall spacing of approximately 30 mm. The near-wall region is 20 elements thick. An expansion ratio of 1.3 for each element is applied until the bulk spacing is reached. The inlet and the outlet region have the same grid size as the wall throughout the volume. The total number of nodes is 1.8·106and the same mesh is used for the three different nozzle positions. The mesh for the present study was adjusted in order to reduce the number of elements with small angles and a high aspect ratio in order to facilitate the con-vergence of the solution. Figure 2shows the mesh close to the burner region in the reactor where it is shown to have a well resolved mesh in order to cap-ture the dynamics of the flow, particle transport and evaporation of droplets.
The calculations have been performed on the re-search groups own computer (parallel PC) cluster comprising 300 nodes and 12 single 8-node com-puters. Our ANSYS CFX licences cover full usage of the cluster.
Fig. 2. The computational mesh near the burner region of the regeneration reactor.
4.3 Boundary conditions
Heat transfer through radiation is not considered. The reason for this is that radiation stands for less than 10 %mof the heat transfer. This result follows from the expression of the heat transfer due to radi-ation, given by
hr=
σbεm(T14−T24)
T1−T2 , (11)
where T1 andT2 are the particle temperature and surrounding region temperature respectively, σb the Stefan-Bolzmann constant, andεm the surface emissivity which can be approximated as unity. The corresponding contribution due to convection follows from the definition of the Nusselt number, which when solving forhcresults in
hc= Nu·kf
L , (12)
wherekf the thermal conductivity of the fluid, and L a characteristic length (here chosen as the reac-tor diameter). In ANSYS CFX the Ranz Marshall correlation (seeEq. 6) is used in the model for heat transfer. The R-M correlation shows that the Nus-selt number for a droplet following the continuous phase streamlines is of the order of 2 sinceRepand the Pr are small. With a thermal conductivity of the continuous phase (considered having the ther-mal properties of air) of the order of 0.04 bar the hr-hcratio is of the order of 0.1, meaning the heat transfer from radiation can be considered small and thus can be disregarded in the model.
4.4 Validity of Model Simplifications
In the present model, a mixture of air and vapour is used to represent the exhaust gas from the burners. The estimation of the mass fraction vapour is cru-cial since the specific heat of vapour significantly differs from air and a low fraction of vapour would imply that the droplets evaporate without boiling. The mixture of N2, CO2and O2is of less impor-tance since these gases have almost the same prop-erties and can therefore be approximated as air with the properties of an ideal gas. To model the energy balances correctly, evaporation, heat loss through the walls and chemical reactions have to be mod-elled. The evaporation consumes the largest pro-portion of energy and is modelled in these simula-tions, as are the heat loss through the walls, which are estimated by deriving the heat transfer coeffi-cient to 0.6 W/m2K.
The process chemistry is not considered in this study, neither is the full particle formation process. Instead, a simplified particle evaporation model has been used where the particle consists of water and a remaining solid fraction. A complete model of
the formation of iron oxide from iron chloride is hence not present. The impact of these simplifi-cations on the quality of the actual model is here further discussed. Considering a droplet from the injection into the reactor through the spray noz-zles to the formed by-product, the droplet goes through a set of different stages: The evaporation process is generally divided between the evapora-tion of excess water and that of chemically bound water. The chemically bound water will split from the iron chloride molecule at higher temperature and with slower kinetics compared to the excess water, which leads to a changed evaporation pro-cess (Shiemann et al. 2012). This in turn may have an impact on the dynamics in the reactor. The particle motion can also be affected by the particle formation process, where typically the particles are formed as hollow spheres, leading to an increased cross section and a decreased density (Shiemann
et al.2012).
The present model without the process chemistry or the full particle formation process described above is considered as a first order solution of the flow dy-namics as these two processes not alone dominate the flow dynamics in the reactor. The flow in the reactor is heavily steered by the swirl generated by the four gas burners placed symmetrically around the periphery of the reactor. The combustion of the injected droplets will affect the dynamics inside the reactor, mainly due to variations in the temperature which in turn will induce buoyancy effects, and ul-timately affect the particle pathway, since the buoy-ancy effect mainly influences the vertical velocity. Nevertheless, the velocity in the azimuth direction is several orders of magnitude higher than the ver-tical velocity. Overall it is important to remember that the present study is a tool for understanding the dynamics inside the reactor in order to build an understanding of the regions inside the reactor that are important for the regeneration process and how the changed flow will affect the energy efficiency. Taking this scenario as a base for the results, we are convinced that the conclusions obtained with the model simplifications presented above are in-deed valuable, not least for the engineering science community dealing with numerical modeling.
of the roughness of the wall) in terms of vertical behaviour and particle agglomeration. The effect of the surface roughness on a more global scale in terms of the overall flow dynamics is however considered to be non-dominating, and as a conse-quence, the first order approach treated in this study comprises smooth walls.
5. RESULTS
In this section, results for the outlet temperature, temperature distribution and vertical velocity dis-tribution in the regeneration reactor, together with the distribution of evaporated particles in the reac-tor, are presented for the three different positions of the spray nozzles. The four spray nozzles located at the top of the reactor are placed symmetrically along a circle centered on the center of the reactor. The nozzle positions considered in this study are:r = 0.5, 1.5 and 3 m, respectively.
5.1 Impact of Nozzle Position on Temperature Distribution and Droplet Evaporation
In terms of the energy efficiency of the drying pro-cess, the outlet temperature is a valid indicator. In Table 2, results are presented for the outlet temper-ature for three nozzle positions. It is shown that almost identical results are obtained for nozzle po-sitionr= 0.5 m andr= 1.5 m respectively, while a higher outlet temperature is derived when the spray nozzles are located atr= 3 m. An explanation for this result is that by placing the nozzles closer to the wall the particles will evaporate in a limited region close to the wall so that the temperature close to the wall will be lower due to droplet evaporation and cause cold air close to the wall to sink through the process, which in turn reduces the heat loss through the wall. For the scenario of a position close to the center, the core region in the upper part will be colder and cause cold air to sink in the inner region. These effects and an overview of the temperature and velocity distribution are seen inFigs. 3and4.
Fig. 3.Temperature distribution of the process for the different simulated cases with nozzle position at 0.5 m, 1.5 m and 3 m from center.
Fig. 4.Vertical velocity distribution in the process for the different nozzle positions, 0.5 m, 1.5 m and 3.0 m from the center.
Table 2 Results of the area averaged temperature for the different nozzle positions.
Outlet temperature
Nozzle position r=0.5 m r=1.5 m r=3.0 m Temperature [K] 525.6 527.4 547.2
Fig. 5. Height position of fully evaporated par-ticles. Each panel (diagram) represents different nozzle positions (from top to bottom): r= 0.5 m, r = 1.5 m andr = 3.0 m respectively. The y and x axes show the fraction of particles and time un-til fully evaporated and the grey scale indicates at which height the particles are evaporated.
lowered, and consequently the time until full evap-oration is extended; seeFigs. 5and6. The sinking cold air close to the wall (Fig. 4) will transport the droplets down in the process so that the height when the particles are fully evaporated will be lower than the other nozzle positions (Fig. 5). By having the nozzle close to the center (r= 0.5 m) it will take longer for the particles to be transported and accu-mulated close to the wall. Since particles will be spread over a larger domain, the evaporation pro-cess will be faster, but with the result that hot gas from the burners will rise close to the wall. With nozzles placed 1.5 m from center, the droplets will be spread in a large volume and about 50% of them will evaporate close to the wall (Fig. 6), damping the rising of hot air close to the wall, and evapora-tion of those particles will be faster than with the other two nozzle positions. The height of evapora-tion is almost the same for nozzle posievapora-tionr= 0.5 m andr= 1.5 m but a slightly greater number of par-ticles are transported further down in the process compared to the case with nozzle positionr= 0.5 m.
5.2 Velocity and Temperature Variation of the Continuous Phase
From the results of the vertical velocity and tem-perature distribution presented inFigs. 3and4, it can be seen that these qualities are nearly constant in the azimuth direction. In order to better quantify the observed variation in the radial direction, the re-spective quantity is plotted along lines 1 and 2; see Figs. 1, 7, 8. In the near-wall region, 2 m below the nozzle, the vertical velocity is close to zero for nozzle positionr= 0.5 m, while a negative veloc-ity is observed for the other two positions. At the
Fig. 6. Radial position of fully evaporated par-ticles. Each panel (diagram) represents different nozzle positions (from top to bottom): r= 0.5 m, r= 1.5 m and r= 3.0 m respectively. The y and x axes show the fraction of particles and time until fully evaporation, respectively, while the grey scale indicates at which radial position the particles are evaporated.
level 1 m above the burner, negative velocities are only observed for nozzle positionr= 3 m (Fig. 7). In the center region, the velocities are positive for nozzle positionr= 1.5 m andr= 3.0 m, while the velocity is negative for nozzle positionr= 0.5 m for both levels.
The impact of the nozzle position to the tempera-ture distribution in the center region of the process is relatively small for both levels. However a small drop in temperature at the center with nozzle posi-tionr= 0.5 m is derived (Fig. 8). Close to the walls, the differences are larger where nozzle positionr = 3 m shows a lower temperature. The results of the temperature and velocity distribution correlate well; a negative velocity inFig. 7indicates a low temperature, which is confirmed inFig. 8.
6. DISCUSSION
and thereby destroy the process. This effect can be minimized by reducing the quantity of particles that evaporate close to the wall.
Fig. 7. Vertical velocities along two lines, Line 1 and Line 2, perpendicular to the wall, 8.8 m and 11.0 m from bottom.
Fig. 8. Temperature along two lines, Line 1 and Line 2, perpendicular to the wall, 8.8 m and 11.0 m from bottom. Legends as in Fig. 7.
In order to produce good quality by-products it is assumed that all particles should go through the process with surroundings and exposure times that are as equal possible. This pre-condition means a narrow distribution in droplet evaporation position and time, and the droplets should evaporate before hitting the wall so that the risk of agglomeration at the wall is minimized. Running the process with nozzles at r= 0.5 m orr= 1.5 m indicates a pro-duction of a by-product of better quality. Compar-ing these two cases the results indicate that nozzle positionr= 1.5 m gives a more dispersed particle evaporation time and positions compared to nozzle
positionr= 0.5 m. Also, in order to avoid agglom-eration at the wall for nozzle position r = 0.5 m, only a small fraction of the droplets are transported all the way to the wall before evaporation. Further-more, in order to avoid particle agglomeration at the wall, a significant smaller fraction of the droplets are evaporated in the near wall region for nozzle positionr= 0.5 m compared tor= 1.5 m.
Another measure which could have direct impact on the regeneration process efficiency is to keep the walls from being heated to too high a temperature. The wall temperature could be controlled by letting the spray cool down the wall, which would reduce heat loss through the wall and hence increase the process efficiency. InTable 2 it is shown that the case with a nozzle position at r = 3 m gives the best efficiency which in turn leads to reduced fuel consumption.
7. CONCLUDINGREMARKS
In this work, the dynamics of a spray roasting pro-cess where Fe2Cl3is regenerated to HCl has been modeled with a second order numerical scheme and a two-way coupled Eulerian- Lagrangian approach. The energy balances in the process are described with evaporation of droplets and heat loss through walls. Chemical reactions that appear in the pro-cess are not described. Results indicate that if a good quality by-product is of primary interest or to reduce particle agglomeration at wall, a nozzle po-sition at a radial distance of 0.5 m from the reactor center line would be preferable. It is also shown that in order to increase the efficiency of the pro-cess, a prioritized nozzle position should be closer to the wall since this will lower the near-wall tem-perature and thus reduce heat loss.
The approach for future work is well outlined by the inclusion of the process chemistry and particle formation. Furthermore, future work is also to con-sider experimentally visualizing and measuring the in-flow. There are however several challenges con-nected to such an operation due to the very hostile environment inside the reactor.
ACKNOWLEDGMENTS
The authors gratefully acknowledge the assistance of Bengt Johansson with colleagues at SSAB EMEA AB in Borl¨ange, Sweden, for fruitful dis-cussions regarding the combustion furnace and the entire process of waste HCl regeneration.
REFERENCES
1608.
Avinash, K., J. A. Rao, Y. V. R. Kumar, and S. Sreenadh (2013). Bingham fluid flow through a tapered tube with permeable wall. Journal of Applied Fluid Mechanics 6(1), 131–141.
Beck, M., S. Wirtz, and V. Scherer (2007). Ex-perimental and numerical studies of Fe2O3 particle formation processes in a flat flame burner.Chemical Engineering and Technol-ogy 30(6), 790–796.
Beck, M., S. Wirtz, V. Scherer, and F. B¨arhold (2007). Numerical calculations of spray roasting reactor of the steel industry with special emphasis on Fe2O3- particle forma-tion.Research Article A 30(10), 1347–1354. Choudhury, M. and G. Hazarika (2013). The ef-fects of variable viscosity and thermal con-ductivity on mhd oscillatory free convective flow past a vertical plate in slip flow regime with variable suction and periodic plate tem-perature.Journal of Applied Fluid Mechan-ics 4(2, Special Issue), 1–8.
Ferziger, J. H. and M. Peric (2002). Computa-tional Methods for Fluid Dynamics. Springer Verlag.
Gibson, C. and R. Schild (2009). Hydro- gravita-tional dynamics of planets and dark energy. Journal of Applied Fluid Mechanics 2(2), 35–41.
Huang, L., K. Kumar, and A. Mujumdar (2004). Simulations of a spray dryer fitted with a ro-tary disk atomizer using a three-dimensional computational fluid dynamic model.Drying Technology 22(6), 1489–1515.
Johansson, S. (2010). Cfd simulation of hy-drochloric acid regeneration with a ruthner process. Master’s thesis, Lule˚a University of Technology, Sweden.
Johansson, S., V. Geza, L. Westerberg, and A. Jakovics (2010, September). Characteris-tics of flow and temperature distribution in a ruthner process. InProceedings of the In-ternational Scientific Colloquium Modelling for Material Processing, pp. 317–322. Kladnig, W. (2008). New development of acid
regeneration in steel pickling plants. Jour-nal of Iron and Steel Research Interna-tional 15(4), 1–6.
Launder, B. and D. Spalding (1974). The numer-ical computation of turbulent flows. Com-puter Methods in Applied Mechanics and Engineering 3, 269–289.
Lundstr¨om, T., J. Hellstr¨om, and E. Lindmark (2010). Flow design of guiding device for downstream fish migration. River Research and Applications 26(2), 166–182.
Marjavaara, B., T. Lundstr¨om, T. Goel, Y. Mack, and W. Shyy (2007). Hydraulic diffuser shape optimisation by multiple surrogate model approximations of pareto fronts. Jour-nal of Fluids Engineering 129(9), 1228– 1240.
Regel-Rosocka, M. (2010). A review on meth-ods of regeneration of spent pickling solu-tions from steel processing.Journal of Haz-ardous Materials 177, 57–69.
Shiemann, M., S. Wirtz, V. Scherer, and F. B¨arhold (2012). Spray roasting of iron chloride fecl2: laboratory scale experiments and a model for numerical simulation. Pow-der Technology 228, 301–308.
Shih, T., W. Liou, A. Shabbir, Z. Yang, and J. Zhu (1995). A newk−ε eddy viscosity model for high reynolds number turbulent flows.Computers & Fluids 24, 227–238.
Sommerfeld, M., B. van Wachem, and R. Olie-mans (2008). ERCOFTAC Best Practice Guidelines for Computational Fluid Dynam-ics of Dispersed Multi- phase Flows. ER-COFTAC.
Stouffs, P. (2011). Hot air engines. Journal of Applied Fluid Mechanics Vol4(2, Special Is-sue), 1–8.
Tosun, I. (2002). Modelling in transport Phe-nomena. Elsevier Science B.V.
Westerberg, L., V. Geza, A. Jakovics, and T. Lundstr¨om (2011). Burner backflow re-duction in regeneration furnace.Engineering Applications of Computational Fluid Me-chanics 5(3), 372–383.