The complete mitochondrial genome of the small yellow croaker
and partitioned Bayesian analysis of Sciaenidae fish phylogeny
Yuanzhi Cheng, Rixin Wang, Yuena Sun and Tianjun Xu
Laboratory for Marine Living Resources and Molecular Engineering, College of Marine Science,
Zhejiang Ocean University, Zhoushan, Zhejiang, P.R. China.
Abstract
To understand the phylogenetic position ofLarimichthys polyactis within the family Sciaenidae and the phylogeny of this family, the organization of the mitochondrial genome of small yellow croaker was determined herein. The com-plete, 16,470 bp long, mitochondrial genome contains 37 mitochondrial genes (13 protein-coding, 2 ribosomal RNA and 22 transfer RNA genes), as well as a control region (CR), as in other bony fishes. Comparative analysis of initia-tion/termination codon usage in mitochondrial protein-coding genes of Percoidei species, indicated that COI in Sciaenidae entails an ATG/AGA codon usage different from other Percoidei fishes, where absence of a typical con-served domain or motif in the control regions is common. Partitioned Bayesian analysis of 618 bp of COI sequences data were used to infer the phylogenetic relationships within the family Sciaenidae. An improvement in harmonic mean -lnL was observed when specific models and parameter estimates were assumed for partitions of the total data. The phylogenetic analyses did not support the monophyly ofOtolithes, Argyrosomus, and Argyrosominae. L. polyactis was found to be most closely related to Collichthys niveatus, whereby, according to molecular systematics studies, the relationships within the subfamily Pseudosciaenidae should be reconsidered.
Key words: Larimichthys polyactis, mitochondrial genome, control region, partitioned Bayesian analysis, Sciaenidae.
Received: June 14, 2011; Accepted: October 24, 2011.
Introduction
Animal mitochondrial DNA, a 16-19 kb long circular molecule, comprises 37 genes encoding 22 transfer RNAs (tRNAs), 13 proteins, 2 ribosomal RNAs, and a putative control region (CR) (Brown, 1985; Boore, 1999). Due to its compactness, maternal inheritance, fast evolutionary rate compared to nuclear DNA, and the resulting short coales-cence time, mitochondrial DNA sequence data have been widely used in phylogeny (Miyaet al., 2003), taxonomic resolution (Poulin et al., 2004), and population genetic studies (Habibet al., 2010).
The small yellow croaker,Larimichthys polyactis, a very popular fish among consumers, is one of the most im-portant commercial benthopelagic fishes in China and Ko-rea. The species is extensively distributed in the Bohai, Yellow and East China Seas, global landing having reached 320 thousand metric tons in 2000 (Seikai National Fish-eries Research Institute, 2001). Nevertheless, intense fish-ing has deflated catches in the Yellow and East China Seas, to such an extent that resources are now considered over-exploited (Linet al., 2008). In the past, the focus has been on catch statistics, size composition, early life history and
feeding habits (Xueet al., 2004; Yanet al., 2006; Wan and Sun, 2006). However, over recent years, the genetic charac-teristics of the small yellow croaker have also come under investigation by means of molecular markers (Menget al., 2003; Linet al., 2009; Xiaoet al., 2009), although, infor-mation is still limited, and the complete mitochondrial ge-nome sequence, critical in studies of gege-nome evolution and species phylogeny, continues unavailable. Thus, much ad-ditional work is required to furnish important genetic and evolutionary data, essential for species conservation, man-agement and phylogenetic analysis.
Sciaenidae is a diverse and commercially important family, comprising 68 genera and about 311 species (Nel-son, 2006). Despite specific studies of morphological and molecular phylogeny, instabilities of the phylogenetic rela-tionships within the group have not, as yet, been resolved, the methods employed in previous research on phylogen-etic reconstruction based on molecular data having been, to some extent, empirical and simple. The non-implemen-tation of advanced methods, such as ML or BI, best-fit evo-lutionary models for specific data, and the statistical testing of the different topologies derived from the same data ma-trix, has probably contributed to mismodeling and system-atic error in analysis. Mismodeling itself commonly occurs when a single model, inappropriate for multiple-gene re-gions involving several models of evolution, as stem and
www.sbg.org.br
Send correspondence to Tianjun Xu. College of Marine Science, Zhejiang Ocean University, Wenhua Road 105, 316000 Zhoushan, Zhejiang, P.R China. E-mail:[email protected].
loop in RNA, or codon positions in protein genes, is em-ployed for those multiple data partitions best explained by separate models of DNA evolution. Another form of mis-modeling is the case,when multiple data partitions, defined by the same general model, differ drastically in the specific model parameter estimates that maximize the likelihood score (Reeder, 2003; Brandleyet al., 2005). An overall so-lution would be to apply appreciate models and their speci-fied parameter estimates to each data partition, and subse-quently incorporate this into a single ML tree-search (Yang, 1996). Methods for reconstructing phylogeny, based on partitioned data using Bayesian/Markov chain Monte Carlo (MCMC) methods, are now available (Huel-senbeck and Ronquist, 2001; Nylanderet al., 2004). Since it more accurately models the data, the use of partition-specific modeling - in other words, partitioned Bayesian analysis - should reduce systematic error, thereby resulting in better likelihood scores and more accurate posterior probability estimates (Brandleyet al., 2005).
In the present study, pre-defined complete mitochon-drial genome sequences of the small yellow croaker were compared with those reported for Percoidei species, where-upon partitioned Bayesian analysis was applied to infer the phylogeny of Sciaenidae fishes.
Materials and Methods
Fish sample and DNA extraction
L. polyactisindividuals were collected by trawling in the Zhoushan fishing grounds, East China Sea (Zhejiang Province, China). They were identified by morphology. Muscle tissue was removed and immediately preserved at -80 °C. Total DNA was extracted as per standard phe-nol-chloroform method (Sambrook and Russell, 2001) and visualized on 1.0% agrarose gels.
PCR amplification and sequencing
As shown in Table S1, 11 sets of primers that amplify contiguous, overlapping segments of the complete mito-chondrial genome ofL. polyactis, were used. The primers were designed from reported complete mitochondrial ge-nome sequences for the large yellow croaker (Cuiet al., 2009). Worthy of note, these primers are also very useful for amplifying the mitochondrial genomes of two other Sciaenidae species, Miichthys miiuy and Collichthys lucidus. Of the 11 pairs of primers, six (1F/R, 4F/R, 6F/R, 7F/R, 8F/R, and 10F/R) are capable of perfectly amplifying the mitochondrial genomes of both species. The total length of amplified products is approximately 12,300 bp. PCR as-says were carried out in a final volume of 50mL, each con-taining 5.0mL of a 10xTaqPlus polymerase buffer, 0.2 mM of dNTP, 0.2 mM of the forward and reverse primers, 2 units ofTaq Plus DNA polymerase with proof-reading characteristic (TIANGEN, Beijing, China), and 1 mL of DNA template. Cycling conditions were 94 °C for 4 min,
followed by 35 cycles of 94 °C for 50 s, 60 °C for 60 s and 72 °C for 2-3 min, followed by 1 cycle of 72 °C for 10 min, PCR was performed on a PTC-200 thermocycler (MJ Re-search, USA). The resultant PCR products, first electro-phoresed on a 1% agarose gel to check integrity, were then visualized by the Molecular Imager Gel Doc XR system (BioRad), followed by purification using a QIAEX II Gel Extraction Kit (Qiagen). The purified fragments were li-gated into PMD18-T vectors (Takara, Japan) used to trans-form to TOP10E. colicells, according to standard protocol. Positive clones were screened via PCR with M13+/- prim-ers. Amplicons were sequenced using an ABI 3730 auto-mated sequencer (Applied Biosystems) with M13+/-primers.
Sequence analysis
The sequence fragments so obtained were edited in the Seqmen program (DNAstar, Madison, WI, USA) for contig assembly to obtain a complete mitochondrial ge-nome sequence. Annotation of protein-coding and ribo-somal RNA genes, and definition of their respective gene boundaries were carried out with DOGMA software (Wy-manet al., 2004) through reference sequences of Percoidei, available in GenBank. tRNA genes and their secondary structures, were identified by means of tRNAscan-SE 1.21 software (Lowe and Eddy, 1997). Base composition, ge-netic distances, and codon usage were calculated in MEGA 4.0 software (Tamuraet al., 2007). Putative OLand CR, and
conserved motifs were identified via sequence homology and proposed secondary structure. The complete mitochon-drial genome sequence, deposited in the GenBank data-base, can be accessed through Accession Number GU586227.
Phylogenetic analysis
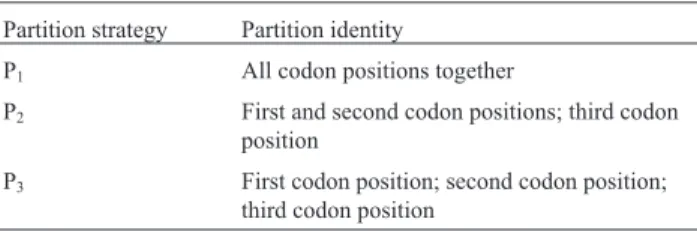
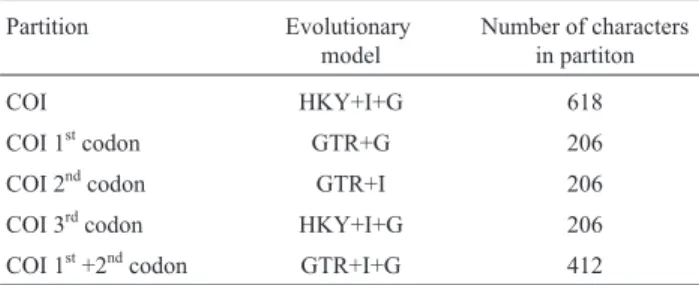
Multiple alignments of the COI sequences from 30 Sciaenidae species were performed using the MEGA 4.1 version. The data matrix of COI sequences was partitioned by codon position (Table 1). The appropriate model of se-quence evolution for each partition (Table 2) was deter-mined using the jModeltest program (Guindon and Gas-cuel, 2003; Posada, 2008), under the Akaike Information Criterion (AIC). Bayesian analysis for each data partition-ing strategy consisted of two separate runs with four Markov chains in the MrBayes3.1 program (Huelsenbeck and Ronquist, 2001). Each run, comprising 10 million
gen-Table 1- Partition strategies used in this study.
Partition strategy Partition identity
P1 All codon positions together
P2 First and second codon positions; third codon
position
P3 First codon position; second codon position;
erations, was systematically sampled at every 100. The first 25% of the trees were discarded as part of a burn-in proce-dure, and the remainder employed in constructing a 50% majority rule consensus tree. The results for each partition-ing strategy were then compared uspartition-ing the Bayes factor as an aid in accepting the best phylogeny hypothesis for the sequence data matrix.
Results and Discussion
Gene content, arrangement and base composition
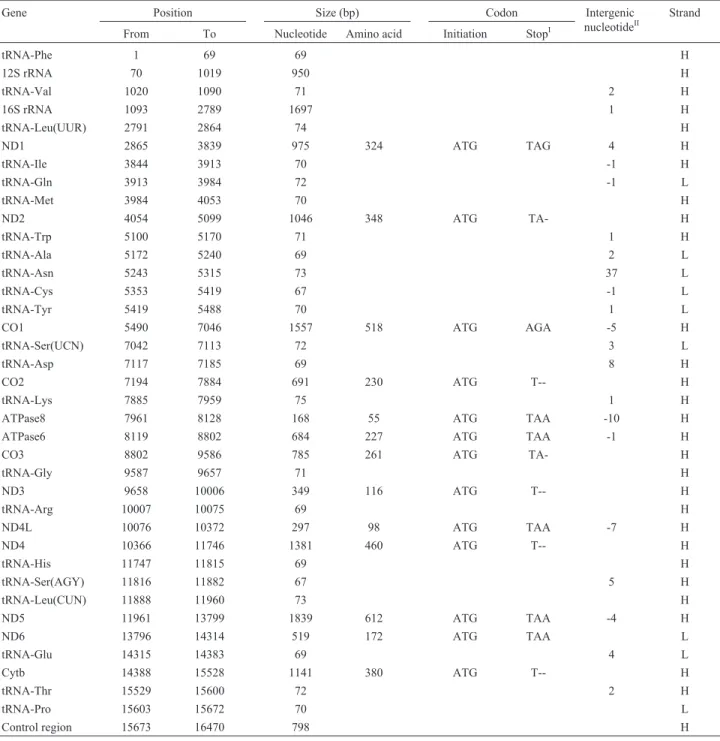
The complete mitochondrial genome of L. polyactiswas 16, 470 bp long (Table 3), which is similar to those of not only teleost species but also terrestrial verte-brates. Its gene content conforms to the vertebrate consen-sus, by containing the highly conserved set of 37 genes encoding 2 ribosomal RNAs (rRNAs), 22 transfer RNAs (tRNAs) and 13 proteins, that are essential in mitochon-drion respiration and adenosine triphosphate (ATP) pro-duction. Although, as in other vertebrates, most of the genes are encoded on the H-strand, besides ND6 and eight tRNAs (Glu, Ala, Asn, Cys, Tyr, Ser-UCN, Gln, and Pro) being also encoded on the L-strand, the genes are all similar in length to those of bony fishes (Ohet al., 2007, 2008). As reported in other vertebrates, there are four notable ‘over-laps’ between genes, as reported in other vertebrates, with the lengths of these overlaps are generally being fixed. Whereas ATPase 8 and ATPase 6 overlap by 10 bp, over-lapping was also observed between ND4L and ND4 (seven bp), ND5 and ND6 (four bp), and ATPase 6 and COIII (one bp). The remainders are located between tRNA genes themselves, and between tRNA and protein-coding genes. The sizes of non-coding spacers range from 1 to 37 bp (Ta-ble 3). The largest of these, located between tRNA-Asn and tRNA-Cys, was recognized as the putative replicate origin of the L-strand|s. These non-coding spacers are interesting in the study of mtDNA evolutionary mechanisms. The base composition of L. polyactis was analyzed separately for rRNA, tRNA, and protein-coding genes (Table S2). In the latter, pronounced anti-G bias was observed at the third codon positions (8.5%), which are free from selective con-straints on nucleotide substitution. Besides the A+T com-position of the second codon com-position being relatively
higher than in most Percoidei fishes, pyrimidines were over-represented in this position (61.5%). Already ob-served in other vertebrate mitochondrial genomes, this has been attributed to the hydrophobic character of the proteins (Nayloret al., 1995).L. polyactistRNA genes are A+T rich (54.5%), as in other vertebrates, whereas rRNAs are A+C rich (59.3%), as in other bony fishes (Zardoya and Meyer, 1997; Chenget al., 2010).
Protein-coding genes
As expected, 13 large open-reading frames were de-tected in the mitochondrial genome ofL. polyactis. The T:C:A:G base composition of the mitochondrial 13 pro-tein-coding-gene sequence, 26.9: 32.4: 24.8: 15.9, is sum-marized in Table S2. Bias of nucleotide frequencies is strand specific (Broughton and Reneau, 2006). Moreover, in contrast to H-stranded genes, in L-stranded ND6 genes, the most prominent anti-C bias is at the third position (7.5%). The lengths of 13 protein-coding genes of L. polyactismitochondrial DNA were compared with the cor-responding sequences of other Percoidei species, whereat it was found that these are conserved. Moreover, there is al-most no variation among species. By comparing predicted initiation and termination codons of the 13 protein-coding genes among 23 percoidei species (Table S3), it was appar-ent that most use ATG as the initiation codon (92.6%), with GTG in second place. In a few species, initiation codons are even absent (shown by “?”). The situation in termination codons is also similar. TAA, TAG and incomplete TA- or T-- are commonly used, but AGA and AGG rarely so. This condition is apparently common among vertebrate mito-chondrial genome, and it also appears that TAA stop co-dons are created via posttranscriptional polyadenylation (Ojalaet al., 1981). Furthermore, each protein has its pref-erable initiation and termination codons, although there are exceptions. For example, in most species, COII, COIII, Cytb, ND4L and ND4 choose ATG/T--, ATG/TA-, ATG/T--, ATG/TAA and ATG/T--, respectively. But in COI there are two types of initiation/termination codon us-age. COI proteins in Sciaenidae fish mitochondrial DNA bear ATG/AGA as initiation and termination codons, whereas in other Percoidei fishes, this is not the case (they possess GTG/TAA, GTG/AGG or GTG/T--). Studies in in-sects have shown positive correlations between the inci-dence of canonical initiation and termination codons and the relative rate of gene evolution (Szafranski, 2009). Whether this relationship also applies to fishes requires confirmation.
Codons in the 13 protein-coding genes identified inL. polyactisare shown in Table S4. As regards amino acids with the fourfold degenerate third position, codons ending in C are mostly seen, followed by codons ending in A and T for alanie, proline, glycine, valine and threonine. However, for arginine and serine, A is more frequent than C. Among codons with twofold degenerate positions, C appears to be
Table 2- Data partitions, their estimated models of sequence evolution, and total number of characters of each partition used in phylogenetic anal-ysis.
Partition Evolutionary
model
Number of characters in partiton
COI HKY+I+G 618
COI 1stcodon GTR+G 206
COI 2ndcodon GTR+I 206
COI 3rdcodon HKY+I+G 206
more used than T in the pyrimidine codon family, whereas the purine codon family ends mostly with A. Except for arginine, G is the least common third position nucleotide in all the codon families. All these features are very similar to those observed in vertebrates (Huet al., 2010; Yanget al., 2010).
Ribosomal RNA gene and transfer RNA gene
As with other mitochondrial genomes, the genome contains a small (12S) and large (16S) subunits of rRNA,
which are 950 bp and 1697 bp long, respectively (Table S2). As in the other vertebrates, they are located be-tween tRNA-Phe and tRNA-Leu(UUR), and are separated by tRNA-Val (Figure S1, Table 3). When compared with other genes reported for Sciaenidae, and similar to other vertebrates, both rRNA genes are conserved either in A+T content or gene length and location. As withGonostoma gracile(Miya and Nishida, 1999), preliminary assessment of the secondary structure ofL. polyactisindicated that the present sequence could be reasonably superimposed on the
Table 3- Characteristics of the mitochondrial genome ofL. polyactis.
Gene Position Size (bp) Codon Intergenic
nucleotideII
Strand
From To Nucleotide Amino acid Initiation StopI
tRNA-Phe 1 69 69 H
12S rRNA 70 1019 950 H
tRNA-Val 1020 1090 71 2 H
16S rRNA 1093 2789 1697 1 H
tRNA-Leu(UUR) 2791 2864 74 H
ND1 2865 3839 975 324 ATG TAG 4 H
tRNA-Ile 3844 3913 70 -1 H
tRNA-Gln 3913 3984 72 -1 L
tRNA-Met 3984 4053 70 H
ND2 4054 5099 1046 348 ATG TA- H
tRNA-Trp 5100 5170 71 1 H
tRNA-Ala 5172 5240 69 2 L
tRNA-Asn 5243 5315 73 37 L
tRNA-Cys 5353 5419 67 -1 L
tRNA-Tyr 5419 5488 70 1 L
CO1 5490 7046 1557 518 ATG AGA -5 H
tRNA-Ser(UCN) 7042 7113 72 3 L
tRNA-Asp 7117 7185 69 8 H
CO2 7194 7884 691 230 ATG T-- H
tRNA-Lys 7885 7959 75 1 H
ATPase8 7961 8128 168 55 ATG TAA -10 H
ATPase6 8119 8802 684 227 ATG TAA -1 H
CO3 8802 9586 785 261 ATG TA- H
tRNA-Gly 9587 9657 71 H
ND3 9658 10006 349 116 ATG T-- H
tRNA-Arg 10007 10075 69 H
ND4L 10076 10372 297 98 ATG TAA -7 H
ND4 10366 11746 1381 460 ATG T-- H
tRNA-His 11747 11815 69 H
tRNA-Ser(AGY) 11816 11882 67 5 H
tRNA-Leu(CUN) 11888 11960 73 H
ND5 11961 13799 1839 612 ATG TAA -4 H
ND6 13796 14314 519 172 ATG TAA L
tRNA-Glu 14315 14383 69 4 L
Cytb 14388 15528 1141 380 ATG T-- H
tRNA-Thr 15529 15600 72 2 H
tRNA-Pro 15603 15672 70 L
Control region 15673 16470 798 H
I: TA- and T-- represent incomplete stop codons.
proposed secondary structures of carp 12S and cow 16S rRNA (Gutellet al., 1993). Twenty-two tRNA genes, with lengths varying from 67 bp (Cys and tRNA-Ser(AGY) to 75 bp(tRNA-Lys), were interspersed through-out the entire genome. As reported in some other verte-brates (Miyaet al., 2003; Kim and Lee, 2004; Ohet al., 2007), with the known exception of the tRNA-Ser (AGY) gene, all tRNA gene transcripts can be folded into typical cloverleaf secondary structures (Figure S2). Besides har-boring anticodons identical to those used in other vertebrate mitogenomes, they conserve the aminoacyl, DHU (dihy-drouridine), anticodon and TYC (thymidine-pseudouri-dine-cytidine) stems. As shown in the rock bream (Ohet al., 2007) andPseudolabrus fishes (Ohet al., 2008), the tRNA-Ser (AGY) found in theL. polyactismitochondrial genome bore no complete DHU arm. Similar to usual tRNAs (Ohtsukiet al., 2002), aberrant tRNAs can also fit into the ribosome by adjusting their structural conforma-tion and funcconforma-tion.
Main non-coding regions of Percoidei species
The putative OLwas confirmed inL. polyactis. When
compared with other Percoidei fishes, they were almost identical and are located in a cluster of five tRNA genes (the WANCY region) between the Asn and tRNA-Cys gene. The putative OL,besides serving as the initiation
site of Light-strand replication, is capable of folding into a stable stem-loop secondary structure with 13 bp in the stem and 11 bp in the loop. Furthermore, there is a C-rich se-quence in the loop, whereby RNA primer synthesis can be initiated. This C-rich sequence has also been found in the OLloop of other fishes, such asGadus morhua(Johansenet
al., 1990) andOncorynchus mykiss(Zardoyaet al., 1995). This feature supports the hypothesis that in vertebrates, primer synthesis is most probably initiated by a polypyri-midine tract (Taanman, 1999), and not by a stretch of thymines, as previously suggested (Wang and Clayton, 1985). The conserved sequence motif, 5’-GCCGG-3’, was found at the base of the stem within tRNA-Cys. This motif seems to be involved in the transition from RNA to DNA synthesis (Hixson and Brown, 1986).
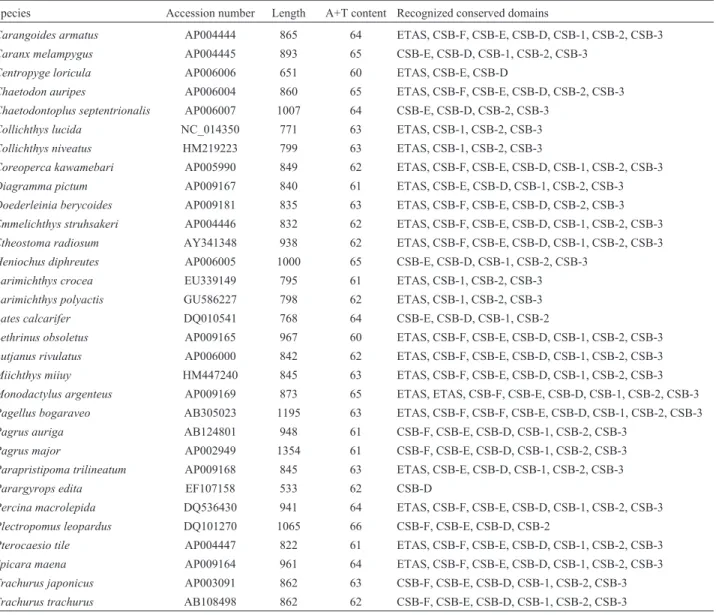
The mitochondrial control region is located between tRNA-Pro and tRNA-Phe in mitochondrial DNA. Besides being the most variable region, it also contains certain con-served motifs that are associated with the initiation of DNA replication and transcription (Zhaoet al., 2006). The con-trol region ofL. polyactiswas identified and compared with those of other Percoidei fishes. They are also located be-tween the two tRNAs (Pro and Phe), and range in size from 533 bp (Parargyrops edita, EF107158) to 1354 bp (Pagrus major, AP002949), all having an overall base composition rich in A and T (A+T= 60%). The variation in length is largely due to the number of conserved domains inserted in these species. Long tandem repeats were recognized in Monodactylus argenteus and Pagellus bogaraveo, with
lengths of 56 bp and 183 bp, respectively. Slippage and mispairing during mitogenome replication may explain tandem repeats in the control region (Brought and Dowling, 1997). Although this region is a unique and highly variable area in mitochondrial DNA, conserved domains and motifs are recognizable by multiple homologous sequence align-ment and recognition site comparison. Control regions are also divided into a typical tripartite structure with an extent termination association sequence (ETAS), central con-served-block domains (CSB-F, CSB-D, and CSB-E), and conserved sequence block domains (CSB-1, CSB-2, and CSB-3) (Sbisaet al., 1997). The conserved ETAS motif in most fishes is TACAT, with one palindromic sequence, ATGTA. InCoreoperca kawamebari, there is some varia-tion in ETAS having the conserved TGCAT motif. The consensus sequences of ETAS in Percoidei fishes was iden-tified as TACAT-TATGTAT---CACCAT----ATATTAAC CAT, where “-” indicating nucleotide variations such as transitions, transversions, or deletions, similar to reported in sinipercine fishes (Zhaoet al., 2006). CSB domains that are associated with the initiation of mitochondrial DNA replication, and other important functions of control re-gions, were detected. Consensus sequences have been sum-marized in Table S5. While all these conserved blocks can be easily identified in most of the Percodei species, the in-complete structure of control regions with the absence of conserved domains, was also detected (Table 4). Such ob-vious insertions and deletions implied the rapid evolution of the control region in Percoidei fishes, a possible source of information for dissecting the structure-function-evolu-tion relastructure-function-evolu-tionships of control regions.
Effect of partitioning on harmonic mean -lnL, topology, posterior probabilities and bayes factors
higher than the criterion for strong evidence against a hy-pothesis. According to the Bayes factors, analysis employ-ing the P3partition-strategy provided a decisively better
ex-planation of the data than the remainder (Table 5 and Table 6). Thus, as this is the preferred hypothesis of the
phylogeny of Sciaenidae fishes based on the present data, subsequent discussion will be limited to this tree (Figure 3).
The phylogeny of the Sciaenidae family
Based on the characters of the gas bladder, sagitta, and mental pores, Zhuet al.(1963) divided the family into seven subfamilies, viz., Johniinae, Megalonibinae, Bahabi-nae, SciaeniBahabi-nae, OtolithiBahabi-nae, Argyrosominae and
Pseudos-Table 4- Characteristics and recognized conserved domains of control regions in Percoidei species.
Species Accession number Length A+T content Recognized conserved domains
Carangoides armatus AP004444 865 64 ETAS, CSB-F, CSB-E, CSB-D, CSB-1, CSB-2, CSB-3
Caranx melampygus AP004445 893 65 CSB-E, CSB-D, CSB-1, CSB-2, CSB-3
Centropyge loricula AP006006 651 60 ETAS, CSB-E, CSB-D
Chaetodon auripes AP006004 860 65 ETAS, CSB-F, CSB-E, CSB-D, CSB-2, CSB-3
Chaetodontoplus septentrionalis AP006007 1007 64 CSB-E, CSB-D, CSB-2, CSB-3
Collichthys lucida NC_014350 771 63 ETAS, CSB-1, CSB-2, CSB-3
Collichthys niveatus HM219223 799 63 ETAS, CSB-1, CSB-2, CSB-3
Coreoperca kawamebari AP005990 849 62 ETAS, CSB-F, CSB-E, CSB-D, CSB-1, CSB-2, CSB-3
Diagramma pictum AP009167 840 61 ETAS, CSB-E, CSB-D, CSB-1, CSB-2, CSB-3
Doederleinia berycoides AP009181 835 63 ETAS, CSB-F, CSB-E, CSB-D, CSB-2, CSB-3
Emmelichthys struhsakeri AP004446 832 62 ETAS, CSB-F, CSB-E, CSB-D, CSB-1, CSB-2, CSB-3
Etheostoma radiosum AY341348 938 62 ETAS, CSB-F, CSB-E, CSB-D, CSB-1, CSB-2, CSB-3
Heniochus diphreutes AP006005 1000 65 CSB-E, CSB-D, CSB-1, CSB-2, CSB-3
Larimichthys crocea EU339149 795 61 ETAS, CSB-1, CSB-2, CSB-3
Larimichthys polyactis GU586227 798 62 ETAS, CSB-1, CSB-2, CSB-3
Lates calcarifer DQ010541 768 64 CSB-E, CSB-D, CSB-1, CSB-2
Lethrinus obsoletus AP009165 967 60 ETAS, CSB-F, CSB-E, CSB-D, CSB-1, CSB-2, CSB-3
Lutjanus rivulatus AP006000 842 62 ETAS, CSB-F, CSB-E, CSB-D, CSB-1, CSB-2, CSB-3
Miichthys miiuy HM447240 845 63 ETAS, CSB-F, CSB-E, CSB-D, CSB-1, CSB-2, CSB-3
Monodactylus argenteus AP009169 873 65 ETAS, ETAS, CSB-F, CSB-E, CSB-D, CSB-1, CSB-2, CSB-3
Pagellus bogaraveo AB305023 1195 63 ETAS, CSB-F, CSB-F, CSB-E, CSB-D, CSB-1, CSB-2, CSB-3
Pagrus auriga AB124801 948 61 CSB-F, CSB-E, CSB-D, CSB-1, CSB-2, CSB-3
Pagrus major AP002949 1354 61 CSB-F, CSB-E, CSB-D, CSB-1, CSB-2, CSB-3
Parapristipoma trilineatum AP009168 845 63 ETAS, CSB-E, CSB-D, CSB-1, CSB-2, CSB-3
Parargyrops edita EF107158 533 62 CSB-D
Percina macrolepida DQ536430 941 64 ETAS, CSB-F, CSB-E, CSB-D, CSB-1, CSB-2, CSB-3
Plectropomus leopardus DQ101270 1065 66 CSB-F, CSB-E, CSB-D, CSB-2
Pterocaesio tile AP004447 822 61 ETAS, CSB-F, CSB-E, CSB-D, CSB-1, CSB-2, CSB-3
Spicara maena AP009164 961 64 ETAS, CSB-F, CSB-E, CSB-D, CSB-1, CSB-2, CSB-3
Trachurus japonicus AP003091 862 63 CSB-F, CSB-E, CSB-D, CSB-1, CSB-2, CSB-3
Trachurus trachurus AB108498 862 62 CSB-F, CSB-E, CSB-D, CSB-1, CSB-2, CSB-3
Table 5- Harmonic mean -lnLof each partition strategy (top matrix), and 2ln Bayes factor results from comparisons between all the partitioning strategies (the left bottom matrix). The Bayes factor was calculated from estimated harmonic means of likelihood by the sump command in MrBayes3.1
Partition strategy
P1 P2 P3
Harmonic mean -lnL 5427.68 5124.09 5058.92
P1
-P2 607.18
-P3 737.52 130.34
-Table 6- Interpretation of the 2ln Bayes factor. Modified from Kass and Raftery (1995).
2ln Bayes factor Evidence for H1
< 0 Negative (supports H0)
0 to 2 Barely worth mentioning
2 to 6 Positive
6 to 10 Strong
ciaeniae. In this study, phylogenetic analysis revealed three distinct monophyletic groups (Groups1, 2 and 3), thus very different from the results of Zhuet al.(1963). Monophyly of the generaOtolithesandArgyrosomusis not supported. The proposition (Zhu et al., 1963) of grouping ArgyrosomusandNibeainto the subfamily Argyrosominae is also without support, for, based on the phylogenetic tree presented herein,ArgyrosomusandNibeahave been placed into two distinct groups (Figure 3). Even though mono-phyly of Pseudosciaeniae is supported, herein, Bayesian posterior probability is relatively weak. Notably, within the subfamily Pseudosciaeninae,L. polyactiswas found to be most closely related toCollichthys niveatus, and then to its congeneric species,L. crocea. Although previous molecu-lar phylogenetic analyses had the same opinion on the phylogenetic positions of Otolithes, Argyrosomus, and Argyrosominae, the phylogentic relationships within the subfamily Pseudosciaeninae are still far from clear (Meng et al., 2004; Xuet al., 2010). Based on different data and methods, once again our results suggested thatCollichthys
andLarimichthysmay be merged into a single genus. These results are consistent with Chen (Chen QM, 2007,
Disserta-Figure 2- Consensus trees of Sciaenidae constructed using Bayesian anal-ysis based on P2partition-strategies. The accession numbers of species are
those listed in Figure 1.
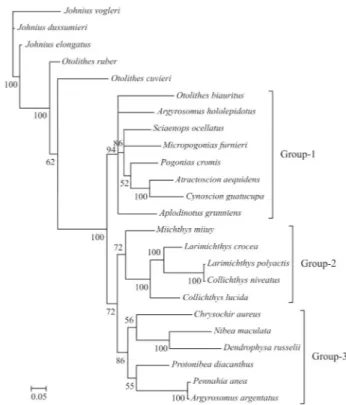
Figure 1- Consensus trees of Sciaenidae constructed using Bayesian anal-ysis based on P1partition-strategies. The accession numbers of species
used in this study are flowing: Aplodinotus grunniens, EU523922;
Atractoscion aequidens, DQ107824; Argyrosomus argentatus, HQ890946;Argyrosomus hololepidotus, DQ107810;Chrysochir aureus, EF607347; Collichthys lucidus, HM447239; Collichthys niveatus, NC_014263;Cynoscion guatucupa,EU074398;Dendrophysa russelii, EF607358; Johnius dussumieri, EF534120; Johnius elongates, EF534124;Johnius vogleri, EF534112;Larimichthys crocea, EU871688;
Larimichthys polyactis, EU266386;Micropogonias furnieri, EU074482;
Nibea maculate, EU014249; Miichthys miiuy, EU266377; Otolithes cuvieri, EF534116;Ostolithes rubber, EF607450;Otolithoides biauritus, EF536890; Pogonias cromis, EU074550; Protonibea diacanthus, EF528232;Pennahia anea, EF607487;Sciaenops ocellatus, EU180148.
Figure 3- Consensus trees of Sciaenidae constructed using Bayesian anal-ysis based on P3partition-strategies. The accession numbers of species are
tion, Jinan University, China) and Tong et al. (2007), where, respectively, non-monophyletic Larimichthys and Collichthys were recovered. Nevertheless, Cheng et al. (2011) recently recovered monophyletic Collichthys and Larimichthys, thus, in common with the morphological re-sults of Zhuet al.(1963). Sampling errors, scarce data and mismodeling may have contributed to these disputes. Thus, the inclusion of further data from the mitochondrial and nu-clear genomes, more accurate evolutionary models, and ex-tensive taxonomic sampling, with careful identification integrated with information on morphological characters, is required for reconstructing the phylogeny of Sciaenidae.
Acknowledgments
This study was supported by the Nation Nature Sci-ence Foundation of China (31001120), Zhejiang Provincial Natural Science Foundation of China (Y3100013) and Im-portant Science and Technology Specific Projects of Zhejiang Province (2011C14012).
References
Boore JL (1999) Animal mitochondrial genomes. Nucleic Acids Res 27:1767-1780.
Brandley MC, Schmitz A and Reeder TW (2005) Partitioned Bayesian analyses, partition choice, and the phylogenetic re-lationships of scincid lizards. Syst Biol 54:373-390. Brought RE and Dowling TE (1997) Evolutionary dynamics of
tandem repeats in the mitochondrial DNA control region of minnow Cyprinella spiloptera. Mol Biol Evol 14:1187-1196.
Broughton RE and Reneau PC (2006) Spatial covariation of muta-tion and nonsynonymous substitumuta-tion rates in vertebrate mi-tochondrial genomes. Mol Biol Evol 23:1516-1524. Brown WM (1985) The mitochondrial genome of animals. In:
McIntyre RJ (ed) Molecular Evolutionary Genetics. Plenum Press, New York, pp 95-130.
Brown JM and Lemmon AR (2007) The importance of data parti-tioning and the utility of Bayes factors in Bayesian phylo-genetics. Syst Biol 56:643-655.
Cheng YZ, Xu TJ, Shi G and Wang RX (2010) Complete mito-chondrial genome of the miiuy croaker Miichthys miiuy (Perciformes, Sciaenidae) with phylogenetic consideration. Mar Genomics 3:201-209.
Cheng J, Ma GQ, Miao ZJ, Shui BN and Gao TX (2011) Complete mitochondrial genome sequence of the spinyhead croaker Collichthys lucidus(Perciformes, Sciaenidae) with phylo-genetic considerations. Mol Biol Rep (Epub).
Cui ZX, Liu Y, Li CP, You F and Chu KH (2009) The complete mitochondrial genome of the large yellow croaker, Larimichthys cracea (Perciformes, Sciaenidae): Unusual features of its control region and the phylogenetic position of the Sciaenidae. Gene 432:33-43.
Guindon S and Gascuel O (2003) A simple, fast and accurate method to estimate large phylogenies by maximum-likelihood. Syst Biol 52:696-704.
Gutell RR, Gray MW and Schnare MN (1993) A compilation of large subunit (23S and 23S-like) ribosomal RNA structures. Nucleic Acids Res 21:3055-3074.
Habib M, Lakra WS, Mohindra V, Khare P, Barman AS, Singh A, Lal KK, Punia P and Khan AA (2010) Evaluation of cyto-chrome b mtDNA sequences in genetic diversity studies of Channa marulius(Channidae, Perciformes). Mol Biol Rep 38:841-846.
Hixson JE and Brown WM (1986) A comparison of the small ri-bosomal RNA genes from the mitochondrial DNA of the great apes and humans: Sequence, structure, evolution and phylogenetic implications. Mol Biol Evol 3:1-18.
Hu J, Zhang DX, Hao JS, Huang DY, Cameron S and Zhu CD (2010) The complete mitochondrial genome of the yellow coaster, Acraea issoria (Lepidoptera, Nymphalidae, Heliconiinae, Acraeini): Sequence, gene organization and a unique tRNA translocation event. Mol Biol Rep 37:3431-3438.
Huelsenbeck JP and Ronquist F (2001) MRBAYES: Bayesian in-ference of phylogeny. Bioinformatics 17:754-755.
Johansen S, Guddal PH and Johansen T (1990) Organization of the mitochondrial genome of atlantic cod,Gadus morhua. Nucleic Acids Res 18:411-419.
Kass RE and Raftery AE (1995) Bayes factors. J Am Stat Assoc 90:773-795.
Kim IC and Lee JS (2004) The complete mitochondrial genome of the rockfish Sebastes schlegeli (Scorpaeniformes, Scorpaenidae). Mol Cell 17:322-328.
Lin LS, Chen JH and Li HY (2008) The fishery biology of Trichiurus japonicusandLarimichthys polyactisin the East China Sea region. Mar Fish 30:126-134.
Lin SL, Ying YP, Han ZQ, Xiao YS and Gao TX (2009) AFLP analysis on genetic diversity and population structure of small yellow croaker Larimichthys polyactis. Afr J Bio-technol 8:2700-2706.
Lowe TM and Eddy SR (1997) tRNAscan-SE: A program for im-proved detection of transfer RNA genes in genome se-quence. Nucleic Acids Res 25:955-964.
Meng ZN, Zhuang ZP, Ding SX, Jin XS, Su YQ and Tang QS (2004) Molecular phylogeny of eight Sciaenid species (Per-ciformes, Sciaenidae) in the China Sea based on mitochon-drial 16S rRNA sequence. Prog Nat Sci 14:514-521 (in Chi-nese with abstract in English).
Miya M and Nishida M (1999) Organization of the mitochondrial genome of a deep-sea fish,Gonostoma gracile(Teleostei, Stomiiformes): First example of transfer RNA gene rear-rangements in bony fishes. Mar Biotechnol 1:416-426. Miya M, Takeshima H, Endo H, Ishiguro NB, Inoue JG, Mukai T,
Satoh TP, Yamaguchi M, Kawaguchi A, Mabuchi K,et al. (2003) Major patterns of higher teleostean phylogenies: A new perspective based on 100 complete mitochondrial DNA sequences. Mol Phylogenet Evol 26:121-138.
Naylor GJ, Collins TM and Brown WM (1995) Hydrophobicity and phylogeny. Nature 373:555-556.
Nelson JS (2006) Fishes of the World. 4th edition. John Wiley and Sons, New York, 600 pp.
Nylander JAA, Ronquist F, Huelsenbeck JP and Nieves-Aldrey JL (2004) Bayesian phylogenetic analysis of combined data. Syst Biol 53:47-67.
Oh DJ, Kim JY, Lee JA, Yoon WJ, Park SY and Jung YH (2007) Complete mitochondrial genome of the rock bream Oplegnathus fasciatus (Perciformes, Oplegnathidae) with phylogenetic considerations. Gene 392:174-180.
Ohtsuki T, Kawai G and Watanabe K (2002) The minimal tRNA: Unique structure ofAscaris suummitochondrial tRNAser-UCU having a short T arm and lacking the entire D arm. FEBS Lett 514:37-43.
Ojala D, Montoya J and Attardi G (1981) tRNA punctuation model of RNA processing in human mitochondria. Nature 290:470-474.
Posada D (2008) jModelTest: Phylogenetic model averaging. Mol Biol Evol 25:1253-1256.
Poulin E, Cardenas L, Hernandez CE, Kornfield I and Ojeda FP (2004) Resolution of the taxonomic status of Chilean and Californian jack mackerels using mitochondrial DNA se-quence. J Fish Biol 65:1160-1164.
Reeder TW (2003) A phylogeny of the Australian Sphenomor-phus group (Scincidae, Squamata) and the phylogenetic placement of the crocodile skinks (Tribolonotus): Bayesian approaches to assessing congruence and obtaining condence in maximum likelihood inferred relationships. Mol Phylo-genet Evol 27:384-397.
Sambrook J and Russell DW (2001) Molecular Cloning: A Labo-ratory Manual. Cold Spring Harbor LaboLabo-ratory Press, New York.
Sbisa E, Tanzariello F, Reyes A, Pesole G and Saccone C (1997) Mammalian mitochondrial D-loop region structure analysis: Identification of new conserved sequence and their func-tional and evolutionary implications. Gene 205:125-140. Seikai National Fisheries Research Institute (2001) Biological
and Ecological Characteristics of Valuable Fisheries Re-sources from the East China Sea and the Yellow Sea, Com-parison between the Chinese and Japanese Knowledges. Seikai National Fisheries Research Institute, Nagasaki, 503 pp.
Szafranski P (2009) The mitochondrialtrn-cox1locus: Rapid evo-lution in Pompilidae and evidence of bias in cox1 initiation and termination codon usage. Mitochondrial DNA 20:15-25.
Taanman JW (1999) The mitochondrial genome: Structure, tran-scription, translation and replication. Biochim Biophys Acta 1410:103-123.
Tamura K, Dudley J, Nei M and Kumar S (2007) MEGA4: Molec-ular Evolutionary Genetics Analysis (MEGA) ver. 4.0. Mol Biol Evol 24:1596-1599.
Tong X, Du B, Yu DH, Gong SY, Guo YH, Huang GJ and Li LH (2007) Sequence analysis of mitochondrial 16S rRNA gene fragment in Chups croaker (Nibea coibor). Mar Fish Res 28:85-91 (in Chinese with abstract in English).
Wan RJ and Sun S (2006) The category composition and abun-dance of ichthyoplankton in the ecosystem of the Yellow Sea and the East China Sea. Acta Zool Sin 52:28-44 (in Chi-nese with abstract in English).
Wang TW and Clayton DA (1985)In vitroreplication of human mitochondrial DNA: Accurate initiation at the origin of light-strand synthesis. Cell 42:951-958.
Wyman SK, Jansen RK and Boore JL (2004) Automatic annota-tion of organellar genomes with DOGMA. Bioinformatics 20:3253-3255.
Xiao YS, Zhang Y, Gao TX, Takashi Y, Yabe M and Sakurai Y (2009) Genetic diversity in the mtDNA control region and population structure in the small yellow croaker Larimichthys polyactis. Environ Biol Fish 85:303-314.
Xu TJ, Cheng YZ, Sun YN, Shi G and Wang RX (2010) The com-plete mitochondrial genome of bighead croaker,Collichthys niveatus(Perciformes, Sciaenidae): Structure of control re-gion and phylogenetic considerations. Mol Biol Rep 38:4673-4685.
Xue Y, Jin XS, Zhang B and Liang ZL (2004) Diet composition and seasonal variation in feeding habits of small yellow croakerPseudosciaena polyactisBleeker in the central Yel-low Sea. J Fish Sci China 3:237-243.
Yan LP, Hu F, Ling JZ and Li SF (2006) Study on age and growth of Larimichthys polctisin the East China Sea. Per Ocean Univ China 36:95-100 (in Chinese with abstract in English). Yang R, Wu XB, Yan P, Su X and Yang BH (2010) Complete
mi-tochondrial genome of Otis tarda (Gruiformes, Otididae) and phylogeny of Gruiformes inferred from mitochondrial DNA sequences. Mol Biol Rep 37:3057-3066.
Yang Z (1996) Maximum likelihood models for combined analy-ses of multiple sequence data. J Mol Evol 42:587-596. Zardoya R and Meyer A (1997) The complete DNA sequence of
the mitochondrial genome of a ‘living fossil’, the coelacanth (Latimeria chalumnae). Genetics 146:995-1010.
Zardoya R, Garrido-Pertierra A and Bautista JM (1995) The com-plete nucleotide sequence of the mitochondrial DNA ge-nome of the rainbow trout, Oncorhynchus mykiss. J Mol Evol 411:942-951.
Zhao JL, Wang WW, Li SF and Cai WQ (2006) Structure of the mitochondrial DNA control region of the sinipercine fishes and their phylogenetic relationship. Acta Genet Sin 33:793-799.
Zhu YT, Lo YL and Wu HL (1963) A Study on the Classication of the Sciaenoid Fishes of China, with Description of New Genera and Species. 1st edition. Shanghai Science and Technology Press, Shanghai, pp. 13-14.
Supplementary Material
The following online material is available for this article:
Figure S1 - Gene map of theL. polyactis mitochon-drial genome
Figure S2 - Sequences ofL. polyactismitochondrial tRNA genes, represented in the clover-leaf form.
Table S1 - PCR primers in the analysis of the L. polyactismitochondrial genome
Table S2 - Base composition of theL. polyactis mito-chondrial genome
Table S3 - Comparison of predicted initiation and ter-mination condons of the 13 mitochondrial protein-coding genes among 23 species of Percoidei.
Table S4 - Codon usage inL. polyactismitochondrial protein-coding genes
Table S5 - Consensus sequences of conserved do-mains in control regions of Percoidei species.
This material is available as part of the online version of this article from http://www.scielo.br/gmb
Associate Editor: Ana Tereza R. Vasconcelos
Primer Sequence (5’-3’)
1F TAGAGGCATTTAGGCACAAGGT
1R TTCTGTTTATTAGAGCGGAGGC
2F AACCAACCATAGCCCACGACA
2R ATTCATTTCCCAGGCAACCAG
3F ATAAAGACCCGTATGAATGGC
3R ATGAGCGGTAAGATAGCAAGG
4F CCCTCCAACTCCTTAGAAAAG
4R GGTGACCGAAGAATCAGAATA
5F GACATTGGCACCCTCTATCTAA
5R AGGCAAGGTCTTCGTAATCAGT
6F ACTTCTTCACTTTCACGACCA
6R AGAGTCAAACGACATCTACGA
7F TCATCATCGGCTCTACATTCCTG
7R GGCGAGACTGGCAATAAATCATC
8F TATGGCGTTCACCTCTGACTTC
8R TTGATTGAGCCCGATGGTTACT
9F CAACTGGCAAATCAGCACAA
9R TTACAAGGAGAAAGAGCACGAC
10F GACTTGAAAAACCACCGTTG
10R CTCCGATCTCCGGATTACAAGAC
11F TGATACTTCCTATTCGCCTAC
A C G T A+T Protein
1st 25.9 29.0 25.3 20.0 45.9
2nd 18.2 27.7 13.8 40.0 58.2
3rd 30.2 40.5 8.5 21.0 51.2
Total 24.8 32.4 15.9 26.9 51.7
tRNAs 27.4 21.5 24.0 27.1 54.5
rRNAs 32.6 26.7 20.4 20.3 52.9
Control region 32.2 23.2 15.0 29.6 61.8
Predicted initiation codon and termination codon Gene
ATPase6 ATPase8 COI COII COIII Cytb ND1 ND2 ND3 ND4 ND4L ND5 ND6
1 ATG/TA- ATG/TAA ATG/AGA ATG/T-- ATG/TA- ATG/TAA ATG/TAG ATG/TA- ATG/T-- ATG/T-- ATG/TAA ATG/TAA ATG/TAA
2 ATG/TAA ATG/TAA ATG/AGA ATG/T-- ATG/TA- ATG/T-- ATG/TAG ATG/TA- ATG/T-- ATG/T-- ATG/TAA ATG/TAA ATG/TAA
3 ATG/TAA ATG/TAA ATG/AGA ATG/T-- ATG/TA- ATG/T-- ATG/TAG ATG/TA- ATG/T-- ATG/T-- ATG/TAA ATG/TAA ATG/TAG
4 ATG/TAA ATG/TAA ATG/AGA ATG/T-- ATG/TA- ATG/T-- ATG/TAG ATG/TA- ATG/T-- ATG/T-- ATG/TAA ATG/TAA ATG/TAA
5 ATG/TAA ATG/TAA ATG/AGA ATG/T-- ATG/TA- ATG/T-- ATG/TAG ATG/TA- ATG/T-- ATG/T-- ATG/TAA ATG/TAA ATG/TAA
6 ATG/TA- ATG/TAA GTG/AGG ATG/T-- ATG/TA- ATG/T-- ATG/TAA ATG/TA- ATG/T-- ATG/T-- ATG/TAA ATG/TAG ATG/TAA
7 ATG/TAA ATG/TAG GTG/TAA ATG/T-- ATG/T-- ATG/T-- ATG/TAA ATG/T-- ATG/T-- ATG/T-- ATA/TAA ATG/TAA ATG/TAA
8 ATG/TAA ATG/TAG GTG/AGG ATG/TT- ATG/TA- ATG/TA- ATG/TAG ATG/TA- ATG/T-- ATG/T-- ATG/TAA ATG/TAA ATG/TAG
9 ATG/TAA ATG/TAA GTG/TAA ATG/T-- ATG/TA- ATG/T-- ATG/TAA ATG/TAA ATG/TAG ATG/T-- ATG/TAA ATG/TAA ATG/TAA
10 ATG/TA- ATT/TAA GTG/TAA ATG/T-- ATG/TA- ATG/T-- ATG/TAA ATG/TAA ATG/T-- ATG/T-- ATG/TAA ATG/TAG ATG/TAA
11 ATG/TAA ATG/TAA GTG/TAA ATG/T- ATG/TAA ATG/T- ATG/TAG ATG/TAA ATG/TAG ATG/T- ATG/TAA ATG/TAA ATG/TAA
12 ?/TA- ATG/TAA GTG/TAA ATG/T- ATG/TA- ATG/T-- ATG/TAA ATG/TA- ATG/T-- GTG/T-- ATG/TAA ATG/TAA ATG/TAG
13 ATG/TAA ATG/TAA GTG/TAA ATG/TA- ATG/TA- ATG/T-- ATG/TAA ATG/TAA ATG/T-- ATG/T-- GTG/TAA ATG/TAA ATG/TAG
14 ATG/TA- ATG/TAA GTG/TAA ATG/T-- ATG/TA- ATG/T-- ATG/TAA ATG/TA- ATG/T-- ATG/T- ATG/TAA ATG/TAG ATG/TAA
15 ATG/TA- ATG/TAA GTG/TAA ATG/T- ATG/TA- ATG/T-- ATG/TAA ATG/TA- ATG/T-- ATG/T-- ATG/TAA ATG/TAG ATG/TAG
16 ATG/TA- ATG/TAA GTG/TAA ATG/TAG ATG/TA- ATG/T-- ATG/TAG ATG/TA- ATG/T-- ATG/T-- ATG/TAA ATG/TAG ATG/TAA
17 ATG/TA- ATG/TAA GTG/TAA ATG/T-- ATG/TA- ATG/T-- ATG/TAA ATG/TA- ATG/T-- ATG/T- ATG/TAA ATG/TAA ATG/TAG
18 ATG/TAA ATG/TAA GTG/TAA ATG/T-- ATG/TAG ATG/T-- ATG/TAG ATG/TAA ATG/TAG ATG/T- ATG/TAA ATG/TAA ATG/TAG
19 ATG/TA- ATG/TAA GTG/TAA ATG/T-- ATG/TA- ATG/T-- ATG/TAA ATG/TA- ATG/T-- ATG/T-- ATG/TAA ATG/TAA ATG/TAG
20 ?/TA- ATG/TAA GTG/T- ATG/T-- ATG/TA- ATG/T-- ATG/TAA ATG/TA- ATG/T-- ATG/T-- ATG/TAA ATG/TAA ATG/AGA
21 ATG/TAA ATG/T-- GTG/TAA ATG/T- ATG/TAA ATG/T-- ATG/TAA ATG/TA- ATG/T-- ATG/T-- ATG/TAA ATG/TAA ATG/TAG
22 ATG/TA- ATG/TAA GTG/TAA ATG/T-- ATG/TA- ATG/T- ATG/TAA ATG/T-- ATG/T-- ATG/T-- ATG/TAA ATG/TAA ATG/TAA
23 ATG/TAA ATG/TAA GTG/AGG ATG/T-- ATG/TAA ATG/T-- ATG/TAA ATG/TAA ATG/TAG ATG/T-- ATG/TAA ATG/TAA ATG/TAA
Notes: 1: Larimichthys crocea 2: Larimichthys polyactis 3: Miichthys miiuy 4: Collichthys lucida 5: Collichthys niveatus 6: Doederleinia berycoides 7: Trachurus trachurus 8: Spicara maena 9: Micropterus salmoides 10: Heniochus diphreutus 11: Emmelichthys struhsakeri 12: Parapristipoma trilineatum 13: Lates calcarifer
14: Lethrinus obsoletus 15: Lutjanus rivulatus 16: Pterocaesio tile 17: Monodactylus argenteus 18: Etheostoma radiosum 19: Chaetodontoplus septentrionalis 20:
Amino acid Codon Number Amino acid Codon Number
TTT 105 TAT 46
Phe
TTC 132
Tyr
TAC 62
TTA 58 TGT 9
TTG 18
Cys
TGC 22
CTT 127 CAT 28
CTC 224
His
CAC 79
CTA 183 CAA 89
Leu
CTG 65
Gln
CAG 9
ATT 124 AAT 32
Ile
ATC 145
Asn
AAC 87
ATA 96 AAA 61
Met
ATG 61
Lys
AAG 10
GTT 58 GAT 22
GTC 58
Asp
GAC 55
GTA 52 GAA 74
Val
GTG 30
Glu
GAG 28
TCT 32 TGA 101
TCC 65
Trp
TGG 20
TCA 66 AGT 10
Ser
TCG 9
Ser
AGC 42
CCT 48 GGT 29
CCC 127 GGC 109
CCA 43 GGA 70
Pro
CCG 5
Gly
GGG 35
ACT 53 CGT 8
ACC 141 CGC 18
ACA 112 CGA 42
Thr
ACG 13
Arg
CGG 10
GCT 58 TAA 5
GCC 180 TAG 1
GCA 94 AGA 1
Ala
GCG 12
Conserved domians Consensus sequences
CSB-F ATGYAGTAAGARCCKACCAWCM
CSB-E AGGGRCAA----WB-GTGGGG
CSB-D TATTVCTGRCAWYTGGYTCCT
CSB-1
ATT-TCA-G--CATA--CSB-2 A-CCCCCCTACCCCCC