Authors
Fernando Abrão Garcia 1
Beatriz Fidale 1
Sebastião Rodrigues Ferreira-Filho 1
1 Universidade Federal de
Uberlândia.
Submitted on: 7/6/2016. Approved on: 12/2/2016.
Correspondence to: Sebastião Rodrigues Ferreira-Filho.
Universidade Federal de Uberlândia.
Rua Pará, s/nº, Bairro Umuarama, Uberlândia, MG, Brazil.
CEP: 38400-902
E-mail: sebahferreira@gmail. com
I
NTRODUCTIONBlood pressure (BP) varies continuously over a 24-hour period due to neurohumoral, behavioral and environmental factors.1,2
This variation increases with aging, and it is more prevalent in hypertensive patients than in normotensive individuals.3 Blood
pressure variability (BPV) is associated
Blood pressure variability in the elderly. Association between
postprandial and sleeping periods
Variabilidade da Pressão Arterial no Idoso. Associação entre os
períodos pós prandial e sono
Introdução: A variabilidade da Pressão Arterial Sistêmica (PAS) é considerada um importante fator de risco cardio vascular. Objetivo: Verificar as possíveis associações entre as variabilidades pressóricas nos períodos pós prandial e durante o sono. Métodos: A variabilidade das pressões sistólica, diastólica, média, de pulso e frequência cardíaca foram avaliadas em 69 pacientes idosos nos períodos pós prandial e durante o sono. A Monitorização Ambulatorial da Pressão Arterial de 24 horas foi usada para o cálculo da variabilidade pressórica e os resultados apresentados no índice frequência tempo. Resultados: Observamosuma redução nos níveis sistólicos pos prandiais em relação ao período pre prandial e durante o sono (124.7 ± 14.6, 113.2 ± 15.3 e 108.5 ± 13.9mmHg, respectivamente; p = 0.003). A associação das variabilidade das pressões sistólicas, diastólicas e média foram confirmadas (p < 0.005) entre osperíodos avaliados. Conclusão: A correlação entre as variabilidades da pressão arterial apos as refeições e o sono tem sido pouco demonstrada na literatura. Estas relações podem sugerir que ambos os eventos podem coexistir em outras situações clínicas.
R
ESUMOPalavras-chave: hipertensão; hipotensão; idoso; monitorização ambulatorial da pressão arterial.
Introduction: The variability of arterial blood pressure (BP) is considered an important cardiovascular risk factor.
Objective: To verify the possible associations between the postprandial and the sleeping blood pressure variability.
Methods: This study evaluated systolic, diastolic, mean, pulse pressures and heart variability in 69 elderly patients in preprandial, postprandial and sleeping periods. One 24 hours ambulatory blood pressure monitoring was used for measurements and the results were showed in the time-rate index. Results:
We observed a decrease in the systolic blood pressure values from preprandial to postprandial and to the sleeping periods (124.7 ± 14.6, 113.2 ± 15.3 and 108.5 ± 13.9mmHg, respectively; p = 0.003). Associations between BP variability of the postprandial and sleeping periods were obtained for systolic, diastolic and mean arterial pressure. Conclusion: The correlation between postprandial and sleeping BP variability has rarely been demonstrated in the literature. These correlations between BP changes after eating and during sleep might suggest that both events could coexist in other clinical situations.
A
BSTRACTKeywords: aged; blood pressure monitor-ing, ambulatory; hypertension; hypoten-sion.
DOI: 10.5935/0101-2800.20170018
especially among elderly patients.4 The
greater BPV in elderly people could be caused by impaired arterial baroreflex control, which in turn could be related to arterial stiffness.5
Postprandial hypotension has a significant prevalence among the elderly6,7
are still not entirely clear.6-10 Studies separately have
shown that postprandial and sleeping blood pressure changes may be correlated with cardiovascular events in the elderly.4,8-13 The variability of postprandial
blood pressure relates to the variability of sleeping blood pressure. This present study aims to verify the possible association between postprandial and sleeping BPV in the elderly.
M
ETHODSPATIENTS
This observational and cross-sectional study was conducted in a private cardiology center in Uberlândia, Minas Gerais, Brazil from January 2012 to November 2013. One twenty-four-hour ambulatory blood pressure monitoring (ABPM) was performed on 455 patients and was conducted within well-established guidelines.14-16 One hundred seven patients ≥ 60 years
old were subjected to the following exclusion criteria:
diabetes mellitus (n = 11), Parkinson’s disease (n = 1), poor-quality ABPM (n = 16) and non-completion of informed consent (n = 10). Sixty-nine patients were included in the study. The clinical and anthropometric data were collected. The study was performed at the Federal University of Uberlândia, Minas Gerais, Brasil and was approved by its Ethics Committee for Research Involving Human-Beings.
AMBULATORYBLOODPRESSUREMONITORING
The ABPM was performed using Mobil-O-Graph®
NG (Stolberg, Germany)17 installed on the
non-dominant upper limb; if there was a difference in systolic BP greater than ten mmHg between limbs, the device was then placed on the arm with the highest pressure value. Immediately after its installation, two consecutive measurements were performed to verify its correct functioning. Blood pressure measurements were determined every 20 minutes for 24 hours.18 The
patients received an explanation of how to complete two diaries correctly: in the first; they were asked to describe the symptoms presented during ABPM, the sleep quality evaluation and any medications used over the 24-hour period; the second diary was for recording all food eaten over the 24-hour period.
PROTOCOLDESIGN
The study was separated into three periods: pre-prandial (PreP), postpre-prandial (PostP) and sleeping (S).
The PreP period was considered to be the two hour period before lunch, the PostP period to be the two hour period immediately after the end of the meal and the S period was considered to be the time interval between bedtime and waking, as noted by the patient. Arbitrarily, PreP and PostP were subdivided into six intervals of 20 minutes, and S was divided into six 80-minute intervals. The antihypertensive drugs being used were not previously removed for study.
The mean values for systolic, diastolic and pulse pressures (SBP, DBP, and PP; respectively) and the mean arterial blood pressure (MAP) were expressed in mmHg. Heart rate (HR) values were expressed in bpm. For the systemic blood pressure measurements were used appropriate cuffs to the size and arm circumference. For diagnosis of postural hypotension, the determination of PAS was performed with the patient in a sitting and standing positions. This procedure was carried in the doctor’s office before placing the ABPM device.
ABPM DURINGLUNCH
ABPM measurements were excluded during lunch to avoid postural and upper-limb movement interferences. The time from the beginning and the end of the lunch were recorded in minutes in the food diaries, as well as the amounts and kinds of ingested food.
ABPM DATAANALYSIS
By from ABPM results, BPV was defined as the within-patient standard deviation for all SBP, DBP, MAP and PP recording during two hours before and after lunching and eight hours for sleeping period. The time rate of all the blood pressure variations was defined as the first derivative of SBP, DBP, MAP and PP against time. Given N recordings od systemic blood pressures during the studied periods we can compute N-1 values for the rate of BP variation at N-1 different time indices.19 HRV was defined as the within-subject
R
r
N
r
N
i
1
1
1
i
=
=
-/
where: s: sum
r: the blood pressure variation rate over time N: the number of measurements.
R:The time-rate index is defined as the first derivative of the blood pressure at the time (i), reports on blood pressure oscillations in consecutive measurements.
INGESTEDCALORIES
All the information regarding the amount of ingested macronutrients, such as proteins (g), lipids (g), carbohydrates (g) and total kilocalories was obtained from the diaries. To calculate the number of calories ingested at lunch was used the Dietpro software 5.5i (nutritional assessment and dietary prescription software 2000-2011, Federal University of Viçosa, Minas Gerais, Brazil).
STATISTICALANALYSIS
The sample size was calculated considering a power of 80% to detect a difference of 70% for the alterations of the sleeping blood pressure and 30% for the postprandial blood pressure variations, p < 0.05 and CI 95%, resulting in a minimum sample size of 65 patients. Quantitative variables are described as means, medians, minima, maxima and standard deviations (SD). Frequencies and percentages were given for qualitative variables.
Single or multiple linear regression models were used to evaluate the associations between the continuous variables, and the Pearson coefficient was used to assess the associations between the quantitative variables. The Student’s t- test was used to compare the two groups of quantitative independent variables. Analysis of variance for a repeated measure models (ANOVA) was used. In cases of rejection of the mean equality hypothesis over the three periods, the Least Significant Difference (LSD) test was used to compare pairs. Comparative analyses of the PostP variation rate and the S variation rate were performed for all variables. SPSS Statistics software version 20.0 (IBM Corp. Armonk, NY, USA) was used for the statistical analyses and p values of < 0.05 were considered significant.
R
ESULTSThe clinical characteristics of the patients are in Table 1. Fifty-nine of sixty-nine patients had diagnoses of hypertension. They had been treated with antihypertensive drugs but did not have postural hypotension. The comparison between the means of SBP, DBP, PP, MAP and HR in the PreP, the PostP and the S periods are presented in Table 2. The highest SBP (maxSBP) value during the PreP period was also compared with the lowest SBP (minSBP) value in the PostP period, and the averages were 137.6 ± 16.3 vs. 102.7 ± 15.3 mmHg, respectively; p < .001. Comparisons between the blood pressure variability rates in the PreP, the PostP and the S periods are presented in Table 3. The blood pressure variability correlations between the PostP and the S periods were: for SBPVi, (r = 0.27, p = 0.124; CI: -0.000-0.109); DBPVi (r = 0.35, p = .005; CI: 0.017 -0.112), MAPVi (r = 0.27, p = .034; CI: 0.042-0.150); and PPVi (r = 0.20, p = .128 CI: 0.017-0.112). Figure 1 shows the SBPVi, MAPVi and DBPVi correlations.
MULTIVARIATEANALYSIS
Gender (male) was significantly associated with DBP, MAP and PP PostP (p < .001, p = .002 and p = .025; respectively). Age was significantly associated with PP PostP (p = 0.01), and race (non black) was signifi-cantly associated with MAP PostP (p = .005).
CORRELATIONS BETWEEN FOOD INTAKE AND POSTPRANDIAL BPV AND HRV
There was no correlation between calories intake and levels of BPV and HRV in the PreP and the PostP periods (p > 0.05).
D
ISCUSSIONMany authors described the reductions in arterial blood pressure levels in the elderly after eating.6,20,21
Variable N = 69
Age (years) 69.7 ± 7.6 Body Mass Index (Kg/m2) 26.4 ± 4.4
Gender (M/F)% 39.1/60.9 Quality of sleep (%)
Good 33.3
Regular 53.6
Bad 13.1
maxSBP prep (mmHg) 137.6 ± 16.3 minSBP postP (mmHg) 102.7 ± 15.3 Risk factors and comorbidities (%). 85.5 Hypertension 53.6
Snoring 50.7
Dyslipidemia 21.7
Arthrosis 17.4
Thyroid disease 5.8
Smoking 44.9
Others 50.7
Antihypertensive medications (%). 47.8 Angiotensin receptor blocker 27.5 Thiazide diuretic 26.1 Beta-blocker 23.2 Calcium channel blocker 4.3 Inhibitor of angiotensin converting
enzyme Others
maxSBP = maximum Systolic Blood Pressure in preprandial period; minSBP = minimum Systolic Blood Pressure in postprandial period.
TABLE 1 CLINICALCHARACTERISTICSOFPATIENTS
Variable N Mean Median Minimum Maximum SD p value
SBP PRE 69 124.7 124.0 93.5 155.8 14.6 SPB POS 69 113.2* 111.8 76.8 150.3 15.3
SPB Sleep 69 108.5** 106.8 85.5 150.8 13.9 < 0.001
DPB PRE 69 72.8 73.3 46.8 97.3 12.8
DPB POS 69 66.5* 66.5 43.6 95.3 11.2
DPB Sleep 69 61.3** 60.3 41.7 95.2 10.8 < 0.001 MAP PRE 69 94.4 95.0 65.5 122.2 12.4
MAP POS 69 86.2* 86.0 58.0 118.7 11.9
MAP Sleep 69 81.2** 79.2 61.7 118.3 11.6 < 0.001
PP PRE 69 51.9 52.2 27.8 90.7 11.7
PP POS 69 46.7 44.0 29.7 73.0 10.8
PP Sleep 69 47.2** 45.3 33.7 70.8 8.3 < 0.001
HR PRE 69 73.8 74.0 43.8 109.0 13.1
HR POS 69 74.5 74.8 45.7 101.8 13.2
HR Sleep 69 62.3** 60.8 42.3 81.7 9.2 < 0.001
TABLE 2 BLOODPRESSUREANDHEARTRATEVALUESINPREPRANDIAL, POSTPRANDIALANDSLEEPPERIODS
*: post vs. pre; ** post vs. S; SBP: systolic blood pressure; DPB: diastolic blood pressure; MAP: mean arterial pressure; PP: pulse pressure; HR: heart rate; SD: Standard deviation; PRE: preprandial; POS: postprandial. BP: mmHg and HR bpm.
Besides this, postprandial hypotension has been linked to cardiovascular events. For example, Zanasi
et al.8 also found a high prevalence of postprandial
hypotension in the elderly, and it was a predictor of cardiovascular mortality; Tabara et al.4 showed
that a decline in postprandial BP could be a new risk marker for the occurrence of cerebral asymptomatic lacunar infarcts. On the other hand, the reduction in HR in sleep period to the postprandial period can be attributed to a greater reduction in nervous system activity during the sleep period.
Our data also revealed that the SBPVi, the DBPVi and the MAPVi did not change from the PreP to PostP period (p > 0.05) (Table 3) a similar oscillation pattern in the PreP and the PostP periods in elderly patients. Although it was unlikely, the PPVi manifested a reduction in the PostP period when compared with that of the PreP period, perhaps because the PP oscillation intensity was more directly linked to the thickening of the arterial vessel wall and was, therefore, less intense in response to modifications of blood pressure after meals.8 Some authors related,
within a broader context, that not only a significant absolute reduction in the blood pressures levels after meals but also postprandial pressure oscillation could reflect an increased cardiovascular risk.4
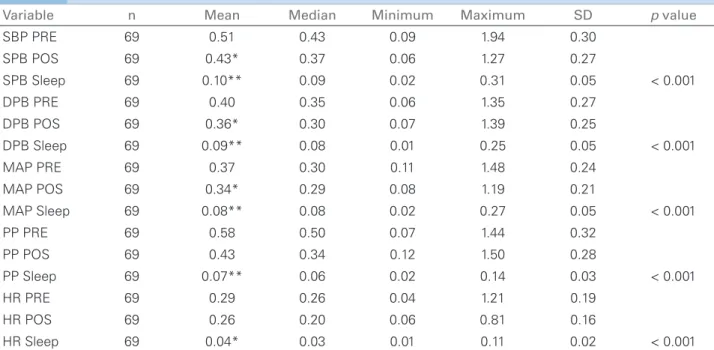
Variable n Mean Median Minimum Maximum SD p value
SBP PRE 69 0.51 0.43 0.09 1.94 0.30
SPB POS 69 0.43* 0.37 0.06 1.27 0.27
SPB Sleep 69 0.10** 0.09 0.02 0.31 0.05 < 0.001
DPB PRE 69 0.40 0.35 0.06 1.35 0.27
DPB POS 69 0.36* 0.30 0.07 1.39 0.25
DPB Sleep 69 0.09** 0.08 0.01 0.25 0.05 < 0.001
MAP PRE 69 0.37 0.30 0.11 1.48 0.24
MAP POS 69 0.34* 0.29 0.08 1.19 0.21
MAP Sleep 69 0.08** 0.08 0.02 0.27 0.05 < 0.001
PP PRE 69 0.58 0.50 0.07 1.44 0.32
PP POS 69 0.43 0.34 0.12 1.50 0.28
PP Sleep 69 0.07** 0.06 0.02 0.14 0.03 < 0.001
HR PRE 69 0.29 0.26 0.04 1.21 0.19
HR POS 69 0.26 0.20 0.06 0.81 0.16
HR Sleep 69 0.04* 0.03 0.01 0.11 0.02 < 0.001
TABLE 3 BLOODPRESSUREVARIATIONINDEXANDHEARTRATEINPREPRANDIAL, POSTPRANDIALANDSLEEPPERIODS
*: post vs. pre; ** post vs. S; SBP: systolic blood pressure; DPB: diastolic blood pressure; MAP: mean arterial pressure; PP: pulse pressure; HR: heart rate; SD: Standard deviation; PRE: preprandial; POS: postprandial. BP: mmH/min and HR: bpm.min.min.
Figure 1. Correlation between sleep and postprandial variation indexes for systemic arterial blood pressure. SBP: Systolic Blood Pressure; ∆ MAP: Mean Arterial Pressure, ∆ DBP: Diastolic Blood Pressure.
results are consistent with the data published by Brien
et al.22 in a meta-analysis involving hypertensive
patients. Those authors also found the same percentage reductions in SBP levels during the sleep period and the diurnal period.
At the same time, a positive and significant BPVi correlation between the PostP and the S periods was found for almost all pressures, especially as regards the MAPVi (Figure 1). This correlation was not found for PPVi showing that PP oscillation has different behaviors after eating and sleeping and that PPVi and PP are not linked each other. The male gender was associated with the SBP, DBP and MAP variations in PosP and the
exception was the PP that was associated with female gender and age of patients. It is known that PP increases progressively with aging and it is an indicator of the stiffness of the great arterial vessels. The correlation between the postmenopausal women and arterial stiffness is described in the medical literature, and Go
et al.23 have shown that elderly postmenopausal women
have higher blood pressure levels than males in the same age. The rigidity of the elderly vessels could induce the PPVi to respond differently to different physiologic stimuli. The multivariate analyses indicated that the PP was associated with age (p < 0.01).
The associations obtained in our study were previously detected by Kohara et al.24 in the elderly
patients. These authors found reductions in SBP not only after meals but also at night; however, these authors had not studied blood pressure variability and had not correlated postprandial levels of blood pressure with night levels of blood pressure.
On the other hand, Fagard et al.25 reported in a
meta-analysis that the absence of sleeping pressure-dipping was an independent predictor of mortality and cardiovascular events in elderly hypertensive patients. Because of the correlations found in our study, it is possible to say that in pressure-dipping or non-dipping patients, the arterial blood pressure after eating could be following the same behavior.
postprandial hypotension was related to sleeping BP behavior. The results demonstrated the presence of this association, for the first time, using BPVi by ABPM for 24 hours (Figure 1). The BPV was also evaluated using different methods.5,19,26-28 However,
the vast majority of studies referred to BP changes in the postprandial and the sleeping periods, and although these changes were analyzed separately, no associations were defined.8,24,29
The correlation between postprandial and sleeping BP variability has rarely been demonstrated in the literature. These correlations between changes after eating and changes in sleep might suggest that both events could exist together and be predictors of cardiovascular mortality. Our data demonstrate the presence of this association.
However, other studies should be conducted to confirm the existence of this association as a cardiovascular event marker. The postprandial hypotension as well as the arterial hypotension during sleep, in so-called hyper dippers patients, could increase the RCV, showing that the postprandial hypotension and the hypotension during the sleep are not contradictory in determining the CVR.10 The
reduction of blood pressure levels after eating is a variable that can be modified with the ingestion of different kinds of meals.30 The use of antihypertensive
drugs as well as the ABPM data collected in doctor’s office database and not specific to this research can be considered limitations of this study.
A
CKNOWLEDGEMENTSWe gratefully acknowledge the patients that participated in this research.
R
EFERENCES1. Parati G, Ochoa JE, Lombardi C, Bilo G. Assessment and manage-ment of blood-pressure variability. Nat Rev Cardiol 2013;10:143-55. DOI: http://dx.doi.org/10.1038/nrcardio.2013.1
2. Mancia G. Short- and long-term blood pressure variability: present and future. Hypertension 2012;60:512-7. DOI: http:// dx.doi.org/10.1161/HYPERTENSIONAHA.112.194340 3. Kikuya M, Hozawa A, Ohokubo T, Tsuji I, Michimata M,
Mat-subara M, et al. Prognostic significance of blood pressure and heart rate variabilities: the Ohasama study. Hypertension 2000;36:901-6. DOI: http://dx.doi.org/10.1161/01.HYP.32000;36:901-6.5.901
4. Tabara Y, Okada Y, Uetani E, Nagai T, Igase M, Kido T, et al. Postprandial hypotension as a risk marker for asymptomatic lacunar infarction. J Hypertens 2014;32:1084-90. DOI: http:// dx.doi.org/10.1097/HJH.0000000000000150
5. Schillaci G, Bilo G, Pucci G, Laurent S, Macquin-Mavier I, Bou-touyrie P, et al. Relationship between short-term blood pressure variability and large-artery stiffness in human hypertension: find-ings from 2 large databases. Hypertension 2012;60:369-77. DOI: http://dx.doi.org/10.1161/HYPERTENSIONAHA.112.197491
6. Puisieux F, Bulckaen H, Fauchais AL, Drumez S, Salomez-Grani-er F, Dewailly P. Ambulatory blood pressure monitoring and postprandial hypotension in elderly persons with falls or synco-pes. J Gerontol A Biol Sci Med Sci 2000;55:M535-40. PMID: 10995052 DOI: http://dx.doi.org/10.1093/gerona/55.9.M535 7. Jansen RW, Lipsitz LA. Postprandial hypotension:
epidemiol-ogy, pathophysiolepidemiol-ogy, and clinical management. Ann Intern Med 1995;122:286-95. PMID: 7825766 DOI: http://dx.doi. org/10.7326/0003-4819-122-4-199502150-00009
8. Zanasi A, Tincani E, Evandri V, Giovanardi P, Bertolotti M, Rioli G. Meal-induced blood pressure variation and cardio-vascular mortality in ambulatory hypertensive elderly patients: preliminary results. J Hypertens 2012;30:2125-32. DOI: http:// dx.doi.org/10.1097/HJH.0b013e328357f16d
9. Kwon HM, Lim JS, Kim YS, Moon J, Park H, Kim HY, et al. Cerebral microbleeds are associated with nocturnal reverse dip-ping in hypertensive patients with ischemic stroke. BMC Neurol 2014;14:8. DOI: http://dx.doi.org/10.1186/1471-2377-14-8 10. Kario K, Shimada K, Pickering TG. Abnormal nocturnal blood
pressure falls in elderly hypertension: clinical significance and determinants. J Cardiovasc Pharmacol 2003;41:S61-6. PMID: 12688399
11. Yano Y, Kario K. Nocturnal blood pressure, morning blood pressure surge, and cerebrovascular events. Curr Hypertens Rep 2012;14:219-27. DOI: http://dx.doi.org/10.1007/s11906-012-0261-z
12. Pierdomenico SD, Pierdomenico AM, Cuccurullo F. Morn-ing blood pressure surge, dippMorn-ing, and risk of ischemic stroke in elderly patients treated for hypertension. Am J Hypertens 2014;27:564-70. DOI: http://dx.doi.org/10.1093/ajh/hpt170 13. Parati G, Bilo G. Postprandial blood pressure fall:
an-other dangerous face of blood pressure variability. J Hy-pertens 2014;32:983-5. DOI: http://dx.doi.org/10.1097/ HJH.0000000000000172
14. O’Brien E, Parati G, Stergiou G. Ambulatory blood pressure measurement: what is the international consensus? Hyperten-sion 2013;62:988-94.
15. Parati G, Stergiou G, O’Brien E, Asmar R, Beilin L, Bilo G, et al.; European Society of Hypertension Working Group on Blood Pressure Monitoring and Cardiovascular Variability. Eu-ropean Society of Hypertension practice guidelines for ambula-tory blood pressure monitoring. J Hypertens 2014;32:1359-66. DOI: http://dx.doi.org/10.1097/HJH.000000000000022 16. Mancia G, Fagard R, Narkiewicz K, Redon J, Zanchetti A, Böhm
M, et al. 2013 ESH/ESC guidelines for the management of arterial hypertension: the Task Force for the Management of Arterial Hyper-tension of the European Society of HyperHyper-tension (ESH) and of the European Society of Cardiology (ESC). Eur Heart J 2013;34:2159-219. DOI: http://dx.doi.org/10.1093/eurheartj/eht151
17. Wei W, Tölle M, Zidek W, van der Giet M. Validation of the mobil-O-Graph: 24 h-blood pressure measurement de-vice. Blood Press Monit 2010;15:225-8. DOI: http://dx.doi. org/10.1097/MBP.0b013e328338892f
18. O’Brien E, Asmar R, Beilin L, Imai Y, Mancia G, Mengden T, et al.; European Society of Hypertension Working Group on Blood Pressure Monitoring. Practice guidelines of the European Society of Hypertension for clinic, ambulatory and self blood pressure measurement. J Hypertens 2005;23:697-701. DOI: http://dx.doi.org/10.1097/01.hjh.0000163132.84890.c4 19. Zakopoulos NA, Tsivgoulis G, Barlas G, Papamichael C,
Spengos K, Manios E, et al. Time rate of blood pressure variation is associated with increased common carotid ar-tery intima-media thickness. Hypertension 2005;45:505-12. PMID: 15753234 DOI: http://dx.doi.org/10.1161/01. HYP.0000158306.87582.43
21. Luciano GL, Brennan MJ, Rothberg MB. Postprandial hypo-tension. Am J Med 2010;123:281e1-6. DOI: http://dx.doi. org/10.1016/j.amjmed.2009.06.026
22. O’Brien E, Sheridan J, O’Malley K. Dippers and non-dippers. Lancet 1988;2:397. DOI: http://dx.doi.org/10.1016/S0140-6736(88)92867-X
23. Go AS, Mozaffarian D, Roger VL, Benjamin EJ, Berry JD, Bla-ha MJ, et al.; American Heart Association Statistics Committee and Stroke Statistics Subcommittee. Heart disease and stroke statistics-2014 update: a report from the American Heart As-sociation. Circulation 2014;129:e28-e292. DOI: http://dx.doi. org/10.1161/01.cir.0000441139.02102.80
24. Kohara K, Jiang Y, Igase M, Takata Y, Fukuoka T, Okura T, et al. Postprandial hypotension is associated with asymptomatic cerebro-vascular damage in essential hypertensive patients. Hypertension 1999;33:565-8. DOI: http://dx.doi.org/10.1161/01.HYP.33.1.565 25. Fagard RH, Thijs L, Staessen JA, Clement DL, De Buyzere ML,
De Bacquer DA. Night-day blood pressure ratio and dipping pattern as predictors of death and cardiovascular events in hypertension. J Hum Hypertens 2009;23:645-53. DOI: http:// dx.doi.org/10.1038/jhh.2009.9
26. Verdecchia P, Angeli F, Gattobigio R, Rapicetta C, Reboldi G. Im-pact of blood pressure variability on cardiac and cerebrovascular complications in hypertension. Am J Hypertens 2007;20:154-61. DOI: http://dx.doi.org/10.1016/j.amjhyper.2006.07.017
27. Manios E, Tsagalis G, Tsivgoulis G, Barlas G, Koroboki E, Michas F, et al. Time rate of blood pressure variation is as-sociated with impaired renal function in hypertensive patients. J Hypertens 2009;27:2244-8. DOI: http://dx.doi.org/10.1097/ HJH.0b013e328330a94f
28. Mena L, Pintos S, Queipo NV, Aizpúrua JA, Maestre G, Sul-barán T. A reliable index for the prognostic significance of blood pressure variability. J Hypertens 2005;23:505-11. DOI: http://dx.doi.org/10.1097/01.hjh.0000160205.81652.5a 29. Winston GJ, Palmas W, Lima J, Polak JF, Bertoni AG, Burke
G, et al. Pulse pressure and subclinical cardiovascular disease in the multi-ethnic study of atherosclerosis. Am J Hypertens 2013;26:636-42. DOI: http://dx.doi.org/10.1093/ajh/hps092 30. Ferreira-Filho SR, Ferreira AC, Oliveira PC, Moreira JF, Ribeiro