ORIGINAL ARTICLE
869
Single nucleotide polymorphisms in DKK3 gene are
associated with prostate cancer risk and progression
_______________________________________________
Min Su Kim
1, Ha Na Lee
2, Hae Jong Kim
3,4, Soon Chul Myung
51
Department of Urology, Seoul Medical Center, Seoul, Korea;
2Department of Urology, Seoul Seonam
Hospital, EwhaWomans University, Seoul, Korea;
3Research Institue for Biomedical and Pharmaceutical
Sciences, Chung-Ang University, Seoul, Korea;
4Advanced Urogenital Diseas Research Center, Chung-Ang
University, College of Medicine, Seoul, Korea;
5Department of Urology, Chung-Ang University, College of
Medicine, Seoul, Korea
ABSTRACT
ARTICLE
INFO
______________________________________________________________ ______________________
We had investigated whether sequence variants within DKK3 gene are associated with
the development of prostate cancer in a Korean study cohort. We evaluated the
asso-ciation between 53 single nucleotide polymorphisms (SNPs) in the DKK3 gene and
prostate cancer risk as well as clinical characteristics (PSA, clinical stage, pathological
stage and Gleason score) in Korean men (272 prostate cancer subjects and 173 benign
prostate hyperplasia subjects) using unconditional logistic regression analysis. Of the
53 SNPs and 25 common haplotypes, 5 SNPs and 4 haplotypes were associated with
prostate cancer risk (P=0.02-0.04); 3 SNPs and 2 haplotypes were significantly
asso-ciated with susceptibility to prostate cancer, however 2 SNPs and 2 haplotypes
exhibi-ted a significant protective effect on prostate cancer. Logistic analyses of the DKK3 gene
polymorphisms with several prostate cancer related factors showed that several SNPs
were significant; three SNPs and two haplotypes to PSA level, three SNPs and two
ha-plotypes to clinical stage, nine SNPs and two haplotype to pathological stage, one SNP
and one haplotypes to Gleason score. To the author’s knowledge, this is the first report
documenting that DKK3 polymorphisms are not only associated with prostate cancer
but also related to prostate cancer-related factors.
Key words:
Biological Markers; Genetic
Variation; Prostatic Neoplasms;
Polymorphism, Single Nucleotide
Int Braz J Urol. 2015; 41: 869-97
_____________________
Submitted for publication:
January 26, 2014
_____________________
Accepted after revision:
March 06, 2014
INTRODUCTION
Prostate cancer is one of the most common
cancers in men. Rates of detection of prostate
can-cer vary widely across the world, with less frequent
detection in South and East Asia than in Europe
and especially the United States (1, 2). However
the incidence rate of prostate cancer in Korea has
rised rapidly during the last decade (3). The
etiolo-gy of prostate cancer is largely unknown,
althou-gh several risk factors such as diet, occupation,
sexually transmitted agents were investigated
epi-demiologically; the only established risk factors
for prostate cancer are increased age, ethnic
back-ground and familial history (4). Recently
genome--wide association studies (GAWS) have identified
more than 40 single-nucleotide polymorphisms
(SNPs) on various genes or chromosomal loci that
are significantly associated with prostate cancer
susceptibility (5). There is increasing interest in
investigating the potential usefulness of SNPs as
diagnostic and prognostic biomarkers for prostate
cancer outcomes (6, 7).
The wingless-type mouse mammary tumor
virus integration site (Wnt) signaling pathway
des-cribes a complex network of proteins well known
IBJU | POLYMORPHISMS IN DKK3 GENE AND PROSTATE CANCER RISK AND PROGRESSION
870
for their roles in embryogenesis and
tumorigene-sis (8). Uncontrolled Wnt signaling has been
re-cognized as an important trait of human cancer
(9). Their activity is regulated by the secreted Wnt
signaling inhibitors including Wnt antagonist
fa-milies namely the secreted frizzled-related protein
(sFRP), Wnt inhibitory factor 1 (Wif-1), and
Di-ckkopf (DKK1-4) families (10).
Dickkopf homologue 3 (DKK3) gene which
is located at 11p15, is proposed to function as a
tumor suppressor gene since its expression is
do-wn-regulated in many types of cancer cells (11).
Inactivation of tumor-suppressive genes by either
genetic or epigenetic mechanisms contributes to
cancer formation. Ectopic expression of DKK3
results in decreased proliferation and is
accom-panied by attenuation of the mitogen-activated
protein kinase pathway (12). If DKK3 regulates the
growth of normal and cancerous prostate cells, the
variation in DKK3 activity may be important in
the onset and progression of prostate cancer. We
hypothesized that sequence variations in DKK3
are candidates for risk factors for development of
prostate cancer and progression.
However to our knowledge, there have
been no reports regarding DKK3 gene
polymor-phisms in prostate cancer. Here we investigated
whether SNPs of the DKK3 gene were associated
with the development of prostate cancer in a
Ko-rean cohort.
MATERIALS AND METHODS
Study Population
Blood samples were obtained from the
Ko-rean Prostate Bank (Seoul, Korea). Both prostate
cancer and benign prostatic hyperplasia (BPH)
groups originated from a population of older men
treated at St. Mary’s Hospital (Seoul, Korea).
Pe-ripheral blood leukocyte samples for genotyping
were obtained from 445 men (prostate cancer,
n=272; BPH, n=173) and were stored at -80°C.
BPH subjects had true biopsy for confirmation
for free of prostate cancer at the time when the
samples were taken according to
prostate-speci-fic antigen blood tests and digital rectal prostate
exams and were excluded from the study if they
had a history of prostate cancer. Prostate cancer
subjects with primary, incident, histologically
confirmed prostate cancer were recruited within 6
months of diagnosis. The median age of the BPH
cohort was 67.3 years, and the median age of the
prostate cancer cohort was 68.2 years. BPH
sam-ples were used as the control group for several
reasons. First, most men have evidence of BPH by
the age of 70 or 80 years; thus, the presence of
some degree of BPH is “normal” at the median
age of diagnosis in our prostate cancer cohort
(age 67.3 years). Truly “normal” samples would
thus only be obtained in a much younger
con-trol cohort, which could introduce bias. Second,
the collection of blood samples requires a hospital
visit and a prostate cancer screening procedure,
which would only be undertaken in men with
evi-dence of symptoms of prostate enlargement. All
the study participants provided written informed
consent. The institutional review board of
Chung--Ang University Hospital and Catholic University
Hospital approved the study. Blood samples were
collected in tubes containing sodium ethylene
dia-minetetraacetic acid from St. Mary’s Hospital in
Korea. The QIA amp blood extraction kit (Qiagen,
Seoul, Korea) was used for DNA extraction.
The PSA level was classified as low (PSA<4),
intermediate (4
≤
PSA<10), or high (PSA
≥
10). The
Gleason score was designated as low (Gleason
score 2-6), intermediate (Gleason score 4+3, 3+4),
or high (Gleason score 8-10) grade. The
clinicopa-thologic regional stages were categorized as
loca-lized (Stage T1N0M0 orT2N0M0), locally
advan-ced (Stage T3N0M0 or T4N0M0), and metastatic
(TxN+ or TxM+) according to the pathologic and/
or radiologic reports. Clinical characteristics of the
study population are listed in Table-1 and were
similar to those of a previous Korean study (13).
SNP Selection and Genotyping
IBJU | POLYMORPHISMS IN DKK3 GENE AND PROSTATE CANCER RISK AND PROGRESSION
871
www.hapmap.org); (b) calculation of minor
al-lele frequency and linkage disequilibrium using
Haplo view software (Cambridge, MA; available
from: http://www.broad.mit.edu/mpg/haploview),
and (c) selection of SNPs having minor allele
fre-quency >0.05 and tagging SNPs if several SNPs
showed high linkage disequilibrium >0.98.
Fur-thermore, we added the SNPs in the DKK3 gene
region from the National Center for
Biotechno-logy Information db-SNPs. The selection criteria
included location (SNPs in exons were preferred)
and amino acid changes (nonsynonymous SNPs
were preferred). Genotyping was performed at the
multiplex level using the Illumina Golden Gate
genotyping system (14). In brief, approximately
250 ng genomic DNA extracted from the blood
of each subject was used for genotyping by DNA
activation, binding to paramagnetic particles,
hy-bridization to oligonucleotides, washing,
exten-sion, ligation, amplification by polymerase chain
reaction, and hybridization to the Bead plate in an
appropriate hybridization buffer. The image
inten-sities were scanned using the Bead Xpress Reader,
and genotyped using the Genome Studio software
(Illumina). The genotype quality score for
retai-ning data was set to 0.25. A total of 53 SNPs were
successfully genotyped.
Statistical analysis
The SNP genotype frequencies were
exa-mined for Hardy-Weinberg equilibrium using the
chi-square test, and all were found to be consistent
(P>0.05) with Hardy-Weinberg equilibrium among
the Korean controls. The data were analyzed using
unconditional logistic regression analysis to
cal-culate the odds ratio (OR) as an estimate of the
re-lative risk of prostate cancer associated with SNP
genotypes (15).
To determine the association between the
genotype and haplotype distributions of patients
and controls, logistic analysis was performed,
controlling for age (continuous value) as a
co-variate to eliminate or reduce any confounding
influence. Significant associations were indicated
(P≤0.05). Multiple comparisons were also
accoun-ted for by using per mutations to calculate the
exact P values for each significant SNP (
α
=0.05).
Lewontin’s D’ and the linkage disequilibrium
co-efficient r2 were examined to measure linkage
disequilibrium between all pairs of bi-allelic loci
(16). Haplotypes were inferred from the
succes-sfully genotyped SNPs using the PHASE
algori-thm, version 2.0 (17), and association analysis
was performed using SAS, version 9.1 (SAS
Insti-tute, Cary, NC). To achieve optimal correction for
multiple testing of markers, representing SNPs in
linkage disequilibrium with each other, the
effec-tive number of independent marker loci (21.3) was
calculated using SNP spectral decomposition
sof-tware (available from: http://genepi.qimr.edu.au/
general/daleN/SNPSpD/), a program that is based
on the spectral decomposition of matrices of
pair--wise linkage disequilibrium among markers (18).
Statistical power of single associations was
calculated with false positive rate of 5%, disease
Table 1 - Study characteristics of prostate cancer cases
and controls.
Cases Controls
N 272 173
Age (year)±SD 68.2±6.8 67.3±8.8
BMI in kg/m2 (%) 24.1±3.3 24.0±3.0
Prostate volume (cm3)±SD 37.2±18.6 48.4±26.2
PSA, ng/mL (mean±SD) 48.2±192.8 5.2±6.7
Gleason score, n (%)
low grade 29 (11%)
(3+4, 4+3) 202 (75%)
high grade 39 (14%)
Clinical Stage, n (%)
localized 252 (55.1%)
locally advanced 10 (35.7%)
metastatic 8 (8.5%)
unknown 2 (0.7%)
Pathologic Stage, n (%)
Localized (T2) 152 (60.3%)
IBJU | POLYMORPHISMS IN DKK3 GENE AND PROSTATE CANCER RISK AND PROGRESSION
872
lifetime prevalence of 0.02%, given minor allele
frequencies and sample sizes, and assuming a
re-lative risk of 1.5, using PGA (Power for Genetic
Association Analyses) software (19).
RESULTS
The association between DKK3 polymorphisms
and the risk of prostate cancer
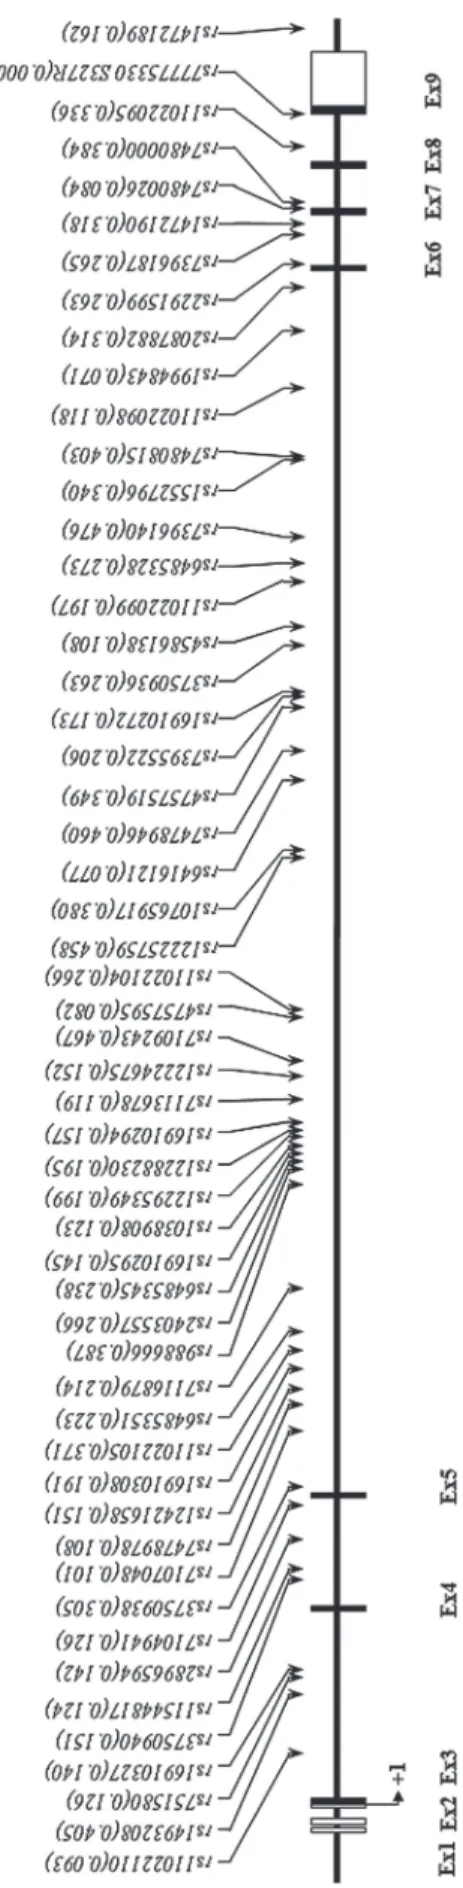
A total of 53 SNPs from the human DKK3
gene in 272 patients with prostate cancer and 173
control subjects were successfully genotyped to
determine the potential association of the gene
with the development of prostate cancer
(Fi-gure-1). The genotype distributions in the
con-trol group were in Hardy-Weinberg equilibrium
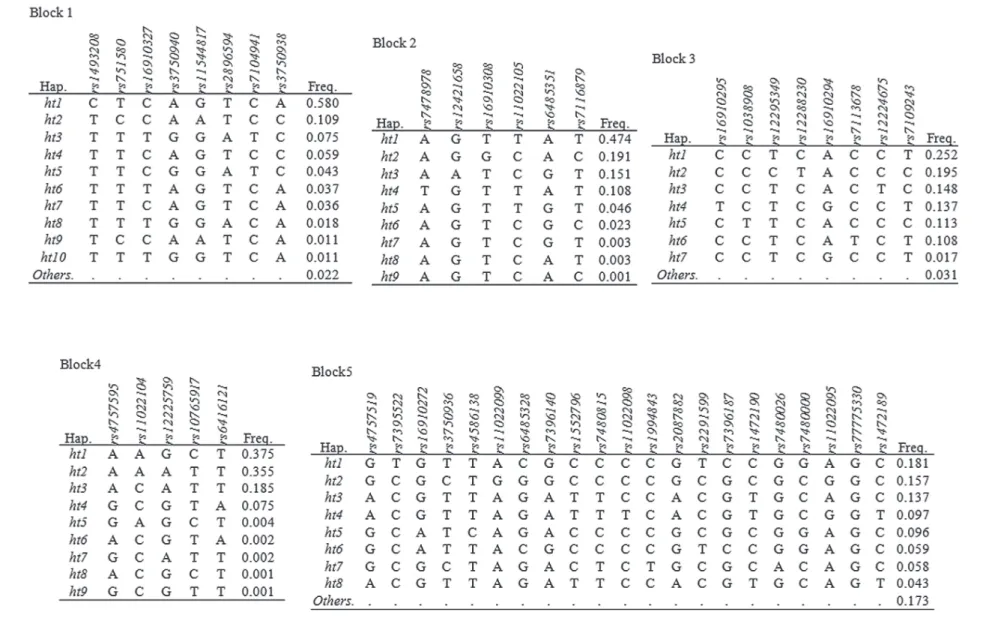
(P>0.05; data not shown). The measured linkage
disequilibrium among 53 SNPs was determined by
calculating Lewontin’s D’ and r
2values; the results
showed that these SNPs were divided among five
haplotype blocks (Figure-2). The allele frequencies
of each of the polymorphisms and common
ha-plotypes were compared between the patients and
the normal controls using logistic regression
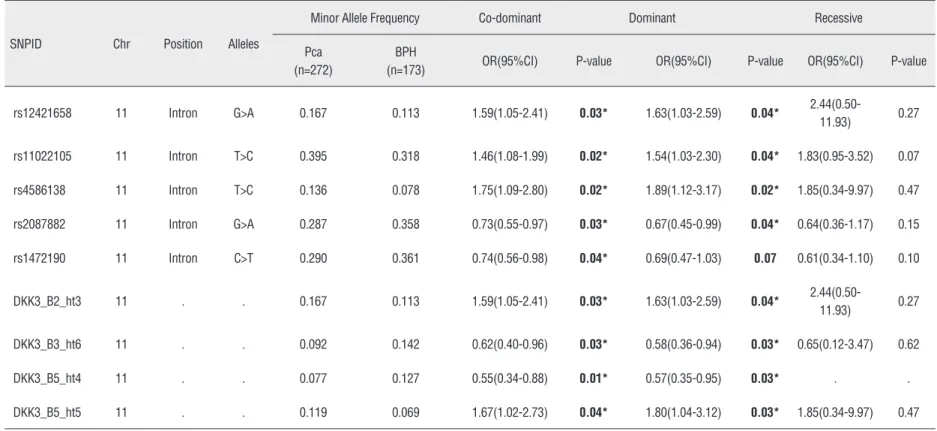
mo-dels. The results of the analysis revealed that five
SNPs showed nominal evidence of an association
at a P<0.05 level of significance (Table-2,
Supple-mentary Table-1). Of the five significantly
asso-ciated SNPs, three (rs12421658, rs11022105, and
rs4586138) showed a greater frequency in patients
with prostate cancer than in the normal controls
(OR 1.63, p=0.04; OR 1.54, p=0.04; and OR 1.89,
p=0.02, respectively). In addition, a haplotype
association test was performed on 25 common
haplotypes (frequency >0.05) within the five
ha-plotype blocks. Two haha-plotypes (Block2_ht3 and
Block5_ht5) showed a marginal association with
the risk of prostate cancer (P=0.04 and P=0.03,
respectively). There were two SNPs (rs2087882
and rs1472190) and two haplotypes (Block3_ht6
and Block5_ht4) that exhibited a significant
pro-tective effect from prostate cancer (Table-2).
The association between DKK3 polymorphisms
and PSA level in prostate cancer group
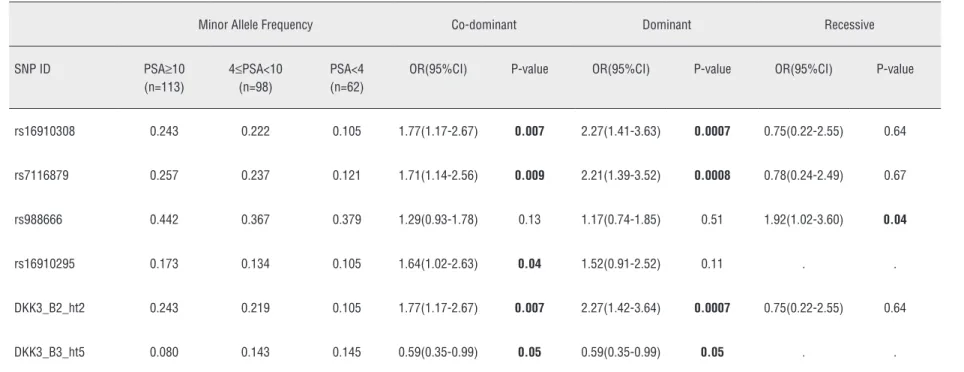
We performed analyses involving only
the patients with prostate cancer. Four SNPs and
two haplotypes exhibited a significant
associa-tion with the PSA levels (Table-3, Supplementary
Table-2). Two SNPs (rs16910308, rs7116879) and
one haplotype (Block2_ht2) had a markedly
sig-nificant effect on elevated PSA levels in the
co--dominant and dominant model (OR 1.77, p=0.007
and OR 2.27, p=0.0007; OR 1.71, p=0.0009 and OR
2.21, p=0.0008; OR 1.77, p=0.007 and OR 2.27,
p=0.0007, respectively). One SNP (rs988666) had a
positive association with PSA in the recessive
mo-del (OR 1.92, p=0.04), the other SNP (rs16910295)
had same result in the co-dominant model (OR
1.64, p=0.04). One haplotype (Block3_ht5) had a
negative association with PSA in the co-dominant
model (OR 0.59, p=0.05) and dominant model (OR
0.59, p=0.05).
The association between DKK3 polymorphisms
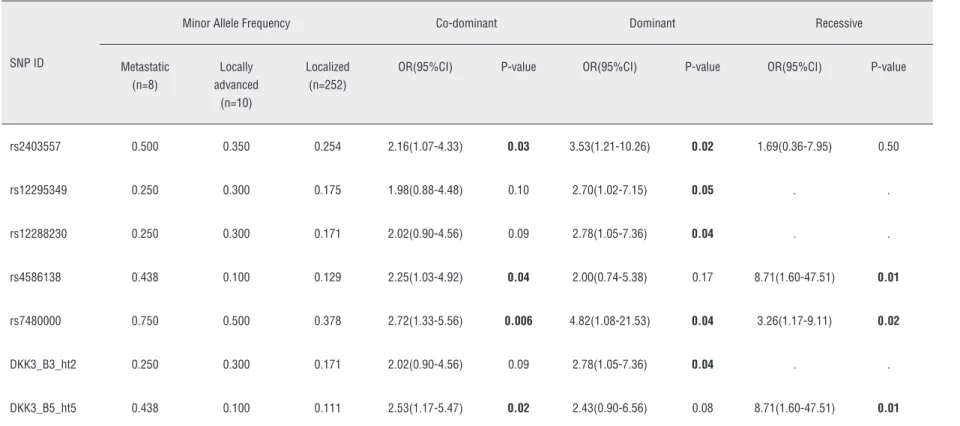
and clinical stage in prostate cancer group
In an analysis according to the clinical
stage criteria, five SNPs (rs2403557, rs12295349,
rs12288230, rs4586138, and rs7480000) were
sig-nificantly correlated with clinical stage in each
model (OR 2.16, p=0.03 in the co-dominant model
and OR 3.53, p=0.02 in the dominant; OR 2.70,
p=0.05 in the dominant model; OR 2.78, p=0.04 in
the dominant model; OR 2.25, p=0.04 in the
co--dominant model and OR 8.71, p=0.01 in the
reces-sive model; OR 2.72, p=0.006 in the co-dominant
and OR 4.82, p=0.04 in the dominant model and
OR 3.26, p=0.02 in the recessive model,
respecti-vely). In addition, two haplotypes (Block3_ht2 and
Block5_ht5) were associated with clinical cancer
stage (OR 2.78, p=0.04 in the dominant model; OR
2.53, p=0.02 in the co-dominant model and OR
8.71, p=0.01 in the recessive, respectively; Table-4,
Supplementary Table-3).
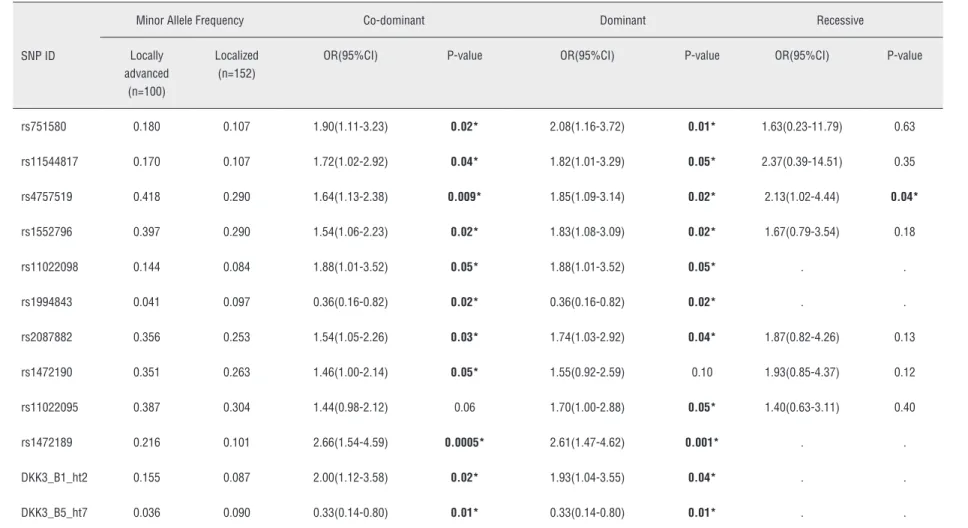
The association between DKK3 polymorphisms
and pathologic stage in prostate cancer group
IBJU | POLYMORPHISMS IN DKK3 GENE AND PROSTATE CANCER RISK AND PROGRESSION
873
IBJU
|
POL
YMORPHISMS IN DKK3 GENE AND PROST
A
TE CANCER RISK AND PROGRESSION
874
Figure 2 - Haplotypes among DKK3 SNPs. A) Haplotypes in DKK3. “Others” category contains rare haplotypes, B) Linkage disequilibrium among DKK3
polymorphisms.
IBJU | POLYMORPHISMS IN DKK3 GENE AND PROSTATE CANCER RISK AND PROGRESSION
875
IBJU
|
POL
YMORPHISMS IN DKK3 GENE AND PROST
A
TE CANCER RISK AND PROGRESSION
876
Table 2 - Logistic regression analysis of DKK3 SNPs with the risk of prostate cancer in Korean Population.
SNPID Chr Position Alleles
Minor Allele Frequency Co-dominant Dominant Recessive
Pca (n=272)
BPH
(n=173) OR(95%CI) P-value OR(95%CI) P-value OR(95%CI) P-value
rs12421658 11 Intron G>A 0.167 0.113 1.59(1.05-2.41) 0.03* 1.63(1.03-2.59) 0.04*
2.44(0.50-11.93) 0.27
rs11022105 11 Intron T>C 0.395 0.318 1.46(1.08-1.99) 0.02* 1.54(1.03-2.30) 0.04* 1.83(0.95-3.52) 0.07
rs4586138 11 Intron T>C 0.136 0.078 1.75(1.09-2.80) 0.02* 1.89(1.12-3.17) 0.02* 1.85(0.34-9.97) 0.47
rs2087882 11 Intron G>A 0.287 0.358 0.73(0.55-0.97) 0.03* 0.67(0.45-0.99) 0.04* 0.64(0.36-1.17) 0.15
rs1472190 11 Intron C>T 0.290 0.361 0.74(0.56-0.98) 0.04* 0.69(0.47-1.03) 0.07 0.61(0.34-1.10) 0.10
DKK3_B2_ht3 11 . . 0.167 0.113 1.59(1.05-2.41) 0.03* 1.63(1.03-2.59) 0.04*
2.44(0.50-11.93) 0.27
DKK3_B3_ht6 11 . . 0.092 0.142 0.62(0.40-0.96) 0.03* 0.58(0.36-0.94) 0.03* 0.65(0.12-3.47) 0.62
DKK3_B5_ht4 11 . . 0.077 0.127 0.55(0.34-0.88) 0.01* 0.57(0.35-0.95) 0.03* . .
DKK3_B5_ht5 11 . . 0.119 0.069 1.67(1.02-2.73) 0.04* 1.80(1.04-3.12) 0.03* 1.85(0.34-9.97) 0.47
IBJU
|
POL
YMORPHISMS IN DKK3 GENE AND PROST
A
TE CANCER RISK AND PROGRESSION
877
Supplementary Table 1 - Logistic regression analysis of DKK3 SNPs with the risk of prostate cancer in Korean Population.
SNPID Chr Position AA
Change Alleles
Minor Allele Frequency Co-dominant Dominant Recessive
Pca (n=272)
BPH
(n=173) OR(95%CI) P-value OR(95%CI) P-value OR(95%CI) P-value
rs11022110 11 Intron . G>A 0.097 0.081 1.26(0.76-2.09) 0.36 1.21(0.72-2.04) 0.48 . .
rs1493208 11 Intron . C>T 0.412 0.395 1.13(0.84-1.54) 0.42 1.31(0.86-2.00) 0.21 0.95(0.54-1.68) 0.86
rs751580 11 Intron . T>C 0.134 0.113 1.34(0.86-2.08) 0.19 1.26(0.79-2.00) 0.34 . .
rs16910327 11 Intron . C>T 0.136 0.156 0.82(0.55-1.22) 0.32 0.85(0.55-1.32) 0.47 0.38(0.08-1.76) 0.21
rs3750940 11 Intron . A>G 0.145 0.162 0.89(0.60-1.32) 0.55 0.90(0.58-1.38) 0.62 0.63(0.13-2.98) 0.56
rs11544817 11 Intron . G>A 0.131 0.113 1.30(0.84-2.01) 0.24 1.20(0.75-1.92) 0.45 . .
rs2896594 11 Intron . T>A 0.140 0.147 0.94(0.63-1.41) 0.76 0.96(0.62-1.49) 0.86 0.65(0.14-3.05) 0.58
rs7104941 11 Intron . C>T 0.126 0.124 1.04(0.68-1.58) 0.87 1.08(0.68-1.72) 0.76 0.71(0.15-3.32) 0.66
rs3750938 11 Intron . A>C 0.315 0.283 1.29(0.93-1.77) 0.13 1.25(0.84-1.87) 0.27 1.87(0.84-4.19) 0.13
rs7107048 11 Intron . C>T 0.101 0.099 1.04(0.67-1.61) 0.88 1.02(0.61-1.69) 0.96 1.29(0.30-5.51) 0.73
rs7478978 11 Intron . A>T 0.110 0.107 1.02(0.65-1.61) 0.94 1.02(0.63-1.65) 0.95 1.09(0.11-10.79) 0.94
rs12421658 11 Intron . G>A 0.167 0.113 1.59(1.05-2.41) 0.03 1.63(1.03-2.59) 0.04 2.44(0.50-11.93) 0.27
rs16910308 11 Intron . T>G 0.205 0.165 1.29(0.89-1.87) 0.18 1.39(0.91-2.11) 0.13 1.02(0.33-3.20) 0.97
rs11022105 11 Intron . T>C 0.395 0.318 1.46(1.08-1.99) 0.02 1.54(1.03-2.30) 0.04 1.83(0.95-3.52) 0.07
rs6485351 11 Intron . A>G 0.222 0.211 1.06(0.76-1.47) 0.74 1.10(0.73-1.65) 0.66 0.98(0.42-2.29) 0.96
rs7116879 11 Intron . T>C 0.220 0.202 1.15(0.81-1.63) 0.44 1.23(0.82-1.84) 0.32 0.88(0.32-2.44) 0.81
rs988666 11 Intron . C>T 0.401 0.387 1.03(0.77-1.39) 0.83 0.90(0.59-1.35) 0.60 1.41(0.78-2.53) 0.25
rs2403557 11 Intron . C>T 0.265 0.257 1.06(0.77-1.44) 0.74 1.07(0.72-1.59) 0.75 1.08(0.52-2.28) 0.83
rs6485345 11 Intron . G>A 0.255 0.214 1.28(0.92-1.79) 0.15 1.39(0.93-2.07) 0.11 1.19(0.50-2.83) 0.69
rs16910295 11 Intron . C>T 0.144 0.145 0.99(0.66-1.49) 0.97 0.97(0.62-1.51) 0.89 1.41(0.24-8.24) 0.70
rs1038908 11 Intron . C>T 0.131 0.107 1.30(0.83-2.06) 0.26 1.42(0.89-2.29) 0.14 . .
rs12295349 11 Intron . T>C 0.182 0.211 0.82(0.58-1.16) 0.26 0.88(0.58-1.33) 0.54 0.41(0.15-1.14) 0.09
IBJU
|
POL
YMORPHISMS IN DKK3 GENE AND PROST
A
TE CANCER RISK AND PROGRESSION
878
rs16910294 11 Intron . A>G 0.164 0.145 1.14(0.77-1.70) 0.51 1.06(0.69-1.64) 0.79 4.73(0.57-39.47) 0.15
rs7113678 11 Intron . C>T 0.105 0.147 0.68(0.44-1.04) 0.07 0.65(0.41-1.03) 0.07 0.65(0.12-3.47) 0.62
rs12224675 11 Intron . C>T 0.164 0.142 1.20(0.82-1.76) 0.36 1.24(0.80-1.94) 0.33 1.18(0.36-3.90) 0.78
rs7109243 11 Intron . T>C 0.469 0.457 1.04(0.79-1.38) 0.77 1.06(0.69-1.63) 0.80 1.06(0.66-1.71) 0.81
rs4757595 11 Intron . A>G 0.086 0.078 1.07(0.64-1.81) 0.79 1.12(0.66-1.91) 0.68 . .
rs11022104 11 Intron . A>C 0.254 0.266 0.93(0.68-1.28) 0.65 0.95(0.64-1.41) 0.79 0.80(0.37-1.72) 0.56
rs12225759 11 Intron . A>G 0.461 0.465 0.97(0.73-1.29) 0.82 1.22(0.79-1.89) 0.38 0.71(0.44-1.16) 0.17
rs10765917 11 Intron . T>C 0.378 0.393 0.93(0.69-1.25) 0.63 0.94(0.62-1.41) 0.75 0.87(0.49-1.53) 0.62
rs6416121 11 Intron . T>A 0.083 0.069 1.15(0.67-1.98) 0.61 1.21(0.69-2.12) 0.50 . .
rs7478946 11 Intron . T>C 0.454 0.460 0.99(0.75-1.32) 0.97 1.23(0.80-1.90) 0.35 0.75(0.46-1.23) 0.25
rs4757519 11 Intron . G>A 0.331 0.384 0.80(0.61-1.06) 0.12 0.74(0.49-1.10) 0.14 0.76(0.44-1.30) 0.31
rs7395522 11 Intron . C>T 0.193 0.211 0.92(0.66-1.29) 0.63 0.91(0.60-1.37) 0.65 0.89(0.35-2.21) 0.79
rs16910272 11 Intron . G>A 0.189 0.159 1.18(0.83-1.69) 0.35 1.28(0.83-1.97) 0.27 1.04(0.40-2.70) 0.93
rs3750936 11 Intron . T>C 0.279 0.240 1.24(0.89-1.72) 0.20 1.35(0.91-2.01) 0.13 1.05(0.45-2.43) 0.91
rs4586138 11 Intron . T>C 0.136 0.078 1.75(1.09-2.80) 0.02 1.89(1.12-3.17) 0.02 1.85(0.34-9.97) 0.47
rs11022099 11 Intron . A>G 0.211 0.174 1.30(0.90-1.86) 0.16 1.48(0.97-2.25) 0.07 0.76(0.27-2.13) 0.60
rs6485328 11 Intron . G>C 0.248 0.295 0.82(0.60-1.11) 0.19 0.75(0.50-1.11) 0.15 0.85(0.42-1.74) 0.66
rs7396140 11 Intron . A>G 0.461 0.477 0.98(0.75-1.27) 0.86 0.91(0.59-1.40) 0.67 1.03(0.66-1.63) 0.89
rs1552796 11 Intron . C>T 0.322 0.373 0.81(0.61-1.07) 0.14 0.76(0.51-1.13) 0.17 0.74(0.42-1.30) 0.30
rs7480815 11 Intron . C>T 0.389 0.434 0.83(0.63-1.09) 0.18 0.78(0.52-1.18) 0.25 0.77(0.47-1.26) 0.30
rs11022098 11 Intron . C>T 0.104 0.142 0.68(0.43-1.05) 0.08 0.73(0.46-1.18) 0.20 . .
rs1994843 11 Intron . C>T 0.072 0.072 0.94(0.54-1.62) 0.81 0.98(0.56-1.71) 0.93 . .
rs2087882 11 Intron . G>A 0.287 0.358 0.73(0.55-0.97) 0.03 0.67(0.45-0.99) 0.04 0.64(0.36-1.17) 0.15
rs2291599 11 Intron . C>T 0.237 0.292 0.79(0.58-1.07) 0.13 0.72(0.49-1.08) 0.11 0.79(0.38-1.63) 0.52
rs7396187 11 Intron . G>C 0.241 0.292 0.80(0.59-1.09) 0.16 0.72(0.49-1.08) 0.11 0.86(0.42-1.76) 0.69
rs1472190 11 Intron . C>T 0.290 0.361 0.74(0.56-0.98) 0.04 0.69(0.47-1.03) 0.07 0.61(0.34-1.10) 0.10
rs7480026 11 Intron . G>A 0.086 0.081 1.06(0.64-1.77) 0.81 1.07(0.63-1.83) 0.80 0.91(0.06-14.97) 0.95
rs7480000 11 Intron . C>G 0.391 0.370 1.09(0.83-1.45) 0.54 1.22(0.81-1.82) 0.34 0.97(0.57-1.68) 0.92
IBJU
|
POL
YMORPHISMS IN DKK3 GENE AND PROST
A
TE CANCER RISK AND PROGRESSION
879
rs1472189 11 3'flanking . C>T 0.143 0.191 0.71(0.49-1.02) 0.07 0.76(0.50-1.17) 0.21 0.24(0.07-0.82) 0.02
DKK3_B1_ht1 11 . . . 0.426 0.413 1.10(0.82-1.49) 0.52 1.16(0.76-1.78) 0.49 1.09(0.62-1.89) 0.77
DKK3_B1_ht2 11 . . . 0.114 0.098 1.32(0.83-2.11) 0.25 1.26(0.77-2.05) 0.36 . .
DKK3_B1_ht3 11 . . . 0.077 0.072 1.09(0.64-1.88) 0.75 1.15(0.66-2.02) 0.62 . .
DKK3_B1_ht4 11 . . . 0.063 0.052 1.27(0.69-2.34) 0.45 1.24(0.66-2.32) 0.51 . .
DKK3_B2_ht1 11 . . . 0.458 0.514 0.81(0.61-1.08) 0.15 0.79(0.50-1.25) 0.31 0.73(0.45-1.17) 0.19
DKK3_B2_ht2 11 . . . 0.204 0.165 1.28(0.89-1.85) 0.19 1.38(0.90-2.09) 0.14 1.02(0.33-3.18) 0.98
DKK3_B2_ht3 11 . . . 0.167 0.113 1.59(1.05-2.41) 0.03 1.63(1.03-2.59) 0.04 2.44(0.50-11.93) 0.27
DKK3_B2_ht4 11 . . . 0.110 0.107 1.02(0.65-1.61) 0.94 1.02(0.63-1.65) 0.95 1.09(0.11-10.79) 0.94
DKK3_B3_ht1 11 . . . 0.259 0.243 1.09(0.80-1.48) 0.60 1.12(0.75-1.66) 0.59 1.10(0.54-2.27) 0.79
DKK3_B3_ht2 11 . . . 0.178 0.205 0.82(0.58-1.17) 0.28 0.89(0.59-1.34) 0.57 0.41(0.15-1.14) 0.09
DKK3_B3_ht3 11 . . . 0.158 0.142 1.15(0.78-1.68) 0.48 1.18(0.75-1.84) 0.47 1.17(0.36-3.87) 0.79
DKK3_B3_ht4 11 . . . 0.134 0.139 0.96(0.63-1.47) 0.86 0.91(0.58-1.43) 0.69 2.81(0.29-27.01) 0.37
DKK3_B3_ht5 11 . . . 0.118 0.101 1.22(0.76-1.94) 0.41 1.33(0.82-2.16) 0.25 . .
DKK3_B3_ht6 11 . . . 0.092 0.142 0.62(0.40-0.96) 0.03 0.58(0.36-0.94) 0.03 0.65(0.12-3.47) 0.62
DKK3_B4_ht1 11 . . . 0.373 0.387 0.94(0.70-1.25) 0.66 0.97(0.65-1.46) 0.88 0.83(0.47-1.46) 0.51
DKK3_B4_ht2 11 . . . 0.369 0.341 1.15(0.86-1.52) 0.35 1.41(0.95-2.10) 0.09 0.85(0.48-1.50) 0.57
DKK3_B4_ht3 11 . . . 0.167 0.191 0.86(0.60-1.23) 0.40 0.89(0.58-1.35) 0.58 0.55(0.19-1.59) 0.27
DKK3_B4_ht4 11 . . . 0.081 0.066 1.19(0.69-2.05) 0.54 1.25(0.71-2.21) 0.44 . .
DKK3_B5_ht1 11 . . . 0.165 0.188 0.90(0.64-1.29) 0.57 0.89(0.58-1.35) 0.57 0.88(0.33-2.34) 0.79
DKK3_B5_ht2 11 . . . 0.162 0.150 1.12(0.76-1.65) 0.56 1.16(0.75-1.79) 0.52 1.03(0.29-3.70) 0.97
DKK3_B5_ht3 11 . . . 0.129 0.150 0.83(0.57-1.21) 0.34 0.81(0.52-1.28) 0.37 0.72(0.24-2.16) 0.55
DKK3_B5_ht4 11 . . . 0.077 0.127 0.55(0.34-0.88) 0.01 0.57(0.35-0.95) 0.03 . .
DKK3_B5_ht5 11 . . . 0.119 0.069 1.67(1.02-2.73) 0.04 1.80(1.04-3.12) 0.03 1.85(0.34-9.97) 0.47
DKK3_B5_ht6 11 . . . 0.050 0.075 0.66(0.37-1.17) 0.16 0.64(0.35-1.17) 0.15 0.71(0.04-13.18) 0.82
DKK3_B5_ht7 11 . . . 0.063 0.055 1.10(0.59-2.02) 0.77 1.10(0.59-2.02) 0.77 . .
Minor allele frequencies and P-values for logistic analyses of three alternative models (co-dominant, dominant and recessive models) controlling for age as covariate are shown.Significant associations are shown in boldface (P-value≤ 0.05).
IBJU
|
POL
YMORPHISMS IN DKK3 GENE AND PROST
A
TE CANCER RISK AND PROGRESSION
880
Table 3 - Logistic analysis of DKK3 polymorphisms according to PSA criteria.
Minor Allele Frequency Co-dominant Dominant Recessive
SNP ID PSA≥10
(n=113)
4≤PSA<10 (n=98)
PSA<4 (n=62)
OR(95%CI) P-value OR(95%CI) P-value OR(95%CI) P-value
rs16910308 0.243 0.222 0.105 1.77(1.17-2.67) 0.007 2.27(1.41-3.63) 0.0007 0.75(0.22-2.55) 0.64
rs7116879 0.257 0.237 0.121 1.71(1.14-2.56) 0.009 2.21(1.39-3.52) 0.0008 0.78(0.24-2.49) 0.67
rs988666 0.442 0.367 0.379 1.29(0.93-1.78) 0.13 1.17(0.74-1.85) 0.51 1.92(1.02-3.60) 0.04
rs16910295 0.173 0.134 0.105 1.64(1.02-2.63) 0.04 1.52(0.91-2.52) 0.11 . .
DKK3_B2_ht2 0.243 0.219 0.105 1.77(1.17-2.67) 0.007 2.27(1.42-3.64) 0.0007 0.75(0.22-2.55) 0.64
DKK3_B3_ht5 0.080 0.143 0.145 0.59(0.35-0.99) 0.05 0.59(0.35-0.99) 0.05 . .
IBJU
|
POL
YMORPHISMS IN DKK3 GENE AND PROST
A
TE CANCER RISK AND PROGRESSION
8
81
Supplementary Table 2 - Logistic analysis of DKK3 polymorphisms according to PSA criteria.
Minor Allele Frequency Co-dominant Dominant Recessive
SNP ID PSA≥10
(n=113)
4≤PSA<10 (n=98)
PSA<4
(n=62) OR(95%CI) P-value OR(95%CI) P-value OR(95%CI) P-value
rs11022110 0.097 0.102 0.089 1.05(0.62-1.79) 0.86 1.14(0.64-2.01) 0.65 0.26(0.02-4.04) 0.33
rs1493208 0.394 0.459 0.371 1.01(0.72-1.43) 0.94 1.17(0.73-1.89) 0.51 0.81(0.43-1.52) 0.50
rs751580 0.115 0.158 0.129 0.89(0.56-1.41) 0.62 0.85(0.51-1.41) 0.52 1.27(0.24-6.67) 0.78
rs16910327 0.146 0.143 0.113 1.18(0.73-1.89) 0.50 1.14(0.69-1.89) 0.60 2.71(0.23-31.39) 0.43
rs3750940 0.155 0.168 0.097 1.25(0.79-1.97) 0.35 1.31(0.80-2.15) 0.29 0.98(0.15-6.19) 0.98
rs11544817 0.119 0.143 0.129 0.95(0.60-1.49) 0.81 0.88(0.52-1.47) 0.62 1.70(0.36-8.02) 0.50
rs2896594 0.155 0.158 0.089 1.32(0.83-2.11) 0.24 1.41(0.85-2.33) 0.19 1.03(0.16-6.56) 0.97
rs7104941 0.142 0.141 0.073 1.39(0.85-2.25) 0.19 1.58(0.93-2.70) 0.09 0.74(0.12-4.62) 0.75
rs3750938 0.292 0.361 0.282 0.97(0.69-1.36) 0.85 1.12(0.72-1.75) 0.62 0.62(0.29-1.33) 0.21
rs7107048 0.111 0.102 0.089 1.13(0.69-1.85) 0.63 1.24(0.70-2.20) 0.47 0.76(0.17-3.42) 0.72
rs7478978 0.124 0.102 0.097 1.25(0.75-2.07) 0.40 1.36(0.78-2.35) 0.28 0.41(0.05-3.44) 0.41
rs12421658 0.137 0.168 0.218 0.70(0.46-1.06) 0.10 0.75(0.46-1.21) 0.24 0.27(0.07-1.02) 0.05
rs16910308 0.243 0.222 0.105 1.77(1.17-2.67) 0.007 2.27(1.41-3.63) 0.0007 0.75(0.22-2.55) 0.64
rs11022105 0.398 0.418 0.347 1.16(0.83-1.63) 0.38 1.23(0.77-1.96) 0.38 1.19(0.62-2.27) 0.61
rs6485351 0.186 0.230 0.274 0.73(0.51-1.06) 0.10 0.75(0.47-1.18) 0.21 0.45(0.17-1.19) 0.11
rs7116879 0.257 0.237 0.121 1.71(1.14-2.56) 0.009 2.21(1.39-3.52) 0.0008 0.78(0.24-2.49) 0.67
rs988666 0.442 0.367 0.379 1.29(0.93-1.78) 0.13 1.17(0.74-1.85) 0.51 1.92(1.02-3.60) 0.04
rs2403557 0.286 0.253 0.242 1.19(0.84-1.69) 0.33 1.23(0.79-1.93) 0.36 1.31(0.57-3.03) 0.53
IBJU
|
POL
YMORPHISMS IN DKK3 GENE AND PROST
A
TE CANCER RISK AND PROGRESSION
882
rs16910295 0.173 0.134 0.105 1.64(1.02-2.63) 0.04 1.52(0.91-2.52) 0.11 . .
rs1038908 0.097 0.158 0.145 0.70(0.42-1.16) 0.17 0.70(0.42-1.16) 0.17 . .
rs12295349 0.177 0.194 0.169 1.03(0.68-1.57) 0.88 1.15(0.72-1.83) 0.57 0.55(0.14-2.23) 0.40
rs12288230 0.177 0.189 0.161 1.07(0.71-1.63) 0.74 1.21(0.75-1.93) 0.44 0.55(0.14-2.23) 0.40
rs16910294 0.190 0.143 0.145 1.39(0.91-2.14) 0.13 1.43(0.88-2.34) 0.15 1.79(0.45-7.05) 0.41
rs7113678 0.102 0.107 0.105 0.90(0.54-1.50) 0.68 0.84(0.48-1.46) 0.53 2.31(0.20-26.72) 0.50
rs12224675 0.183 0.128 0.185 1.02(0.67-1.56) 0.92 1.03(0.63-1.68) 0.91 0.99(0.26-3.74) 0.99
rs7109243 0.438 0.474 0.508 0.82(0.60-1.13) 0.22 0.72(0.44-1.18) 0.20 0.83(0.49-1.40) 0.48
rs4757595 0.058 0.102 0.113 0.58(0.32-1.04) 0.07 0.58(0.32-1.04) 0.07 . .
rs11022104 0.230 0.281 0.250 0.93(0.65-1.34) 0.69 1.07(0.69-1.68) 0.76 0.53(0.21-1.32) 0.17
rs12225759 0.442 0.459 0.492 0.85(0.60-1.19) 0.33 0.76(0.46-1.26) 0.28 0.88(0.50-1.56) 0.67
rs10765917 0.385 0.357 0.393 0.98(0.70-1.36) 0.90 0.90(0.57-1.42) 0.65 1.15(0.60-2.23) 0.68
rs6416121 0.058 0.102 0.097 0.66(0.37-1.20) 0.17 0.66(0.37-1.20) 0.17 . .
rs7478946 0.469 0.454 0.435 1.17(0.83-1.63) 0.37 1.07(0.65-1.77) 0.79 1.45(0.81-2.60) 0.22
rs4757519 0.336 0.311 0.363 0.94(0.69-1.28) 0.69 0.83(0.53-1.30) 0.42 1.11(0.58-2.11) 0.75
rs7395522 0.177 0.235 0.153 1.05(0.71-1.55) 0.80 1.13(0.71-1.81) 0.60 0.81(0.28-2.39) 0.71
rs16910272 0.230 0.148 0.177 1.34(0.90-1.99) 0.15 1.43(0.89-2.30) 0.14 1.40(0.46-4.22) 0.55
rs3750936 0.257 0.296 0.290 0.87(0.60-1.25) 0.44 0.89(0.57-1.39) 0.61 0.65(0.26-1.65) 0.36
rs4586138 0.155 0.102 0.153 1.08(0.69-1.70) 0.73 1.02(0.61-1.69) 0.95 2.29(0.44-12.06) 0.33
rs11022099 0.212 0.209 0.208 1.04(0.70-1.55) 0.86 1.08(0.69-1.71) 0.74 0.81(0.24-2.78) 0.74
rs6485328 0.248 0.281 0.194 1.15(0.81-1.63) 0.43 1.32(0.84-2.08) 0.22 0.90(0.39-2.06) 0.80
IBJU
|
POL
YMORPHISMS IN DKK3 GENE AND PROST
A
TE CANCER RISK AND PROGRESSION
883
rs1552796 0.332 0.296 0.355 0.98(0.71-1.34) 0.88 0.85(0.54-1.32) 0.47 1.30(0.67-2.54) 0.44
rs7480815 0.385 0.388 0.410 0.93(0.69-1.26) 0.64 0.79(0.50-1.25) 0.32 1.12(0.63-1.99) 0.71
rs11022098 0.106 0.094 0.113 0.89(0.51-1.55) 0.67 0.89(0.51-1.55) 0.67 . .
rs1994843 0.053 0.102 0.056 0.77(0.41-1.45) 0.42 0.77(0.41-1.45) 0.42 . .
rs2087882 0.301 0.247 0.336 0.96(0.69-1.33) 0.80 0.87(0.56-1.36) 0.54 1.17(0.57-2.41) 0.67
rs2291599 0.243 0.270 0.169 1.25(0.88-1.79) 0.22 1.53(0.97-2.41) 0.07 0.86(0.36-2.05) 0.74
rs7396187 0.243 0.276 0.177 1.21(0.85-1.71) 0.29 1.53(0.97-2.41) 0.07 0.75(0.33-1.71) 0.49
rs1472190 0.301 0.255 0.339 0.96(0.69-1.33) 0.78 0.85(0.55-1.33) 0.48 1.22(0.59-2.51) 0.59
rs7480026 0.066 0.122 0.065 0.84(0.48-1.49) 0.55 0.85(0.47-1.52) 0.57 0.55(0.02-20.49) 0.75
rs7480000 0.407 0.398 0.344 1.17(0.85-1.61) 0.33 1.24(0.79-1.96) 0.36 1.22(0.66-2.25) 0.52
rs11022095 0.350 0.320 0.344 1.04(0.74-1.45) 0.84 1.06(0.68-1.65) 0.81 1.01(0.50-2.05) 0.98
rs1472189 0.150 0.115 0.169 0.96(0.60-1.51) 0.85 0.89(0.54-1.47) 0.66 1.96(0.28-13.53) 0.50
DKK3_B1_ht1 0.420 0.469 0.371 1.11(0.80-1.55) 0.54 1.23(0.76-1.98) 0.40 1.03(0.56-1.90) 0.92
DKK3_B1_ht2 0.102 0.122 0.121 0.87(0.53-1.44) 0.59 0.91(0.53-1.55) 0.72 0.43(0.05-3.68) 0.44
DKK3_B1_ht3 0.075 0.087 0.065 1.02(0.55-1.88) 0.95 1.02(0.55-1.88) 0.95 . .
DKK3_B1_ht4 0.035 0.077 0.089 0.52(0.27-1.00) 0.05 0.54(0.27-1.06) 0.07 . .
DKK3_B2_ht1 0.447 0.439 0.516 0.82(0.59-1.14) 0.24 0.73(0.44-1.21) 0.22 0.83(0.47-1.46) 0.51
DKK3_B2_ht2 0.243 0.219 0.105 1.77(1.17-2.67) 0.007 2.27(1.42-3.64) 0.0007 0.75(0.22-2.55) 0.64
DKK3_B2_ht3 0.137 0.168 0.218 0.70(0.46-1.06) 0.10 0.75(0.46-1.21) 0.24 0.27(0.07-1.02) 0.05
DKK3_B2_ht4 0.124 0.102 0.097 1.25(0.75-2.07) 0.40 1.36(0.78-2.35) 0.28 0.41(0.05-3.44) 0.41
DKK3_B3_ht1 0.274 0.265 0.234 1.13(0.81-1.59) 0.46 1.13(0.72-1.76) 0.60 1.35(0.62-2.94) 0.45
IBJU
|
POL
YMORPHISMS IN DKK3 GENE AND PROST
A
TE CANCER RISK AND PROGRESSION
884
DKK3_B3_ht3 0.173 0.122 0.185 0.96(0.63-1.47) 0.84 0.94(0.58-1.55) 0.82 0.99(0.26-3.71) 0.98
DKK3_B3_ht4 0.159 0.122 0.105 1.54(0.96-2.50) 0.08 1.41(0.84-2.37) 0.19 . .
DKK3_B3_ht5 0.080 0.143 0.145 0.59(0.35-0.99) 0.05 0.59(0.35-0.99) 0.05 . .
DKK3_B3_ht6 0.084 0.092 0.105 0.76(0.44-1.29) 0.31 0.67(0.37-1.21) 0.19 2.31(0.20-26.72) 0.50
DKK3_B4_ht1 0.381 0.357 0.379 1.00(0.72-1.40) 0.99 0.97(0.61-1.52) 0.88 1.09(0.56-2.12) 0.80
DKK3_B4_ht2 0.389 0.362 0.355 1.11(0.80-1.54) 0.54 1.13(0.72-1.79) 0.59 1.17(0.61-2.26) 0.64
DKK3_B4_ht3 0.164 0.179 0.153 1.06(0.69-1.61) 0.80 1.18(0.73-1.92) 0.49 0.55(0.14-2.23) 0.40
DKK3_B4_ht4 0.053 0.102 0.097 0.63(0.34-1.14) 0.13 0.63(0.34-1.14) 0.13 . .
DKK3_B5_ht1 0.164 0.199 0.113 1.21(0.80-1.83) 0.36 1.36(0.83-2.21) 0.22 0.92(0.28-2.98) 0.88
DKK3_B5_ht2 0.168 0.158 0.153 1.13(0.74-1.73) 0.58 1.18(0.73-1.92) 0.50 0.90(0.22-3.61) 0.88
DKK3_B5_ht3 0.137 0.117 0.145 1.01(0.66-1.56) 0.96 0.96(0.57-1.62) 0.88 1.29(0.37-4.52) 0.69
DKK3_B5_ht4 0.080 0.061 0.097 0.83(0.45-1.53) 0.54 0.83(0.45-1.53) 0.54 . .
DKK3_B5_ht5 0.137 0.092 0.129 1.10(0.69-1.76) 0.69 1.03(0.60-1.77) 0.91 2.29(0.44-12.06) 0.33
DKK3_B5_ht6 0.053 0.051 0.040 1.19(0.58-2.44) 0.63 1.24(0.58-2.65) 0.58 0.84(0.02-31.30) 0.92
DKK3_B5_ht7 0.049 0.087 0.048 0.83(0.42-1.61) 0.57 0.83(0.42-1.61) 0.57 . .
IBJU
|
POL
YMORPHISMS IN DKK3 GENE AND PROST
A
TE CANCER RISK AND PROGRESSION
885
Table 4 - Logistic analysis of DKK3 polymorphisms according to clinical stage criteria.
SNP ID
Minor Allele Frequency Co-dominant Dominant Recessive
Metastatic (n=8)
Locally advanced
(n=10)
Localized (n=252)
OR(95%CI) P-value OR(95%CI) P-value OR(95%CI) P-value
rs2403557 0.500 0.350 0.254 2.16(1.07-4.33) 0.03 3.53(1.21-10.26) 0.02 1.69(0.36-7.95) 0.50
rs12295349 0.250 0.300 0.175 1.98(0.88-4.48) 0.10 2.70(1.02-7.15) 0.05 . .
rs12288230 0.250 0.300 0.171 2.02(0.90-4.56) 0.09 2.78(1.05-7.36) 0.04 . .
rs4586138 0.438 0.100 0.129 2.25(1.03-4.92) 0.04 2.00(0.74-5.38) 0.17 8.71(1.60-47.51) 0.01
rs7480000 0.750 0.500 0.378 2.72(1.33-5.56) 0.006 4.82(1.08-21.53) 0.04 3.26(1.17-9.11) 0.02
DKK3_B3_ht2 0.250 0.300 0.171 2.02(0.90-4.56) 0.09 2.78(1.05-7.36) 0.04 . .
DKK3_B5_ht5 0.438 0.100 0.111 2.53(1.17-5.47) 0.02 2.43(0.90-6.56) 0.08 8.71(1.60-47.51) 0.01
IBJU
|
POL
YMORPHISMS IN DKK3 GENE AND PROST
A
TE CANCER RISK AND PROGRESSION
886
Supplementary Table 3 - Logistic analysis of DKK3 polymorphisms according to clinical stage criteria.
Minor Allele Frequency Co-dominant Dominant Recessive
SNP ID Metastatic
(n=8)
Locally advanced
(n=10)
Localized (n=252)
OR(95%CI) P-value OR(95%CI) P-value OR(95%CI) P-value
rs11022110 0.188 0.000 0.097 0.90(0.26-3.05) 0.86 0.92(0.26-3.28) 0.90 . .
rs1493208 0.375 0.600 0.405 1.58(0.76-3.28) 0.22 2.61(0.73-9.33) 0.14 1.24(0.33-4.59) 0.75
rs751580 0.063 0.250 0.133 1.35(0.53-3.46) 0.53 1.55(0.55-4.35) 0.41 . .
rs16910327 0.063 0.250 0.133 1.29(0.50-3.32) 0.60 1.11(0.38-3.26) 0.85 4.70(0.37-59.48) 0.23
rs3750940 0.125 0.100 0.145 0.73(0.25-2.14) 0.56 0.76(0.24-2.39) 0.64 . .
rs11544817 0.063 0.250 0.129 1.38(0.55-3.45) 0.49 1.67(0.59-4.69) 0.34 . .
rs2896594 0.125 0.100 0.139 0.75(0.25-2.22) 0.60 0.79(0.25-2.48) 0.68 . .
rs7104941 0.063 0.100 0.126 0.60(0.17-2.06) 0.42 0.61(0.17-2.20) 0.45 . .
rs3750938 0.313 0.400 0.311 1.30(0.62-2.71) 0.48 1.39(0.52-3.70) 0.51 1.41(0.30-6.67) 0.66
rs7107048 0.000 0.050 0.103 0.27(0.04-1.96) 0.19 0.25(0.03-1.99) 0.19 . .
rs7478978 0.000 0.050 0.113 0.21(0.03-1.59) 0.13 0.20(0.03-1.58) 0.13 . .
rs12421658 0.125 0.250 0.167 1.26(0.53-2.99) 0.60 1.56(0.57-4.21) 0.39 . .
rs16910308 0.188 0.250 0.203 1.13(0.49-2.60) 0.78 1.08(0.40-2.88) 0.88 1.63(0.18-14.46) 0.66
rs11022105 0.313 0.500 0.394 1.14(0.56-2.36) 0.71 0.87(0.32-2.35) 0.79 1.90(0.58-6.29) 0.29
rs6485351 0.125 0.400 0.220 1.39(0.66-2.96) 0.39 1.70(0.64-4.49) 0.29 0.99(0.12-8.31) 1.00
rs7116879 0.188 0.250 0.219 1.03(0.44-2.41) 0.94 0.97(0.36-2.59) 0.95 1.54(0.18-13.52) 0.70
rs988666 0.563 0.400 0.397 1.38(0.70-2.74) 0.35 2.00(0.64-6.28) 0.23 1.10(0.31-3.91) 0.88
rs2403557 0.500 0.350 0.254 2.16(1.07-4.33) 0.03 3.53(1.21-10.26) 0.02 1.69(0.36-7.95) 0.50
rs6485345 0.438 0.150 0.253 1.18(0.54-2.59) 0.67 1.25(0.48-3.26) 0.65 1.13(0.14-9.04) 0.91
rs16910295 0.063 0.250 0.143 1.21(0.47-3.12) 0.69 1.35(0.48-3.80) 0.57 . .
rs1038908 0.063 0.050 0.135 0.38(0.08-1.72) 0.21 0.38(0.08-1.72) 0.21 . .
rs12295349 0.250 0.300 0.175 1.98(0.88-4.48) 0.10 2.70(1.02-7.15) 0.05 . .
rs12288230 0.250 0.300 0.171 2.02(0.90-4.56) 0.09 2.78(1.05-7.36) 0.04 . .
rs16910294 0.063 0.250 0.165 1.02(0.42-2.52) 0.96 1.20(0.43-3.37) 0.72 . .
rs7113678 0.000 0.150 0.105 0.67(0.20-2.29) 0.53 0.71(0.19-2.60) 0.60 . .
rs12224675 0.500 0.050 0.159 1.69(0.77-3.73) 0.19 1.92(0.73-5.08) 0.19 1.80(0.22-15.05) 0.59
rs7109243 0.813 0.400 0.460 1.70(0.85-3.37) 0.13 2.13(0.59-7.68) 0.25 1.94(0.70-5.37) 0.20
IBJU
|
POL
YMORPHISMS IN DKK3 GENE AND PROST
A
TE CANCER RISK AND PROGRESSION
887
rs11022104 0.188 0.300 0.252 1.05(0.47-2.35) 0.91 1.32(0.51-3.46) 0.57 . .
rs12225759 0.188 0.450 0.470 0.50(0.23-1.07) 0.07 0.39(0.15-1.02) 0.06 0.52(0.11-2.37) 0.39
rs10765917 0.188 0.450 0.382 0.74(0.36-1.55) 0.43 0.68(0.26-1.79) 0.43 0.70(0.15-3.30) 0.65
rs6416121 0.000 0.000 0.087 . . . .
rs7478946 0.563 0.550 0.446 1.78(0.86-3.70) 0.12 3.64(0.80-16.54) 0.10 1.45(0.45-4.67) 0.53
rs4757519 0.313 0.350 0.329 0.99(0.50-1.95) 0.97 0.88(0.34-2.29) 0.78 1.24(0.34-4.54) 0.75
rs7395522 0.188 0.300 0.190 1.47(0.67-3.22) 0.34 2.05(0.78-5.40) 0.15 . .
rs16910272 0.500 0.100 0.185 1.64(0.78-3.45) 0.19 1.59(0.60-4.21) 0.35 3.09(0.65-14.68) 0.16
rs3750936 0.000 0.250 0.288 0.37(0.14-1.01) 0.05 0.37(0.13-1.07) 0.07 . .
rs4586138 0.438 0.100 0.129 2.25(1.03-4.92) 0.04 2.00(0.74-5.38) 0.17 8.71(1.60-47.51) 0.01
rs11022099 0.000 0.250 0.216 0.56(0.20-1.53) 0.26 0.58(0.20-1.68) 0.31 . .
rs6485328 0.250 0.300 0.248 1.16(0.56-2.42) 0.69 1.37(0.52-3.58) 0.52 0.75(0.10-5.73) 0.78
rs7396140 0.250 0.550 0.466 0.86(0.45-1.64) 0.65 0.76(0.28-2.03) 0.58 0.89(0.28-2.82) 0.84
rs1552796 0.313 0.350 0.319 1.06(0.53-2.13) 0.87 0.92(0.35-2.39) 0.86 1.52(0.41-5.66) 0.53
rs7480815 0.313 0.350 0.390 0.79(0.39-1.58) 0.50 0.62(0.24-1.63) 0.33 0.99(0.27-3.59) 0.98
rs11022098 0.063 0.150 0.100 1.00(0.31-3.22) 1.00 1.00(0.31-3.22) 1.00 . .
rs1994843 0.000 0.000 0.075 . . . .
rs2087882 0.250 0.200 0.292 0.71(0.32-1.55) 0.39 0.69(0.26-1.83) 0.45 0.51(0.07-3.91) 0.51
rs2291599 0.313 0.300 0.234 1.47(0.71-3.02) 0.30 1.90(0.72-5.01) 0.19 0.91(0.12-6.95) 0.92
rs7396187 0.250 0.300 0.240 1.23(0.59-2.56) 0.58 1.48(0.57-3.87) 0.42 0.80(0.11-6.14) 0.83
rs1472190 0.250 0.200 0.296 0.71(0.32-1.55) 0.39 0.68(0.25-1.81) 0.44 0.52(0.07-4.03) 0.53
rs7480026 0.000 0.000 0.091 . . . .
rs7480000 0.750 0.500 0.378 2.72(1.33-5.56) 0.006 4.82(1.08-21.53) 0.04 3.26(1.17-9.11) 0.02
rs11022095 0.125 0.450 0.340 0.81(0.38-1.71) 0.58 0.89(0.34-2.33) 0.81 0.45(0.06-3.56) 0.45
rs1472189 0.125 0.100 0.144 0.72(0.24-2.17) 0.56 0.51(0.14-1.84) 0.31 6.07(0.64-57.40) 0.12
DKK3_B1_ht1 0.438 0.650 0.417 1.90(0.91-3.95) 0.09 2.38(0.67-8.49) 0.18 2.23(0.73-6.75) 0.16
DKK3_B1_ht2 0.063 0.250 0.111 1.66(0.63-4.38) 0.30 1.86(0.66-5.26) 0.24 . .
DKK3_B1_ht3 0.000 0.100 0.077 0.66(0.14-3.03) 0.59 0.66(0.14-3.03) 0.59 . .
DKK3_B1_ht4 0.125 0.000 0.063 0.96(0.22-4.19) 0.95 0.97(0.22-4.37) 0.97 . .
DKK3_B2_ht1 0.688 0.300 0.458 1.05(0.51-2.14) 0.90 0.95(0.32-2.81) 0.93 1.21(0.38-3.84) 0.75
DKK3_B2_ht2 0.188 0.250 0.202 1.13(0.49-2.61) 0.78 1.08(0.40-2.90) 0.88 1.63(0.18-14.49) 0.66
DKK3_B2_ht3 0.125 0.250 0.167 1.26(0.53-2.99) 0.60 1.56(0.57-4.21) 0.39 . .
DKK3_B2_ht4 0.000 0.050 0.113 0.21(0.03-1.59) 0.13 0.20(0.03-1.58) 0.13 . .
IBJU
|
POL
YMORPHISMS IN DKK3 GENE AND PROST
A
TE CANCER RISK AND PROGRESSION
888
DKK3_B3_ht2 0.250 0.300 0.171 2.02(0.90-4.56) 0.09 2.78(1.05-7.36) 0.04 . .
DKK3_B3_ht3 0.438 0.050 0.155 1.47(0.65-3.31) 0.35 1.56(0.58-4.20) 0.38 1.81(0.22-15.12) 0.58
DKK3_B3_ht4 0.000 0.250 0.135 1.03(0.38-2.81) 0.96 1.12(0.38-3.32) 0.84 . .
DKK3_B3_ht5 0.063 0.050 0.121 0.43(0.10-1.95) 0.27 0.43(0.10-1.95) 0.27 . .
DKK3_B3_ht6 0.000 0.150 0.091 0.76(0.22-2.57) 0.66 0.81(0.22-3.03) 0.76 . .
DKK3_B4_ht1 0.188 0.450 0.377 0.77(0.37-1.60) 0.48 0.71(0.27-1.86) 0.48 0.73(0.16-3.44) 0.69
DKK3_B4_ht2 0.625 0.250 0.367 1.28(0.63-2.60) 0.50 1.03(0.38-2.76) 0.96 2.17(0.66-7.07) 0.20
DKK3_B4_ht3 0.188 0.300 0.161 1.83(0.81-4.16) 0.15 2.44(0.93-6.43) 0.07 . .
DKK3_B4_ht4 0.000 0.000 0.085 . . . .
DKK3_B5_ht1 0.125 0.300 0.163 1.50(0.66-3.41) 0.34 1.98(0.74-5.25) 0.17 . .
DKK3_B5_ht2 0.000 0.250 0.165 0.82(0.30-2.19) 0.69 0.89(0.30-2.62) 0.83 . .
DKK3_B5_ht3 0.125 0.000 0.135 0.41(0.10-1.69) 0.22 0.41(0.09-1.80) 0.24 . .
DKK3_B5_ht4 0.000 0.100 0.077 0.59(0.13-2.75) 0.50 0.59(0.13-2.75) 0.50 . .
DKK3_B5_ht5 0.438 0.100 0.111 2.53(1.17-5.47) 0.02 2.43(0.90-6.56) 0.08 8.71(1.60-47.51) 0.01
DKK3_B5_ht6 0.063 0.000 0.052 0.54(0.07-3.98) 0.54 0.54(0.07-4.11) 0.55 . .
DKK3_B5_ht7 0.000 0.000 0.065 . . . .
IBJU
|
POL
YMORPHISMS IN DKK3 GENE AND PROST
A
TE CANCER RISK AND PROGRESSION
889
Table 5 - Logistic analysis of DKK3 polymorphisms according to pathological stage criteria.
SNP ID
Minor Allele Frequency Co-dominant Dominant Recessive
Locally advanced
(n=100)
Localized (n=152)
OR(95%CI) P-value OR(95%CI) P-value OR(95%CI) P-value
rs751580 0.180 0.107 1.90(1.11-3.23) 0.02* 2.08(1.16-3.72) 0.01* 1.63(0.23-11.79) 0.63
rs11544817 0.170 0.107 1.72(1.02-2.92) 0.04* 1.82(1.01-3.29) 0.05* 2.37(0.39-14.51) 0.35
rs4757519 0.418 0.290 1.64(1.13-2.38) 0.009* 1.85(1.09-3.14) 0.02* 2.13(1.02-4.44) 0.04*
rs1552796 0.397 0.290 1.54(1.06-2.23) 0.02* 1.83(1.08-3.09) 0.02* 1.67(0.79-3.54) 0.18
rs11022098 0.144 0.084 1.88(1.01-3.52) 0.05* 1.88(1.01-3.52) 0.05* . .
rs1994843 0.041 0.097 0.36(0.16-0.82) 0.02* 0.36(0.16-0.82) 0.02* . .
rs2087882 0.356 0.253 1.54(1.05-2.26) 0.03* 1.74(1.03-2.92) 0.04* 1.87(0.82-4.26) 0.13
rs1472190 0.351 0.263 1.46(1.00-2.14) 0.05* 1.55(0.92-2.59) 0.10 1.93(0.85-4.37) 0.12
rs11022095 0.387 0.304 1.44(0.98-2.12) 0.06 1.70(1.00-2.88) 0.05* 1.40(0.63-3.11) 0.40
rs1472189 0.216 0.101 2.66(1.54-4.59) 0.0005* 2.61(1.47-4.62) 0.001* . .
DKK3_B1_ht2 0.155 0.087 2.00(1.12-3.58) 0.02* 1.93(1.04-3.55) 0.04* . .
DKK3_B5_ht7 0.036 0.090 0.33(0.14-0.80) 0.01* 0.33(0.14-0.80) 0.01* . .
IBJU
|
POL
YMORPHISMS IN DKK3 GENE AND PROST
A
TE CANCER RISK AND PROGRESSION
890
Supplementary Table 4 - Logistic analysis of DKK3 polymorphisms according to pathological stage criteria.
Minor Allele Frequency Co-dominant Dominant Recessive
SNP ID Locally advanced
(n=97)
Localized (n=150)
OR(95%CI) P-value OR(95%CI) P-value OR(95%CI) P-value
rs11022110 0.082 0.107 0.76(0.40-1.45) 0.41 0.80(0.41-1.57) 0.52 . .
rs1493208 0.428 0.393 1.20(0.81-1.78) 0.37 1.34(0.77-2.34) 0.30 1.12(0.53-2.35) 0.77
rs751580 0.180 0.107 1.90(1.11-3.23) 0.02 2.08(1.16-3.72) 0.01 1.63(0.23-11.79) 0.63
rs16910327 0.103 0.143 0.68(0.38-1.21) 0.19 0.59(0.32-1.11) 0.10 2.67(0.24-30.24) 0.43
rs3750940 0.124 0.150 0.79(0.46-1.36) 0.39 0.80(0.44-1.44) 0.45 0.47(0.05-4.64) 0.52
rs11544817 0.170 0.107 1.72(1.02-2.92) 0.04 1.82(1.01-3.29) 0.05 2.37(0.39-14.51) 0.35
rs2896594 0.124 0.137 0.89(0.51-1.53) 0.66 0.91(0.50-1.66) 0.77 0.48(0.05-4.80) 0.54
rs7104941 0.113 0.122 0.92(0.53-1.62) 0.78 1.05(0.57-1.95) 0.88 . .
rs3750938 0.325 0.292 1.19(0.80-1.77) 0.39 1.20(0.72-2.00) 0.50 1.40(0.58-3.42) 0.46
rs7107048 0.098 0.103 0.97(0.54-1.71) 0.90 1.07(0.55-2.08) 0.84 0.36(0.04-3.30) 0.37
rs7478978 0.103 0.110 0.95(0.52-1.73) 0.86 1.03(0.54-1.94) 0.93 . .
rs12421658 0.165 0.173 0.96(0.59-1.55) 0.86 0.88(0.50-1.54) 0.65 1.60(0.39-6.59) 0.51
rs16910308 0.175 0.211 0.77(0.48-1.24) 0.28 0.78(0.46-1.35) 0.38 0.47(0.09-2.37) 0.36
rs11022105 0.366 0.409 0.81(0.55-1.21) 0.31 0.74(0.43-1.27) 0.28 0.84(0.38-1.84) 0.65
rs6485351 0.237 0.227 1.08(0.71-1.64) 0.73 1.11(0.66-1.88) 0.69 1.02(0.35-2.98) 0.97
rs7116879 0.186 0.232 0.74(0.46-1.17) 0.20 0.75(0.44-1.28) 0.29 0.42(0.08-2.06) 0.28
rs988666 0.433 0.373 1.27(0.88-1.84) 0.20 1.22(0.72-2.09) 0.46 1.67(0.84-3.32) 0.14
rs2403557 0.250 0.252 1.00(0.66-1.53) 1.00 0.98(0.58-1.65) 0.94 1.08(0.37-3.16) 0.89
rs6485345 0.268 0.245 1.11(0.72-1.69) 0.64 0.97(0.58-1.63) 0.90 2.22(0.74-6.63) 0.15
rs16910295 0.129 0.154 0.83(0.48-1.44) 0.51 0.82(0.46-1.47) 0.50 0.81(0.07-9.11) 0.86
rs1038908 0.134 0.130 1.14(0.63-2.06) 0.67 1.14(0.63-2.06) 0.67 . .
rs12295349 0.170 0.170 1.03(0.63-1.69) 0.90 1.14(0.66-1.98) 0.64 0.34(0.04-2.98) 0.33
rs12288230 0.170 0.167 1.06(0.64-1.73) 0.83 1.18(0.68-2.04) 0.57 0.34(0.04-2.98) 0.33
rs16910294 0.134 0.187 0.70(0.42-1.16) 0.16 0.66(0.37-1.18) 0.16 0.60(0.11-3.17) 0.55
rs7113678 0.134 0.093 1.46(0.81-2.63) 0.21 1.51(0.81-2.81) 0.19 1.24(0.08-20.34) 0.88
rs12224675 0.139 0.164 0.77(0.46-1.30) 0.33 0.82(0.46-1.46) 0.50 0.27(0.03-2.40) 0.24
rs7109243 0.448 0.450 1.00(0.69-1.45) 0.99 1.10(0.63-1.93) 0.74 0.89(0.47-1.71) 0.73
rs4757595 0.067 0.103 0.62(0.31-1.27) 0.19 0.62(0.31-1.27) 0.19 . .
rs11022104 0.216 0.260 0.83(0.54-1.28) 0.39 0.90(0.53-1.53) 0.70 0.40(0.11-1.49) 0.17
rs12225759 0.469 0.467 1.02(0.68-1.52) 0.93 0.96(0.53-1.74) 0.89 1.11(0.57-2.16) 0.76
rs10765917 0.407 0.362 1.21(0.82-1.78) 0.34 1.22(0.71-2.08) 0.47 1.39(0.66-2.94) 0.39
rs6416121 0.062 0.103 0.57(0.28-1.18) 0.13 0.57(0.28-1.18) 0.13 . .
rs7478946 0.469 0.440 1.18(0.80-1.74) 0.41 1.68(0.92-3.07) 0.09 0.82(0.41-1.63) 0.57
rs4757519 0.418 0.290 1.64(1.13-2.38) 0.009 1.85(1.09-3.14) 0.02 2.13(1.02-4.44) 0.04
rs7395522 0.149 0.207 0.71(0.44-1.15) 0.16 0.79(0.45-1.38) 0.40 0.16(0.02-1.26) 0.08
rs16910272 0.165 0.200 0.77(0.49-1.23) 0.28 0.77(0.44-1.35) 0.36 0.53(0.14-2.06) 0.36
IBJU
|
POL
YMORPHISMS IN DKK3 GENE AND PROST
A
TE CANCER RISK AND PROGRESSION
8
91
rs4586138 0.113 0.147 0.72(0.42-1.25) 0.25 0.74(0.40-1.35) 0.32 0.34(0.04-3.13) 0.34
rs11022099 0.214 0.201 1.13(0.71-1.79) 0.62 1.17(0.69-2.00) 0.56 0.96(0.22-4.12) 0.96
rs6485328 0.206 0.263 0.75(0.49-1.14) 0.18 0.72(0.42-1.22) 0.22 0.61(0.21-1.78) 0.36
rs7396140 0.428 0.467 0.91(0.64-1.29) 0.58 0.79(0.46-1.36) 0.39 1.00(0.54-1.85) 1.00
rs1552796 0.397 0.290 1.54(1.06-2.23) 0.02 1.83(1.08-3.09) 0.02 1.67(0.79-3.54) 0.18
rs7480815 0.438 0.383 1.20(0.84-1.71) 0.32 1.21(0.71-2.08) 0.48 1.38(0.72-2.65) 0.33
rs11022098 0.144 0.084 1.88(1.01-3.52) 0.05 1.88(1.01-3.52) 0.05 . .
rs1994843 0.041 0.097 0.36(0.16-0.82) 0.02 0.36(0.16-0.82) 0.02 . .
rs2087882 0.356 0.253 1.54(1.05-2.26) 0.03 1.74(1.03-2.92) 0.04 1.87(0.82-4.26) 0.13
rs2291599 0.206 0.247 0.82(0.54-1.25) 0.36 0.81(0.48-1.37) 0.42 0.68(0.23-2.01) 0.48
rs7396187 0.211 0.247 0.85(0.56-1.29) 0.43 0.81(0.48-1.37) 0.43 0.82(0.29-2.27) 0.70
rs1472190 0.351 0.263 1.46(1.00-2.14) 0.05 1.55(0.92-2.59) 0.10 1.93(0.85-4.37) 0.12
rs7480026 0.062 0.107 0.53(0.26-1.08) 0.08 0.54(0.26-1.11) 0.09 . .
rs7480000 0.340 0.413 0.73(0.51-1.07) 0.10 0.67(0.40-1.14) 0.14 0.65(0.31-1.35) 0.25
rs11022095 0.387 0.304 1.44(0.98-2.12) 0.06 1.70(1.00-2.88) 0.05 1.40(0.63-3.11) 0.40
rs1472189 0.216 0.101 2.66(1.54-4.59) 0.0005 2.61(1.47-4.62) 0.001 . .
DKK3_B1_ht1 0.438 0.403 1.20(0.81-1.76) 0.36 1.30(0.74-2.27) 0.36 1.19(0.59-2.42) 0.62
DKK3_B1_ht2 0.155 0.087 2.00(1.12-3.58) 0.02 1.93(1.04-3.55) 0.04 . .
DKK3_B1_ht3 0.067 0.073 0.90(0.43-1.89) 0.78 0.90(0.43-1.89) 0.78 . .
DKK3_B1_ht4 0.041 0.073 0.57(0.25-1.32) 0.19 0.58(0.24-1.37) 0.21 . .
DKK3_B2_ht1 0.474 0.450 1.10(0.75-1.62) 0.62 1.17(0.65-2.10) 0.60 1.09(0.56-2.09) 0.80
DKK3_B2_ht2 0.175 0.210 0.78(0.48-1.25) 0.30 0.79(0.46-1.36) 0.40 0.47(0.09-2.38) 0.36
DKK3_B2_ht3 0.165 0.173 0.96(0.59-1.55) 0.86 0.88(0.50-1.54) 0.65 1.60(0.39-6.59) 0.51
DKK3_B2_ht4 0.103 0.110 0.95(0.52-1.73) 0.86 1.03(0.54-1.94) 0.93 . .
DKK3_B3_ht1 0.289 0.263 1.12(0.76-1.65) 0.57 1.22(0.73-2.04) 0.45 0.99(0.41-2.39) 0.98
DKK3_B3_ht2 0.170 0.167 1.06(0.64-1.73) 0.83 1.18(0.68-2.04) 0.57 0.34(0.04-2.98) 0.33
DKK3_B3_ht3 0.134 0.157 0.78(0.46-1.32) 0.35 0.83(0.46-1.49) 0.53 0.28(0.03-2.42) 0.24
DKK3_B3_ht4 0.119 0.143 0.83(0.47-1.45) 0.51 0.82(0.45-1.49) 0.50 0.82(0.07-9.16) 0.87
DKK3_B3_ht5 0.124 0.113 1.21(0.66-2.22) 0.55 1.21(0.66-2.22) 0.55 . .
DKK3_B3_ht6 0.119 0.080 1.46(0.78-2.71) 0.24 1.52(0.78-2.93) 0.22 1.24(0.08-20.34) 0.88
DKK3_B4_ht1 0.397 0.363 1.15(0.78-1.69) 0.47 1.11(0.65-1.88) 0.71 1.40(0.66-2.97) 0.38
DKK3_B4_ht2 0.376 0.377 0.97(0.66-1.42) 0.87 0.88(0.52-1.49) 0.63 1.14(0.54-2.41) 0.72
DKK3_B4_ht3 0.155 0.157 1.03(0.62-1.70) 0.91 1.14(0.65-2.02) 0.64 0.34(0.04-2.98) 0.33
DKK3_B4_ht4 0.057 0.103 0.52(0.25-1.10) 0.09 0.52(0.25-1.10) 0.09 . .
DKK3_B5_ht1 0.134 0.180 0.75(0.45-1.23) 0.25 0.81(0.45-1.43) 0.46 0.21(0.03-1.74) 0.15
DKK3_B5_ht2 0.144 0.173 0.83(0.50-1.38) 0.48 0.89(0.50-1.56) 0.67 0.31(0.04-2.67) 0.28
DKK3_B5_ht3 0.124 0.133 0.92(0.55-1.54) 0.74 0.95(0.52-1.75) 0.87 0.61(0.12-3.22) 0.56
DKK3_B5_ht4 0.108 0.063 1.81(0.91-3.60) 0.09 1.81(0.91-3.60) 0.09 . .
DKK3_B5_ht5 0.093 0.137 0.64(0.36-1.13) 0.12 0.63(0.33-1.19) 0.16 0.34(0.04-3.13) 0.34
DKK3_B5_ht6 0.052 0.053 0.96(0.43-2.15) 0.92 0.84(0.36-2.00) 0.70 . .
DKK3_B5_ht7 0.036 0.090 0.33(0.14-0.80) 0.01 0.33(0.14-0.80) 0.01 . .
IBJU | POLYMORPHISMS IN DKK3 GENE AND PROSTATE CANCER RISK AND PROGRESSION
892
One SNP (rs1994843) and one haplotype (Block5_ht7)
exhibited a protective effect from pathological cancer
stage in both co-dominant and dominant model (OR
0.36, p=0.02; OR 0.33, p=0.01). Among 9 SNPS, 2
SNPs (rs4757519, rs1472189) exhibited a markedly
significant association with greater aggressiveness.
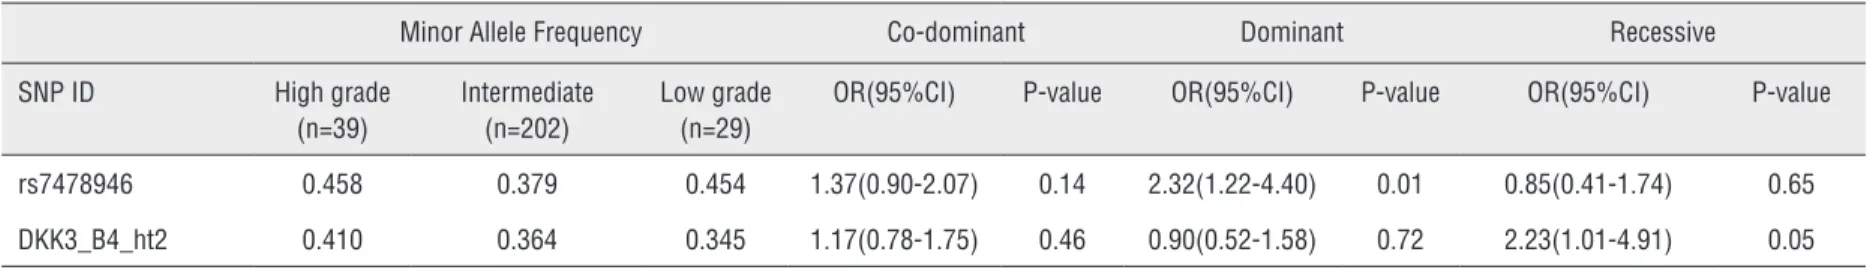
The association between DKK3 polymorphisms
and Gleason score in prostate cancer group
When we stratified the patients according
to Gleason score, we observed that the association
of prostate cancer risk with one SNP (rs7478946)
and one haplotype (Block4_ht2) was strongest
among patients with high compared to low grade
Gleason scores (OR 2.32, p=0.01 in the dominant
model; OR 2.23, p=0.05 in the recessive model,
respectively; Table-6, Supplementary Table-5).
DISCUSSION
SNPs are the most common
polymorphis-ms in the genomes of many species. The
defini-tion of a SNP is a variadefini-tion of the DNA sequence
at a frequency larger than 1% of the allele of a
population (5). In this study, we examined
whe-ther genetic variations in the DKK3 gene alter the
risk of developing prostate cancer. A total of 53
SNPs located in the DKK3 gene were genotyped in
272 patients with prostate cancer and 173 control
subjects with BPH. We found that three SNPs and
two haplotypes were significantly associated with
prostate cancer risk (p<0.05). Also, we found that
two SNPs were markedly significantly associated
with prostate cancer aggressiveness (P<0.001).
These findings suggest that DKK3 gene
polymor-phisms may alter susceptibility to prostate cancer
and could thus possibly be used as biomarkers for
the disease and predictors for aggressivenessin
pa-tient with prostate cancer.
The Dickkopf (DKK) family consists of four
genes (DKK1-4) and a DKK3-related gene (20).
DKK3 is the most divergent member of the DKK
family by DNA sequence, function, and evolution.
Unlike the other DKK members, DKK3 does not
modulate Wnt signaling (11) and shows no
affi-nity to the Wnt co-receptor LRP5/6 and Kremen
(21). Human DKK3 was proposed to function as a
tumor suppressor, since its expression is
down-re-gulated in many types of cancer cells (11). DKK3
down-regulation has been reported in endometrial
cancer (22), lung cancer (23), gastrointestinal
can-cer (24), breast cancan-cer (25), prostate cancan-cer (26, 27),
and renal carcinomas (28). In support of the
hypo-thesis that DKK3 functions in prostate as a tumor
suppressor, overexpression of DKK3 suppresses cell
growth and the invasive capacity of prostate cancer
cell lines (26, 27). Zenzmaier et al. reported that
in normal prostate tissue the secreted glycoprotein
DKK3 is expressed in the epithelial compartment
but expression is lost in BPH and prostate cancer
(29). DKK3 promotes fibroblast proliferation and
myofibroblast differentiation and represents a
po-tential therapeutic target for stromal remodeling in
BPH and prostate cancer (30).
To our knowledge, one epidemiological
investigation between DKK3 and prostate cancer
have been reported. Zenzmaier et al. reported that
DKK3 levels in seminal plasma were
significan-tly elevated in biopsy-confirmed prostate cancer
patients, because loss of expression seems to be
counterbalanced by upregulation of DKK3
expres-sion (31). In this study, we epidemiologically
in-vestigated whether SNPs of the DKK3 gene were
related to the risk and aggressiveness of prostate
cancer for the first time.
IBJU
|
POL
YMORPHISMS IN DKK3 GENE AND PROST
A
TE CANCER RISK AND PROGRESSION
893
Table 6 - Logistic analysis of DKK3 polymorphisms according to Gleason score criteria.
Minor Allele Frequency Co-dominant Dominant Recessive
SNP ID High grade
(n=39)
Intermediate (n=202)
Low grade (n=29)
OR(95%CI) P-value OR(95%CI) P-value OR(95%CI) P-value
rs7478946 0.458 0.379 0.454 1.37(0.90-2.07) 0.14 2.32(1.22-4.40) 0.01 0.85(0.41-1.74) 0.65
DKK3_B4_ht2 0.410 0.364 0.345 1.17(0.78-1.75) 0.46 0.90(0.52-1.58) 0.72 2.23(1.01-4.91) 0.05
Minor allele frequencies and P-values for logistic analyses of three alternative models (co-dominant, dominant and recessive models) controlling for age as covariate are shown. OR: odd ratio, CI: confidence interval * Statistically significant at P ≤ 0.05
Supplementary Table 5 - Logistic analysis of DKK3 polymorphisms according to Gleason score criteria.
Minor Allele Frequency Co-dominant Dominant Recessive
SNP ID High grade
(n=39)
Intermediate (n=202)
Low grade (n=29)
OR(95%CI) P-value OR(95%CI) P-value OR(95%CI) P-value
rs11022110 0.111 0.052 0.098 0.99(0.52-1.91) 0.98 1.10(0.55-2.20) 0.78 0.13(0.01-2.14) 0.15
rs1493208 0.401 0.500 0.411 0.80(0.53-1.22) 0.30 0.98(0.55-1.76) 0.94 0.47(0.21-1.03) 0.06
rs751580 0.136 0.121 0.135 1.13(0.64-1.98) 0.67 1.07(0.57-1.99) 0.84 2.32(0.34-15.84) 0.39
rs16910327 0.121 0.224 0.135 0.70(0.39-1.25) 0.22 0.68(0.36-1.27) 0.22 0.72(0.05-9.91) 0.81
rs3750940 0.144 0.207 0.144 0.60(0.34-1.07) 0.08 0.61(0.33-1.13) 0.12 0.27(0.03-2.24) 0.23
rs11544817 0.131 0.121 0.131 1.14(0.65-1.99) 0.64 0.99(0.52-1.88) 0.98 3.85(0.73-20.42) 0.11
rs2896594 0.139 0.190 0.139 0.65(0.37-1.15) 0.14 0.66(0.35-1.23) 0.19 0.29(0.04-2.34) 0.24
rs7104941 0.130 0.121 0.125 0.89(0.50-1.60) 0.70 0.87(0.46-1.66) 0.67 0.95(0.10-9.10) 0.96
rs3750938 0.333 0.276 0.316 0.93(0.61-1.41) 0.72 0.97(0.56-1.68) 0.92 0.75(0.29-1.93) 0.54
rs7107048 0.099 0.103 0.102 1.06(0.59-1.92) 0.84 1.02(0.50-2.05) 0.97 1.53(0.26-9.08) 0.64
rs7478978 0.094 0.207 0.111 0.68(0.36-1.26) 0.22 0.58(0.30-1.14) 0.12 2.68(0.26-27.99) 0.41
rs12421658 0.168 0.155 0.169 1.14(0.68-1.90) 0.62 1.04(0.57-1.87) 0.91 2.54(0.57-11.28) 0.22
rs16910308 0.209 0.172 0.204 1.12(0.69-1.82) 0.66 1.12(0.64-1.96) 0.70 1.30(0.29-5.79) 0.73
rs11022105 0.405 0.328 0.396 1.21(0.80-1.82) 0.37 1.15(0.65-2.04) 0.64 1.53(0.70-3.35) 0.28
rs6485351 0.228 0.155 0.224 1.40(0.89-2.21) 0.15 1.31(0.75-2.30) 0.35 2.74(0.91-8.27) 0.07
rs7116879 0.226 0.172 0.219 1.16(0.72-1.87) 0.55 1.17(0.67-2.04) 0.58 1.30(0.32-5.39) 0.72
rs988666 0.371 0.534 0.402 0.91(0.61-1.35) 0.63 0.85(0.48-1.50) 0.58 0.93(0.44-1.96) 0.85
rs2403557 0.241 0.310 0.265 1.23(0.80-1.89) 0.35 1.08(0.63-1.88) 0.78 2.44(0.92-6.44) 0.07
rs6485345 0.259 0.190 0.255 1.30(0.83-2.04) 0.25 1.24(0.72-2.15) 0.44 2.12(0.70-6.45) 0.19
IBJU
|
POL
YMORPHISMS IN DKK3 GENE AND PROST
A
TE CANCER RISK AND PROGRESSION
894
rs1038908 0.139 0.155 0.131 0.64(0.34-1.21) 0.17 0.64(0.34-1.21) 0.17 . .
rs12295349 0.176 0.190 0.181 1.11(0.67-1.86) 0.68 1.25(0.70-2.21) 0.46 0.51(0.10-2.74) 0.43
rs12288230 0.173 0.172 0.178 1.19(0.71-1.98) 0.51 1.35(0.76-2.41) 0.31 0.51(0.10-2.74) 0.43
rs16910294 0.166 0.155 0.165 1.07(0.64-1.79) 0.79 1.14(0.63-2.07) 0.66 0.80(0.16-4.02) 0.79
rs7113678 0.104 0.052 0.104 1.61(0.87-3.00) 0.13 1.64(0.83-3.25) 0.15 2.58(0.25-26.98) 0.43
rs12224675 0.147 0.224 0.164 0.93(0.55-1.57) 0.79 1.03(0.57-1.88) 0.92 0.39(0.08-1.87) 0.24
rs7109243 0.455 0.552 0.469 0.86(0.58-1.26) 0.43 0.77(0.42-1.40) 0.39 0.88(0.46-1.69) 0.70
rs4757595 0.082 0.121 0.087 0.86(0.42-1.77) 0.68 0.86(0.42-1.77) 0.68 . .
rs11022104 0.250 0.293 0.254 0.91(0.58-1.43) 0.69 0.95(0.55-1.65) 0.86 0.70(0.23-2.14) 0.53
rs12225759 0.465 0.483 0.463 0.88(0.58-1.33) 0.53 0.87(0.47-1.63) 0.67 0.81(0.40-1.64) 0.55
rs10765917 0.389 0.357 0.379 0.93(0.62-1.39) 0.71 0.85(0.48-1.50) 0.58 1.02(0.46-2.28) 0.96
rs6416121 0.077 0.121 0.083 0.87(0.42-1.81) 0.71 0.87(0.42-1.81) 0.71 . .
rs7478946 0.458 0.379 0.454 1.37(0.90-2.07) 0.14 2.32(1.22-4.40) 0.01 0.85(0.41-1.74) 0.65
rs4757519 0.351 0.241 0.331 1.06(0.72-1.56) 0.77 1.24(0.71-2.14) 0.45 0.82(0.37-1.81) 0.62
rs7395522 0.196 0.155 0.193 1.22(0.76-1.96) 0.42 1.35(0.76-2.41) 0.30 0.94(0.25-3.54) 0.92
rs16910272 0.181 0.190 0.189 1.14(0.71-1.84) 0.59 1.09(0.61-1.94) 0.77 1.73(0.49-6.17) 0.40
rs3750936 0.270 0.362 0.280 0.79(0.50-1.25) 0.31 0.85(0.49-1.46) 0.55 0.46(0.15-1.43) 0.18
rs4586138 0.116 0.190 0.137 1.16(0.67-2.00) 0.60 1.13(0.61-2.12) 0.70 1.75(0.30-10.15) 0.53
rs11022099 0.206 0.268 0.213 0.83(0.51-1.36) 0.46 0.93(0.53-1.63) 0.80 0.31(0.07-1.30) 0.11
rs6485328 0.257 0.190 0.246 1.10(0.71-1.69) 0.68 1.29(0.74-2.25) 0.36 0.69(0.24-1.97) 0.49
rs7396140 0.460 0.500 0.461 0.91(0.63-1.31) 0.61 1.15(0.64-2.06) 0.65 0.63(0.33-1.21) 0.17
rs1552796 0.342 0.241 0.322 1.04(0.71-1.55) 0.83 1.16(0.67-2.01) 0.59 0.86(0.38-1.97) 0.72
rs7480815 0.408 0.310 0.388 1.03(0.70-1.50) 0.89 1.18(0.68-2.07) 0.56 0.84(0.41-1.72) 0.63
rs11022098 0.105 0.069 0.103 1.26(0.64-2.48) 0.51 1.26(0.64-2.48) 0.51 . .
rs1994843 0.072 0.069 0.070 0.92(0.42-2.02) 0.84 0.92(0.42-2.02) 0.84 . .
rs2087882 0.316 0.196 0.289 0.97(0.65-1.46) 0.89 1.17(0.68-2.03) 0.57 0.59(0.24-1.44) 0.24
rs2291599 0.240 0.190 0.235 1.18(0.76-1.82) 0.47 1.42(0.81-2.48) 0.22 0.70(0.23-2.11) 0.53
rs7396187 0.248 0.190 0.239 1.11(0.72-1.72) 0.62 1.32(0.76-2.30) 0.33 0.72(0.25-2.04) 0.53
rs1472190 0.317 0.224 0.293 0.93(0.62-1.40) 0.73 1.06(0.62-1.83) 0.83 0.61(0.25-1.50) 0.28
rs7480026 0.087 0.086 0.085 0.92(0.45-1.86) 0.81 0.92(0.44-1.91) 0.82 0.74(0.01-67.85) 0.90
rs7480000 0.376 0.393 0.390 1.20(0.81-1.79) 0.36 1.14(0.64-2.01) 0.66 1.57(0.75-3.31) 0.23
rs11022095 0.331 0.357 0.340 1.05(0.70-1.59) 0.80 0.84(0.48-1.46) 0.54 1.92(0.83-4.46) 0.13
rs1472189 0.155 0.052 0.144 1.50(0.86-2.63) 0.15 1.66(0.90-3.06) 0.11 0.87(0.09-8.24) 0.90
DKK3_B1_ht1 0.423 0.411 0.534 0.81(0.53-1.21) 0.30 0.82(0.46-1.48) 0.52 0.66(0.31-1.41) 0.28
DKK3_B1_ht2 0.128 0.116 0.086 1.28(0.70-2.34) 0.43 1.20(0.62-2.31) 0.59 4.24(0.40-44.36) 0.23
DKK3_B1_ht3 0.051 0.079 0.086 0.73(0.34-1.56) 0.41 0.73(0.34-1.56) 0.41 . .
IBJU
|
POL
YMORPHISMS IN DKK3 GENE AND PROST
A
TE CANCER RISK AND PROGRESSION
895
DKK3_B2_ht1 0.410 0.463 0.466 0.83(0.55-1.25) 0.38 0.67(0.37-1.24) 0.20 0.98(0.48-1.97) 0.95
DKK3_B2_ht2 0.205 0.208 0.172 1.12(0.69-1.82) 0.66 1.12(0.64-1.96) 0.71 1.31(0.29-5.81) 0.73
DKK3_B2_ht3 0.179 0.168 0.155 1.14(0.68-1.90) 0.62 1.04(0.57-1.87) 0.91 2.54(0.57-11.28) 0.22
DKK3_B2_ht4 0.128 0.094 0.207 0.68(0.36-1.26) 0.22 0.58(0.30-1.14) 0.12 2.68(0.26-27.99) 0.41
DKK3_B3_ht1 0.244 0.265 0.241 1.00(0.66-1.52) 1.00 0.80(0.46-1.39) 0.43 1.90(0.75-4.80) 0.18
DKK3_B3_ht2 0.205 0.173 0.172 1.19(0.71-1.98) 0.51 1.35(0.76-2.41) 0.31 0.51(0.10-2.74) 0.43
DKK3_B3_ht3 0.179 0.146 0.207 0.87(0.52-1.48) 0.61 0.95(0.52-1.74) 0.86 0.39(0.08-1.86) 0.24
DKK3_B3_ht4 0.115 0.136 0.155 0.85(0.48-1.51) 0.58 0.83(0.45-1.57) 0.57 0.82(0.09-7.86) 0.86
DKK3_B3_ht5 0.064 0.124 0.155 0.57(0.30-1.10) 0.09 0.57(0.30-1.10) 0.09 . .
DKK3_B3_ht6 0.115 0.092 0.052 1.40(0.73-2.69) 0.31 1.39(0.67-2.86) 0.37 2.58(0.25-26.98) 0.43
DKK3_B4_ht1 0.346 0.381 0.362 0.93(0.62-1.39) 0.71 0.84(0.48-1.47) 0.55 1.05(0.47-2.36) 0.90
DKK3_B4_ht2 0.410 0.364 0.345 1.17(0.78-1.75) 0.46 0.90(0.52-1.58) 0.72 2.23(1.01-4.91) 0.05
DKK3_B4_ht3 0.154 0.168 0.172 0.96(0.57-1.61) 0.86 1.03(0.57-1.85) 0.93 0.51(0.10-2.74) 0.43
DKK3_B4_ht4 0.090 0.074 0.121 0.87(0.42-1.84) 0.72 0.87(0.42-1.84) 0.72 . .
DKK3_B5_ht1 0.179 0.168 0.121 1.28(0.78-2.11) 0.33 1.42(0.78-2.58) 0.25 1.00(0.23-4.32) 1.00
DKK3_B5_ht2 0.167 0.153 0.224 0.84(0.50-1.43) 0.53 0.89(0.49-1.62) 0.70 0.45(0.08-2.39) 0.35
DKK3_B5_ht3 0.051 0.144 0.138 0.65(0.38-1.12) 0.12 0.54(0.28-1.05) 0.07 0.90(0.18-4.53) 0.90
DKK3_B5_ht4 0.090 0.079 0.052 1.28(0.60-2.71) 0.52 1.28(0.60-2.71) 0.52 . .
DKK3_B5_ht5 0.179 0.106 0.138 1.29(0.73-2.26) 0.39 1.30(0.67-2.50) 0.44 1.75(0.30-10.15) 0.53
DKK3_B5_ht6 0.026 0.054 0.034 0.84(0.34-2.03) 0.69 0.81(0.32-2.09) 0.67 1.04(0.01-96.11) 0.99
DKK3_B5_ht7 0.064 0.062 0.052 1.11(0.49-2.54) 0.81 1.11(0.49-2.54) 0.81 . .