391
1. Ph.D., Instituto Materno-Infantil de Pernambuco (IMIP), Recife, PE,Brazil.
2. M.Sc., IMIP, Recife, PE, Brazil.
3. Pediatric lung specialist, IMIP, Recife, PE, Brazil. 4. Ph.D., IMIP, Recife, PE, Brazil.
Manuscript received Dec 02 2003, accepted for publication Jun 09 2004. Suggested citation: Britto MCA, Bezerra PGM, Brito RCCM, Rego JC, Burity EF, Alves JGB. Asthma in schoolchildren from Recife, Brazil. Prevalence comparison: 1994-95 and 2002. J Pediatr (Rio J). 2004;80:391-400.
Abstract
Objectives: To describe the prevalence of asthma and asthma variants in schoolchildren from Recife in 2002, and to compare these data with data from 1994-95; to analyze the relationship between maternal schooling and the presence of asthma or worsening asthma; and to evaluate the diagnostic accuracy of the yearly prevalence of wheezing as an asthma indicator.
Methods: Cross-sectional study. A probabilistic sample of 3,086 and 2,774 13- and 14-year-old students answered a written questionnaire in 1994-95 and 2002, as part of the International Study of Asthma and Allergies in Childhood.
Results: The following prevalence rates were observed in 1994-95 and 2002, respectively: cumulative prevalence of referred asthma: 21 vs 18.2%; cumulative prevalence of wheezing: 39 vs 38%; yearly prevalence of wheezing: 19.7 vs 19.4%; yearly prevalence of night cough: 31 vs 38%; yearly prevalence of exercise-induced wheezing: 20.6 vs 23.8%. The yearly prevalence of asthma attacks was 16.3 vs 15.2% for 1 to 3 attacks; 2.7 vs
1.2% for 4 to 12 attacks; and 1 vs 0.4% for more than 12 attacks. The yearly prevalence of attacks that disturbed
sleep was 13 and 10.3%. The yearly prevalence of attacks with compromised speech was 4.8 and 4.1%. Higher levels of maternal schooling were related to higher cumulative prevalence of referred asthma and to cumulative and yearly prevalence of wheezing.
Conclusions: The prevalence of asthma and its severe forms is high in teenager students in Recife. It is also related to higher levels of maternal schooling.
J Pediatr (Rio J). 2004;80(5):391-400: Asthma, adolescent, child, school health, prevalence. Copyright © 2004 by Sociedade Brasileira de Pediatria
Introduction
Asthma is a chronic inflammatory disease of the airways, predominantly eosinophilic, which results in a recurrent obstruction of the airflow, reversible spontaneously or in response to therapy. Atopic disease is the most frequently identified predisposing factor.1-4 It
constitutes a public health problem, as much for its prevalence as for its morbidity.5-9
During phase one of ISAAC, (International Study of Asthma and Allergies in Childhood), 463,801 13 and 14 year-old adolescents and 257,800 children aged 6 and 7 years of age, from 56 countries were studied by questionnaire. The average cumulative prevalence of asthma reported was 11.3%, varying from 1.4 to 30.4%. Brazil was eighth in the ranking.5 This project investigated 20,544 schoolchildren
aged 13-14 years and 13,604 aged 6-7 years, in Curitiba, Itabira, Recife, Salvador, São Paulo, Porto Alegre and Uberlândia. In the first group, the reported prevalence of asthma was 9.8% for males and 10.2% for females. In the 6-7 year-old group, it was 7.3 and 4.9%, respectively.6 In
Recife, the ISAAC data from 1994-95 for 1,410 schoolchildren aged 6 and 7 years and 3,086 pupils aged 13 and 14 years old, demonstrated a reported asthma prevalence of 20.4 and 19.7%, respectively.7
Further Brazilian studies using methods similar to those of the ISAAC project have also been performed recently. In schoolchildren from Uberlândia aged 6 and 7
Asthma in schoolchildren from Recife, Brazil.
Prevalence comparison: 1994-95 and 2002
Murilo C. A. Britto,1 Patrícia G. M. Bezerra,2 Rita C. C. M. Brito,3
Joakim C. Rego,3 Edjane F. Burity,3 João G. B. Alves4
and 13 and 14, the prevalence of asthma was 15 and 16.8%, respectively.10 Camargos et al.,11 studying 13
and 14 year-old adolescents in provincial Minas Gerais, found a reported cumulative asthma prevalence of 27%. In Itabira and Santa Maria, cities in Minas Gerais state, a reported prevalence of asthma of 4.6% was observed in schoolchildren.12 Chatkin,8 found a prevalence of 25.4%
in a cohort from the city of Pelotas in 1997-98.
In addition to the point-by-point assessments, the comparison of different periods allows tendencies to be detected in the variation of prevalence. In the United States between 1963 and 1980, in children from 6 to 11 years of age, the reported prevalence of asthma increased from 5.3 to 7.6%.13 In England, Burney et al.,14 studying
children from 4 to 12 years of age, demonstrated an increase in prevalence of 6.9% among boys and 12.8% among girls, between 1973 and 1986. In Scotland, Upton et al.15 studying 1,447 couples in 1972 and 1,124 adults
descendents in 1996, found that prevalence had doubled. In Melbourne, the prevalence of reported asthma increased for the 7 year-old subset from 19.1 to 46% between 1964 and 1990.16 Shaw et al.,17 studying adolescents in New
Zealand observed an increase in the prevalence of reported asthma or wheezing from 26.2 to 34.0%, in the period from 1975 to 1989.
Asthma and socioeconomic conditions: the relationship between the two is not clear. According to Rona,18 there
is not sufficient evidence to associate poverty as an etiologic factor in asthma. Nevertheless, the numbers of urgent cases, hospitalizations and deaths are linked to this variable. In Brazil relational studies have been contradictory and rare.
The objectives of this study were to: describe the current prevalence of asthma and its variants in schoolchildren from the city of Recife, to compare prevalence for the periods 1994-1995 and 2002, to analyze any relationship with the extent of maternal education and to evaluate the diagnostic accuracy of the annual prevalence of wheezing as an indicator of asthma.
Method
A population-based, cross-sectional study was performed in Recife with adolescents de 13 and 14 years of age, composed of two surveys, one in 1994-95 and the other in 2002.
Recife is a coastal city in the Northeast of Brazil, with an area of 2,200 km2 and 1,296,996 inhabitants, of whom
48% are poor (per capita income less than half a minimum national wage). The average temperature is 25.3 oC,
varying from 23.2 to 26.5 oC. Humidity is between 72 and
86%.19 The metropolitan region produces the following
air pollutants monthly: 1,000 tons of airborne particles, 351 tons of sulphur dioxide, 45 tons of nitrous oxide, 33 tons of hydrocarbons and 336 tons of carbon monoxide.20
According to the IBGE 2000 census, 40.8% of the inhabitants of Recife aged more than 20 years had not completed four years schooling.21
Both the sample of schoolchildren from 1994-95 and that from 2002 were selected in a probabilistic manner. The Recife Municipal Education Authority provided the seventh and eighth grade roll (in which grades students aged 13-14 years are to be found), according to type public (state, municipal, federal) and private, with the number of students in these grades per school. Lots were drawn in such a manner as to preserve distribution by type. Schools with less than 10 students were excluded and those with large numbers participated with a maximum of 200 schoolchildren.
For the sample size calculation, initial asthma prevalence was assumed to be 20%, with an annual increase or decrease of 0.5%, a power of 80% and significance level of 5%, resulting in a requirement for 1967 subjects per survey, although in the event an attempt was made to obtain 3,000 schoolchildren per survey, as specified by the ISAAC project.
The instrument employed had been developed for the ISAAC project, using closed responses, designed for auto-administration by the students and previously validated in São Paulo.22 The only changes made to this instrument
were: 1. Add the degree of maternal education item. 2. Where the original questionnaire referred to wheezing, this was translated as: chiado no peito (cansaço, sibilos, piado) [roughly translated, wheezes in chest (fatigue, whistling, crackling)], since it is common to refer to episodes of asthma as fatigue in our locale.
Both surveys were entered onto their databases using double-input. Statistical analysis was performed with Epi Info 2002 and Win Episcope 2.0. Pearsons association chi-square and chi-square for tendencies were used. Significance cutoff was set at 5%. For the diagnostic accuracy evaluation, tests of sensitivity, specificity, positive and negative predictive values and the Youden index were used with 95% confidence intervals.
Each school principal signed a free and informed consent form before inclusion in the study. The study was approved by the IMIP Committee for Ethics in Research.
Results
In 1994-95, 97.6% of the questionnaires were returned and 100% in 2002. On both occasions one private school refused to take part and was excluded from the sample.
The proportion of public schools had increased between the two surveys. In 1994-95 this figure was 65% and in 2002 it was 74.6% (p < 0.001).
In 1994-95 1,656 13 year-old students and 1,431 14 year-old students were studied, making a total of 3,086 schoolchildren. Of these 1,392 (45.1%) were male and 1,694 (54.9%) female. In 2002, 1,428 of the 2,774 questionnaires were from 13 year-olds and 1,346 from 14 year-olds. Distribution by sex was similar: 1,238 (44.6%) males and 1,536 (55.4%) females.
level of illiteracy was 7.2 and 10.7% for the two occasions, respectively. Basic elementary school had not been completed by 32.3 as against 46.2%, respectively.
In Table 1 the cumulative annual prevalence of wheezing can be observed. There was no significant difference in prevalence between 1994-95 and 2002 in either variable, even when grouped or stratified by sex. The annual prevalence of night cough and exercise triggered wheezing can also be seen in Table 1. There was a significant increase in night cough in 2002 (31 versus 38%, Pearsons chi-square, p < 0.001). In a similar
manner the prevalence of wheezing triggered by exercise increased from 20.6% in 1994-95 to 23.8% in 2002.
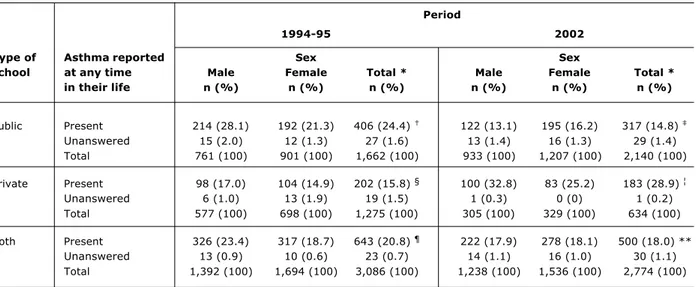
The cumulative reported prevalence of asthma (Table 2) was 21% in 1994-95 and 18.2% in 2002. There was a significant reduction in prevalence, when the two periods were compared. The first survey revealed a male predominance (Pearsons chi-square, p < 0.001), in contrast with 2002 (Pearsons chi-square, p < 0.918). Taking the values by type of school, it is observed that the prevalence at public schools had dropped from 24.8 to 15% and at the private schools had risen from 16.1 to
2) Have you had wheezes in the chest (fatigue, whistling, crackling) in the last 12 months?
7) Have you have wheezes in the chest (fatigue, whistling, crackling) after practicing physical exercises
8) Have you had nocturnal cough without having a cold or a respiratory infection in the last 12 months? 5) The wheezing crises (fatigue, whistling, crackling) were severe enough to cause speaking difficulties
6) Have you ever suffered from asthma? in the last 12 months?
in the last 12 months?
in the last 12 months?
4) How many times the wheezes in the chest (fatigue, whistling, crackling) have disturbed your sleep
( ) The wheezing crises never disturbed my sleep ( ) Less than 1 night a week ( ) 1 or more nights a week 3) How many crises of wheezes in the chest (fatigue, whistling, crackling) have you had in the last 12 months?
( ) None ( ) 1 to 3 crises ( ) 4 to 12 crises ( ) More than 12 crises If your answer was NO, go to question no. 6.
1) Have you ever had wheezes in the chest (fatigue, whistling, crackling)?
( ) Yes ( ) No
( ) Yes ( ) No
( ) Yes ( ) No
( ) Yes ( ) No
( ) Yes ( ) No
( ) Yes ( ) No
What is your mother's educational level?
( ) High school ( )
( )
Incomplete elementary school
Has never attended school
( ) Incomplete high school
Phone number: Sex: ( ) Male ( ) Female
Home address:
Name: Age:
School: Date: / /
No.
( )
( )
Elementary school
College
Questionnaire of prevalence for schoolchildren aged 13-14 years
28.9% (p < 0.001 in both cases). A similar pattern is seen for both sexes in this cut.
The annual frequency of episodes of wheezing is listed in Table 3. Comparing the up to three crises subset with the four or more crises group, it is observed that the percentage in the larger number of crises group was significantly greater in 1994-95, when compared with 2002 (Pearsons chi-square, p < 0.001).
Table 3 also details annual frequency of wheezing crises with lost sleep or difficulty speaking. Taking both sexes, the frequency of wheezing affecting sleep was significantly greater in 1994-95 (Pearsons chi-square, p = 0.004), in contrast with crises compromising speech
which was at 4.8% on the first occasion and 4.1% in 2002 (no significant difference).
Looking at the reported cumulative asthma prevalence in terms of maternal education (Table 4), a significant tendency to greater frequency was observed in the categories with more schooling, both in 1994-95 and in 2002. The annual prevalence of wheezing by maternal education presented in a similar manner (Table 4). Taking the number of wheezing crises per year by level of maternal education (Table 4), a significant trend to exhibit four or more crises was observed the more educated the mother during the 1994-95 survey. This trend was not found in 2002.
Table 1 - Cumulative annual prevalence of wheezing, annual prevalence of night cough, without having a cold or a respiratory infection, and exercise triggered wheezing in students aged 13 and 14 years-old (Recife, 1994-95 and 2002)
Period
1994-95 2002
Sex Sex
Wheezing at any Male Female Total * Male Female Total *
time in their life n (%) n (%) n (%) n (%) n (%) n (%)
Present 582 (41.8) 619 (36.6) 1,201 (38.9) 468 (37.8) 578 (37.6) 1,046 (37.7) §
Unanswered 3 (0.2) 2 (0.1) 5 (0.2) 12 (1.0) 11 (0.7) 23 (0.8)
Total 1,392 (100) 1,693 (100) 3,085 (100) 1,238 (100) 1,536 (100) 2,774 (100)
Wheezing in the Male Female Total Male Female Total
last 12 months n (%) n (%) n (%) n (%) n (%) n (%)
Present 300 (21.5) 307 (18.1) 607 (19.7) ¦ 231 (18.6) 299 (19.4) 530 (19.1) ¶
Unanswered 1 (0.1) 0 (0) 1 (0) 17 (1.4) 18 (1.2) 35 (3.3)
Total 1,392 (100) 1,694 (100) 3,086 (100) 1,238 (100) 1,536 (100) 2,774 (100)
Night cough in the Male Female Total ** Male Female Total **
last 12 months n (%) n (%) n (%) n (%) n (%) n (%)
Present 390 (28.0) 563 (33.2) 953 (30.9) 400 (32.3) 633 (41.2) 1,033 (37.2)
Unanswered 5 (0.4) 8 (0.5) 13 (0.4) 23 (1.9) 34 (2.2) 57 (2.1)
Total 1,392 (100) 1,694 (100) 3,086 (100) 1,238 (100) 1,536 (100) 2,774 (100)
Wheezing after Male Female Total §§ Male Female Total §§
exercise in the last 12 months
Present 258 (18.5) 373 (22.0) 631 (20.4) ¦¦ 276 (22.3) 365 (23.8) 641 (23.1) ¶¶
Unanswered 7 (0.5) 11 (0.6) 18 (0.6) 32 (2.6) 50 (3.1) 82 (3.0)
Total 1,392 (100) 1,694 (100) 3,086 (100) 1,238 (100) 1,536 (100) 2,774 (100)
* Considering total of both periods and excluding those who did not answer: Pearson’s χ2, p = 0.447. † Considering total of both periods and excluding those who did not answer: Pearson’s χ2, p = 0.754. ‡ Excluding those who did not answer: prevalence = 39% (95%CI = 37.2-40.7%).
§ Excluding those who did not answer: prevalence = 38% (95%CI = 36.2-39.9%). ¦ Excluding those who did not answer: prevalence = 19.7% (95%CI = 18.3-21.1%). ¶ Excluding those who did not answer: prevalence = 19.4% (95%CI = 17.9-20.9%).
** Considering total of both periods and excluding those who did not answer: Pearson’s χ2, p < 0.001. †† Excluding those who did not answer: prevalence = 31% (95%CI = 29.4-32.7%).
‡‡ Excluding those who did not answer: prevalence = 38% (95%CI = 36.2-39.9%).
§§ Considering total of both periods and excluding those who did not answer: Pearson’s χ2, p = 0.003. ¦¦ Excluding those who did not answer: prevalence = 20.6% (95%CI = 19.2-22.1%).
In Table 5 the number of wheezing crises per year that disturbed sleep or compromised speech is shown by maternal education. There were no observed tendencies linking the two variables in either 1994-95 or 2002.
Table 2 - Cumulative reported prevalence of asthma in students aged 13 and 14 years-old, showing the values by type of school and the total values (Recife, 1994-95 and 2002)
Period
1994-95 2002
Type of Asthma reported Sex Sex
school at any time Male Female Total * Male Female Total *
in their life n (%) n (%) n (%) n (%) n (%) n (%)
Public Present 214 (28.1) 192 (21.3) 406 (24.4) 122 (13.1) 195 (16.2) 317 (14.8)
Unanswered 15 (2.0) 12 (1.3) 27 (1.6) 13 (1.4) 16 (1.3) 29 (1.4)
Total 761 (100) 901 (100) 1,662 (100) 933 (100) 1,207 (100) 2,140 (100)
Private Present 98 (17.0) 104 (14.9) 202 (15.8) § 100 (32.8) 83 (25.2) 183 (28.9) ¦
Unanswered 6 (1.0) 13 (1.9) 19 (1.5) 1 (0.3) 0 (0) 1 (0.2)
Total 577 (100) 698 (100) 1,275 (100) 305 (100) 329 (100) 634 (100)
Both Present 326 (23.4) 317 (18.7) 643 (20.8) ¶ 222 (17.9) 278 (18.1) 500 (18.0) **
Unanswered 13 (0.9) 10 (0.6) 23 (0.7) 14 (1.1) 16 (1.0) 30 (1.1)
Total 1,392 (100) 1,694 (100) 3,086 (100) 1,238 (100) 1,536 (100) 2,774 (100)
* Considering total of both periods and excluding those who did not answer: Pearson’s χ2, p < 0.001 for public schools, p < 0.001 for private schools and p = 0.008 for both types.
† Excluding those who did not answer: prevalence = 24.8% (95%CI = 22.8-27%). ‡ Excluding those who did not answer: prevalence = 15% (95%CI = 13.5-16.6%). § Excluding those who did not answer: prevalence = 16.1% (95%CI = 14.1-18.3%). ¦ Excluding those who did not answer: prevalence = 28.9% (95%CI = 25.4-32.6%). ¶ Excluding those who did not answer: prevalence = 21% (95%CI = 19.6-22.5%). ** Excluding those who did not answer: prevalence = 18.2% (95%CI = 16.8-19.7%).
The addition result of the number of students of public and private schools in 1994-95 is lower than the total for both types because the type of school was not obtained in a small percentage of questionnaires. Source: ISAAC project.
Figure 2 - Maternal educational level of students aged
13 to 14 years-old (Recife, 1994-95 and 2002)
Considering both periods and excluding those who did not answer: Pearson’s χ2 , p < 0.001. Source: ISAAC Project.
429
544
169
286 162
352
200
704
283
941 560
817
College
High school
Incomplete high school
Elementary school
Incomplete elementary school
Has never attended school
2002 1994-95
The association between annual wheezing and reported asthma can be observed in Table 6. For both the reported cumulative asthma prevalence of 21% in 1994-95, and that of 18.2% in 2002, observed sensitivity and positive predictive values are low and specificity and negative predictive value are high for the annual wheezing prevalence. The Youden index was low for both surveys.
Discussion
The cumulative prevalence of reported asthma in Recife was elevated in both surveys. In phase 1 of ISAAC, Brazil was eighth in the ranking out of 56 countries studied. Five Brazilian state capitals were included in phase one, of these Recife exhibited the second greatest prevalence.23 In Latin
America, variations in prevalence were related with climatic conditions. Hot and humid climates (characteristics that Recife has) are associated with greater prevalence.24
The reduction in asthma prevalence reported in Recife differs from international studies,10,11,15-17 in which the
opposite has occurred. In Brazil results are divergent. Fiore et al.25 analyzing schoolchildren in Porto Alegre,
found an increase in the prevalence of the symptoms of asthma and atopic disease. Wandalsen,26 studying pupils
reported asthma prevalence. Also in São Paulo, another survey found that the reported asthma prevalence among adolescents had not increased in a 3-year period.27 The
reduced prevalence in Recife could be attributed to the increase in the proportion of public schools where the poorest students are concentrated. These findings are in agreement with those of Chew et al.,28 who related higher
socioeconomic status with greater prevalence in Thai schoolchildren.
The increase in reported asthma prevalence found in other locations may be the result of an information bias. Doctors who are more alert to a particular problem tend to diagnose more cases.29 One possible factor to be taken into
account in Recife is underdiagnosis. In a survey of one English city the lower socioeconomic strata were observed to have a tendency towards underdiagnosis.30
With respect of prevalence differences between the sexes, the first survey found that the majority of asthmatics were male adolescents and in 2002 the preponderance was female. There is no obvious justification for these findings. International and national surveys conflict.23,27,31
With reference to the prevalence of dyspnea and wheezing having been twice that of reported asthma, one could reflect that, firstly, other conditions may be causing the symptom, such as recurrent viral or parasitic infections, eosinophilic syndromes, and others. Additionally, asthma may be underreported. Siersted et al.32 observed underdiagnosis in
1/3 of cases among schoolchildren in Denmark, and in 2/3 of those who were not diagnosed, doctors were not informed of the symptoms.
Comparing annual wheezing (less subject do recall bias) and reported asthma, low sensitivity, low positive
Table 3 - Number of wheezing crises in the last 12 months and the number of crises in the last 12 months that affected sleep and compromised speech of students aged 13 and 14 years-old (Recife, 1994-95 and 2002)
Period
1994-95 2002
Sex Sex
Number of crises in Male Female Total * Male Female Total *
the last 12 months n (%) n (%) n (%) n (%) n (%) n (%)
None 1,093 (78.5) 1,376 (81.2) 2,469 (80.0) 1,029 (83.1) 1,259 (82.0) 2,288 (82.5)
1 to 3 248 (17.8) 253 (14.9) 501 (16.3) 184 (14.9) 233 (15.2) 417 (15.1)
4 to 12 33 (2.4) 50 (3.0) 83 (2.7) 13 (1.0) 21 (1.4) 34 (1.2)
More than 12 17 (1.2) 15 (0.9) 32 (1.0) 5 (0.4) 7 (0.4) 12 (0.4)
Unanswered 1 (0.1) 0 (0) 1 (0) 7 (0.6) 16 (1.0) 23 (0.8)
Total 1,392 (100) 1,694 (100) 3,086 (100) 1,238 (100) 1,536 (100) 2,774 (100)
Number of crises Male Female Total § Male Female Total §
affecting sleep in the n (%) n (%) n (%) n (%) n (%) n (%)
last 12 months
None 1,191 (85.6) 1,490 (88.0) 2,681 (86.9) 1,111 (89.7) 1,350 (87.9) 2,461 (88.7)
< 1 a week 134 (9.6) 126 (7.4) 260 (8.4) ¦ 80 (6.5) 95 (6.2) 175 (6.3) ¶
> 1 a week 63 (4.5) 77 (4.5) 140 (4.5) ¦ 34 (2.7) 73 (4.7) 107 (3.9) ¶
Unanswered 4 (0.3) 1 (0.1) 5 (0.2) 13 (1.1) 18 (1.2) 31 (1.1)
Total 1,392 (100) 1,694 (100) 3,086 (100) 1,238 (100) 1,536 (100) 2,774 (100)
Number of crises Male Female Total ¶¶ Male Female Total ¶¶
compromising speech n (%) n (%) n (%) n (%) n (%) n (%)
in the last 12 months
Present 74 (5.3) 74 (4.4) 148 (4.8) ** 39 (3.1) 73 (4.7) 112 (4.0)
Unanswered 2 (0.1) 0 (0) 2 (0.1) 6 (0.5) 15 (1.0) 21 (0.8)
Total 1,392 (100) 1,694 (100) 3,086 (100) 1,238 (100) 1,536 (100) 2,774 (100)
* Considering total of both periods and excluding those who did not answer: Pearson’s χ2, p < 0.001.
† Excluding those who did not answer: prevalence = 16.3; 2.7; and 1% (95%CI = 15-176%; 2.2-3.3%; and 0.7-1.5%), respectively. ‡ Excluding those who did not answer: prevalence = 15.2; 1.2; and 0.4% (95%CI = 13.8-16.6%; 0.9-1.7%; and 0.2-0.8%), respectively. § Considering total of both periods and excluding those who did not answer: Pearson’s χ2, p = 0.004.
¦ Excluding those who did not answer: prevalence = 8.4; and 4.6% (95%CI = 7.5-9.5%; and 3.8-5.4%), respectively. ¶ Excluding those who did not answer: prevalence = 6.4; and 3.9% (95%CI = 5.5-7.4%; and 3.2-4.7%), respectively. ¶¶ Considering total of both periods and excluding those who did not answer: Pearson’s χ2, p = 0.177.
** Excluding those who did not answer: prevalence = 4.8% (95%CI = 4.1-5.6%). †† Excluding those who did not answer: prevalence = 4.1% (95%CI = 3.4-4.9%).
predictive value and low Youden index were observed. Specificity and negative predictive value were, however, elevated.33 In general, the accuracy of a measure is
tested against a gold standard. In the absence of such, clinical history is sufficient for an epidemiological diagnosis of asthma.33 Nevertheless, this review only covered
studies in the English, German, Danish and Italian languages. This being the case, their conclusions are not applicable to Portuguese-speaking countries. Using a subset of 209 schoolchildren subjected to pulmonary function tests, Camelo-Nunes et al.27 also found a low
level of accuracy for diagnosis by symptoms.
The increase in the prevalence of nocturnal cough in 2002 is in contrast with the reduction in reported asthma. It is possible that in Recife, where respiratory infections (which present with coughing) are common, this question has not been precise enough as the central committee for ISAAC itself points out.23
For epidemiological purposes, exercise challenge tests are questionable for the diagnosis of exercise-induced asthma.35 Comparing the responses to the ISAAC
questionnaires with bronchial hyperresponsivity from exercise, Ponsonby et al.36 found that, in Tasmanian
children, sensitivity and specificity were 60 and 77%,
Table 4 - Reported cumulative asthma prevalence, wheezing in the last 12 months and number of wheezing crises in the last 12 months in terms of maternal educational level of students aged 13 and 14 years-old (Recife, 1994-95 and 2002)
Period
1994-95 2002
Asthma at any time in their life Asthma at any time in their life
Educational Present Absent Prevalence Present Absent Prevalence
level n* (%) n (%) (%) n (%) n (%) (%)
Has never attended school 31 (5.2) 164 (7.5) 15.9 33 (6.8) 249 (11.6) 11.7
Incomplete elementary school 92 (15.5) 609 (27.9) 13.1 133 (27.4) 796 (37.2) 14.3
Elementary school 66 (11.1) 281 (12.9) 19.0 45 (9.2) 240 (11.2) 15.2
Incomplete high school 28 (4.7) 132 (6.1) 21.2 31 (6.4) 136 (6.4) 18.6
High school 152 (25.5) 406 (18.6) 27.2 117 (24.1) 419 (19.6) 21.8
College 226 (38.0) 588 (27.0) 27.8 127 (26.1) 299 (14.0) 29.8
Total 595 (100) 2,180 (100.0) 21.4 486 (100) 2,139 (100) 18.5
Wheezing in the last 12 months Wheezing in the last 12 months
Educational Present Absent Prevalence Present Absent Prevalence
level n (%) n (%) (%) n § (%) n (%) (%)
Has never attended school 32 (5.9) 168 (7.5) 16.0 42 (8.1) 237 (11.2) 15.0
Incomplete elementary school 116 (21.2) 588 (26.2) 16.5 182 (35.2) 753 (35.7) 19.5
Elementary school 67 (12.2) 285 (12.7) 19.0 49 (9.5) 235 (11.1) 17.2
Incomplete high school 26 (4.8) 136 (6.0) 16.0 30 (5.8) 136 (6.5) 18.1
High school 127 (23.2) 432 (19.2) 22.7 115 (22.2) 424 (20.1) 21.3
College 179 (32.7) 638 (28.4) 21.9 99 (19.2) 324 (15.4) 23.4
Total 547 (100) 2,247 (100) 19.6 517 (100) 2,109 (100) 19.7
Number of crises in the last 12 months Number of crises in the last 12 months
Educational Four Up to Prevalence Present Up to Prevalence
level or more three of four n¶ (%) three of four
n ¦(%) n (%) or more (%) n (%) or more (%)
Has never attended school 3 (3.0) 30 (6.6) 9.1 1 (2.2) 33 (8.1) 2.9
Incomplete elementary school 18 (18.2) 98 (21.5) 15.5 14 (30.4) 137 (33.7) 9.3
Elementary school 10 (10.1) 61 (13.4) 14.9 5 (10.9) 38 (9.4) 11.6
Incomplete high school 2 (2.0) 24 (5.3) 7.7 4 (8.7) 25 (6.2) 13.8
High school 30 (30.3) 97 (21.3) 23.6 7 (15.2) 94 (23.1) 6.9
College 36 (36.4) 145 (31.9) 19.9 15 (32.6) 79 (19.5) 16.0
Total 99 (100) 455 (100) 17.9 46 (100) 406 (100) 10.2
Table 5 - Number of wheezing crises in the last 12 months affecting sleep and compromising speech in terms of the maternal educational level of students aged 13 and 14 years-old (Recife, 1994-95 and 2002)
Period
1994-95 2002
Number of crises affecting sleep Number of crises affecting sleep
in the last 12 months in the last 12 months
Educational Present Absent Prevalence* Present Absent Prevalence
level n* (%) n (%) (%) n* (%) n (%) (%)
Has never attended school 29 (8.2) 170 (7.0) 14.6 26 (9.4) 255 (10.8) 9.2
Incomplete elementary school 86 (24.5) 616 (25.3) 12.2 108 (38.8) 830 (35.3) 11.5
Elementary school 44 (12.5) 308 (12.6) 12.5 31 (11.2) 253 (10.8) 10.9
Incomplete high school 18 (5.1) 144 (5.9) 11.1 17 (6.1) 149 (6.3) 10.2
High school 80 (22.7) 478 (19.6) 14.3 54 (19.4) 485 (20.6) 10.0
College 95 (27.0) 722 (29.6) 11.6 42 (15.1) 381 (16.2) 9.9
Total 352 (100) 2,438 (100) 12.6 278 (100) 2,353 (100) 10.6
Number of crises compromising speech Number of crises compromising speech
in the last 12 months in the last 12 months
Educational Present Absent Prevalence Present Absent Prevalence§
level n* (%) n (%) (%) n* (%) n (%) (%)
Has never attended school 12 (9.4) 188 (7.1) 6.0 11 (10.2) 271 (10.7) 3.9
Incomplete elementary school 36 (28.1) 668 (25.1) 5.1 46 (42.6) 890 (35.2) 4.9
Elementary school 19 (14.8) 333 (12.5) 5.4 13 (12.0) 273 (10.8) 4.5
Incomplete high school 4 (3.1) 158 (5.9) 2.5 9 (8.3) 157 (6.2) 5.4
High school 29 (22.7) 529 (19.8) 5.2 17 (15.8) 524 (20.7) 3.1
College 28 (21.9) 789 (29.6) 3.4 12 (11.1) 413 (16.4) 2.8
Total 128 (100) 2,665 (100) 4.6 108 (100) 2,528 (100) 4.1
* Considering both groups: χ2 of trend, p = 0.711. † Considering both groups: χ2 of trend, p = 0.555. ‡ Considering both groups: χ2 of trend, p = 0.080. § Considering both groups: χ2 of trend, p = 0.078. Source: ISAAC project.
Table 6 - Wheezing prevalence in the last 12 months according to the reported cumulative asthma prevalence with the respective diagnostic tests of students aged 13 and 14 years-old (Recife, 1994-95 and 2002)
* Pearson’s χ2, p < 0.001.
† Pearson’s χ2, p < 0.001. Sensitivity % (95%CI): 1994-95 = 51.8 (47.9-55.6); 2002 = 46 (41.6-50.4). Especificity % (95%CI): 1994-95 = 88.8 (87.6-90.1); 2002 = 86.8 (85.4-88.2). Positive predictive value % (95%CI): 1994-95 = 55.2 (51.2-59.2); 2002 = 43.6 (39.4-47.9). Negative predictive value % (95%CI): 1994-95 = 87.4 (86.1-88.7); 2002 = 87.9 (85.5-89.3). Absolute Youden index (limits): 1994-95 = 0.41 (0.37-0.45); 2002 = 0.33 (0.28-0.37). Source: ISAAC project.
Period
1994-95 2002
Asthma at any time in their life* Asthma at any time in their life
Wheezing in the last Present Absent Present Absent
12 months n* (%) n (%) n (%) n (%)
Present 333 (51.8) 270 (11.2) 226 (46.0) 292 (13.2)
Absent 310 (48.2) 2,149 (88.8) 265 (54.0) 1,927 (86.8)
respectively, and concluded that the questionnaire was accurate. In the current study this variable also altered differently from reported asthma.
Frequent and severe crises indicate the need for long term pharmacotherapy.1-4 Both the number of students
suffering frequent wheezing episodes (four crises or more) and episodes disturbing sleep reduced in proportion with reported asthma. The prevalence of crises that interfered with speech, however, did not change over time. It is possible that the severity of the disease has altered, with severe crises (affecting speech) having grown in proportion. The study design, however, does not allow this question to be studied in depth.
In contrast to the reported asthma prevalence, maternal education was not related to asthma severity, as has been observed by several authors.10,28,37-40 There
is no explanation for the finding. According to Rona,18
poverty is not a risk factor for the appearance of asthma, but an aggravating factor. With respect of what has been observed in Recife, it is possible that asthma really is more prevalent among children and adolescents from families in better socioeconomic conditions, as was observed by Chew et al.28 Another aspect to be taken into
consideration is underdiagnosis being more common among individuals in worse socioeconomic conditions.30 A
third factor could be the presence of other determinants other than atopic disease in poor communities. Faniran et al.41 studied children from 8 to 11 years old in Ojo
(Nigeria) and in Sidney (Australia) and found that wheezing and coughing were more prevalent in Nigeria, but that there were no significant differences in terms of atopic disease. The findings obtained in Recife are in agreement with the hygiene theory.1 That is, adolescents of a lower
socio-economic level would have had, at an early age, more contact with infectious agents, making them less susceptible to atopic disease. One could also, however, make the interpretation that asthmatics miss school more often, as observed in the United States in 1994-95,42 and
this absenteeism would be more common among the poor, the results therefore reflecting less asthmatics than expected. The complexity of defining socioeconomic status should also be taken into account, and maternal schooling, while being associated with the nutritional status of children from the Northeast of Brazil,43,44 may not be
sufficiently accurate when used as a single indicator.
Further limitations: in Brazil a significant proportion of children do not attend school. The sample is not, therefore, representative of the citys children. Furthermore, video-questionnaires were not used in the surveys in Recife, which could possibly have improved the quality of the responses.
Summing up, this study offers new and relevant insights into the high prevalence of asthma in our region, alerting health planners to prioritize resources for its control and clinicians to be more aware of the problem.
References
1. National Institute of Health, National Heart, Lung and Blood Institute. Global initiative for asthma. Global strategy for asthma management and prevention. NHLBI/WHO workshop report. Bethesda: National Heart, Lung and Blood Institute. National Institutes of Health, US Department of Health and Human Services; 2002.
2. Warner JO, Niejens HJ, Landau LI, Jones K, Asher MI, Rachelefski GS, et al. Asthma: a follow up statement from an international paediatric asthma consensus group. Arch Dis Child. 1992;67: 240-9.
3. Warner JO, Naspitz CK, Cropp GJA. Third international pediatric consensus statement on the management of childhood asthma. Pediatr Pulmonol. 1998;25:1-17.
4. Pereira CAC, Naspitz C, Sole D, Cruz A, Fernandes ALG, Marques FE, et al. II Consenso Brasileiro de Manejo da Asma. J Pneumol. 1998;24:171-276.
5. ISAAC Steering Committee. Worldwide variation in prevalence of symptoms of asthma, allergic rhinoconjuntivitis and atopic eczema: ISAAC. Lancet. 1998;351:1225-32.
6. Sole D, Yamada E, Vana AT, Werneck G, Solano de Freitas L, Sologuren MJ, et al. International Study of Asthma and Allergies in Childhood (ISAAC): prevalence of asthma and asthma-related symptoms among Brazilian schoolchildren. J Investigat Allergol Clin Immunol. 200;111:123-8.
7. Britto MCA, Bezerra PGM, Ferreira OS, Maranhão ICV, Trigueiro GA. Asthma prevalence in school children in a city of Northeast of Brazil. Ann Trop Paed. 2000;20:95-100.
8. Chatkin M. Prevalência e fatores de risco para asma nas crianças da coorte de 1993, Pelotas, RS [dissertação]. Pelotas: Universidade Federal de Pelotas; 1999.
9. Taylor WR, Newacheck PW. Impact of childhood asthma on health. Pediatrics. 1992;90:657-62.
10. Sologuren MJJ, Silveira HL, Calil Jr JA. Associação entre asma, rinite alérgica e eczema, utilizando-se o protocolo ISAAC. R Bras Alergol Imunopatol. 2000;23:111-7.
11. Camargos PAM, Castro RM, Feldman JS. Prevalence of symptoms related to asthma among schoolchildren in Campos Gerais, Minas Gerais, Brazil. Rev Pan Salud Publ. 1999;6:8-15. 12. Werneck G, Ruiz S, Hart R, White M, Romieu I. Prevalence of
asthma and other childhood allergies in Brazilian schoolchildren. J Asthma. 1999;36:677-90.
13. Gergen PJ, Mullally DI, Evans R. National survey of prevalence of asthma among children in the United States, 1976 to 1980. Pediatrics. 1988;81:1-7.
14. Burney PGJ, Chinn S, Rona RJ. Has the prevalence of asthma increased in children? Evidence from the national study of health and growth 1973-86. BMJ. 1990;300:1306-10.
15. Upton MN, McConnachie A, McSharry C, Hart CL, Smith GD, Gillis CR, et al. Intergenerational 20 year trends in the prevalence of asthma and hay fever in adults: the Midspan family study surveys of parents and offspring. BMJ. 2000;321:88-92. 16. Robertson CF, Bishop J, Sennhauser FH, Mallol J. International
comparison of asthma prevalence in children: Australia, Switzerland, Chile. Pediat Pulmonol. 1993;16:219-26. 17. Shaw RA, Crane J, ODonnell TV, Porteous LE, Coleman ED.
Increasing asthma prevalence in a rural New Zealand adolescent population: 1975-89. Arch Dis Child. 1990;65:1319-23. 18. Rona RJ. Asthma and poverty. Thorax. 2000;55:239-44. 19. Prefeitura da Cidade do Recife. Secretaria de Planejameneto
urbano e ambiental. Situação econômica e Social do Recife. Recife; 1993.
20. CPRH - Companhia pernambucana de controle da poluição ambiental e de administração de recursos hídricos. Estimativa de emissões de poluentes atmosféricos provenientes de fontes estacionárias. Área de estudo: região metropolitana do Recife. Recife; 1994.
21. IBGE - Instituto Brasileiro de Geografia e Estatística. Censo brasileiro, 2000. Disponível em: http://www.ibge.gov.br. 22. Sole D, Vanna AT, Yamada E, Rizzo MC, Naspitz CK. International
23. ISAAC Steering Committee. Worldwide variations in prevalence of asthma symptoms: the International Study of Asthma, and Allergies in Childhood (ISAAC). Eur Respir J. 1998;12:315-35. 24. Mallol J, Solé D, Asher I, Clayton T, Stein R, Soto-Quiroz M, on behalf of the Latin American ISAAC Collaborators. Prevalence of asthma symptoms in Latin America: The International Study of Asthma and Allergies in Childhood (ISAAC). Pediat Pulmonol. 2000;30:349-54.
25. Fiore RW, Comparsi AB, Reck CL, Oliveira JK, Pampanelli KB, Fritscher CC. Variação na prevalência de asma e atopia em um grupo de escolares de Porto Alegre, Rio Grande do Sul. J Pneumol. 2001;27:237-42.
26. Wandalsen G. Prevalência e fatores de risco para asma e doenças alérgicas em escolares da região centro-sul do município de São Paulo. São Paulo [dissertação]. São Paulo: Universidade Federal de São Paulo; 2003.
27. Camelo-Nunes IC, Wandalsen GF, Melo KC, Naspitz CK, Sole D. Prevalência de asma e de sintomas relacionados entre escolares de São Paulo, Brasil: 1996 a 1999 Estudo da reatividade brônquica entre adolescentes asmáticos e não asmáticos International Study of Asthma and Allergies in Childhood (ISAAC) Rev Bras Alerg Imunopatol. 2001;24:77-89.
28. Chew FT, Goh DYT, Lee BW. Under-recognition of childhood asthma in Singapore: evidence from a questionnaire survey. Ann Trop Paed. 1999;19:83-91.
29. Magnus P, Jaakkola JJK. Secular trend in the occurrence of asthma among children and young adults: critical appraisal of repeated cross sectional surveys. BMJ. 1997;314:1795-99. 30. Kwong GNM, Das C, Proctor AR, Whyte MK, Primhak RA.
Diagnostic and treatment behaviour in children with chronic respiratory symptoms: relationship with socioeconomic factors. Thorax. 2002;57:701-4.
31. Venn A, Lewis S, Cooper M, Hill J, Britton J. Questionnaire study of effect of sex and age on the prevalence of wheeze and asthma in adolescence. BMJ. 1998;316:1945-6.
32. Siersted HC, Mostgaard G, Hyldebrandt N, Hansen HS, Boldsen J, Oxhoj H. Interrelationships between diagnosed asthma, asthma-like symptoms, and abnormal airway behaviour in adolescence: the Odense Schoolchild Study. Thorax. 1996;51: 503-9.
33. Pekkanen J, Pearce N. Defining asthma in epidemiological studies. Eur Respir J. 1999;14:951-7.
34. Powell CV, White RD, Primhak RA. Longitudinal study of free running exercise challenge: reproducibility. Arch Dis Child. 1996;74:108-14.
Corresponding author: Murilo C. A. de Britto
Instituto Materno-Infantil de Pernambuco (IMIP) Rua dos Coelhos, 300
CEP 50070-550 - Recife, PE Brazil
Phone: +55 (81) 9971.6424 Fax: +55 (81) 2122.4122 E-mail: murilo.britto@bol.com.br
35. Ponsonby AL, Couper D, Dwyer T, Carmichael A, Wood-Baker R. Exercise-induced bronchial hyperresponsiveness and parental ISAAC questionnaire responses. Eur Respir J. 1996;9:1356-62. 36. Burr ML, Verrall C, Kaur B. Social deprivation and asthma. Respir
Med. 1997;91:63-8.
37. Gottlieb DJ, Beiser AS, OConnor GT. Poverty, race, and medication use are correlates of asthma hospitalization rates. A small area analysis in Boston. Chest. 1995;108:28-35. 38. Mielck A, Reitmeir P, Wjst M. Severity of childhood asthma by
socioeconomic status. Int J Epidemiol. 1996;25:388-93. 39. Watson JP, Cowen P, Lewis RA. The relationship between
asthma admission rates, routes of admission, and socioeconomic deprivation. Eur Respir J. 1996;9:2087-93.
40. Faniran AO, Peat JK, Woolcock AJ. Prevalence of atopy, asthma symptoms and diagnosis, and the management of asthma: comparison of an afluent and a non-afluent country. Thorax. 1999;54:606-10.
41. Newcheck PW, Halfon N. Prevalence, impact and trends in childhood disability due to asthma. Arch Pediat Adolesc Med. 2000;154:287-93.
42. Benício MHA, Latorre MRDO, Rosa TE, Nazario CL, Monteiro CA. Modelos estatísticos de predição da prevalência da desnutrição infantil: desenvolvimento e aplicação para o conjunto dos municípios brasileiros. Relatório Técnico; 1995.