USING GENEALOGY TO IMPROVE SELECTION
EFFICIENCY OF PEDIGREE METHOD
José Airton Rodrigues Nunes1; Alexsander Luís Moreto2; Magno Antonio Patto Ramalho2*
1
UFPI/DPPA - C.P. 215 - 64049-550 - Teresina, PI - Brasil. 2
UFLA - Depto. de Biologia, C.P. 3037 - 37200-000 - Lavras, MG - Brasil. *Corresponding author <magnoapr@ufla.br>
ABSTRACT: In the pedigree method of conducting an autogamous population of segregating plants, the genealogy of the progenies is registered. Although labor-intensive, these data are rarely used. One possibility of exploiting this information is to improve selection efficiency using BLUP (Best Linear Unbiased Prediction). In this study BLUP with genealogy inclusion was compared to the mean in the progenies evaluation conducted by the pedigree method. Progenies of crosses of the common bean lines BRS MG Talismã and BRS Valente in F4:6 and F4:7 were used. The 256 F4:6 progenies were sown in February 2005, in southeast of Brazil, in a 16 × 16 simple lattice design. The grain yield data were subjected to BLUP analysis with inclusion of genealogy. Based on this analysis and the mean, the 30 progenies with best and worst performance were selected. These 60 F4:7 progenies were classified in relation to the origin, i.e., selected by BLUP, mean, or BLUP and mean and coincident results were obtained. In the selection for best performance, the efficiency of BLUP was 2.4% higher than the mean. In the selection for the opposite extreme, BLUP analysis was however not advantageous. The progenies × environments interaction indicates the need for an evaluation of the progenies in different environments before beginning selection.
Key words: BLUP, selection method, bean improvement, heritability, quantitative genetics
EMPREGO DA GENEALOGIA PARA MELHORAR EFICIÊNCIA
SELETIVA NO MÉTODO
PEDIGREE
RESUMO: No método do pedigree de condução de população segregante de plantas autógamas, é anotado a genealogia das progênies. Contudo, normalmente essa informação embora trabalhosa, não é utilizada. Uma das opções é usar esta informação para melhorar a eficiência da seleção empregando o BLUP (Best Linear Unbiased Prediction). Nesse trabalho, foi comparado BLUP com a inclusão de genealogia em relação à média na avaliação de progênies conduzidas pelo método genealógico. Para isto foram utilizadas progênies F4:6 e F4:7 do cruzamento entre as linhagens de feijão BRS MG Talismã e BRS Valente. As 256 progênies F4:6 foram semeadas em fevereiro de 2005, no sudeste do Brasil, no delineamento látice simples 16 × 16. Os dados de produtividade de grãos foram submetidos à análise do BLUP com inclusão da genealogia. A partir dessa análise, e considerando a média, foram selecionadas as 30 progênies com melhor e pior desempenho. Essas 60 progênies F4:7 foram novamente avaliadas e verificada a coincidência na classificação em função da origem, isto é, selecionadas pelo BLUP, média ou BLUP e média. Constatou-se que na seleção efetuada para melhor desempenho o BLUP apresentou eficiência 2,4% acima da obtida com a média, contudo, na seleção efetuada no extremo oposto, não houve vantagem da análise com BLUP. A ocorrência de interação progenies × ambientes evidencia a necessidade de se realizar a avaliação das progênies em alguns ambientes antes de se proceder à seleção.
Palavras-chave: BLUP, métodos de seleção, melhoramento do feijoeiro, herdabilidade, genética quantitativa
INTRODUCTION
The success of improvement in the develop-ment of plants with higher grain yield, fruits and fiber is evident. However, the continuously increasing de-mand calls for further genetic progress in the future. Continuous success in selection programs depends on the use of all improvement strategies available.
the mixed model analysis, as proposed by Henderson in 1959, is well-suited since this information on ge-netic progeny similarity is considered for selection pur-poses (Resende, 2002). The progenies are thus se-lected based on their genetic estimates that take not only the performance per se into account, but the per-formance of related progenies as well. These estimates represent the Best Linear Unbiased Prediction - BLUP (Henderson, 1975).
The advantageous effect of the inclusion of parentage information in plant improvement has been described elsewhere (Panter & Allen, 1995; Bromley et al., 2000). In a simulation study with F4:5 progenies conducted by the pedigree method, Nunes (2006) evi-denced that the BLUP procedure, considering the par-entage, proved advantageous over selection based on the phenotypic mean, especially in conditions of low heritability. This information was however not corrobo-rated by experimental data.
This study aimed to compare the selection ef-ficiency of BLUP including genealogy information to the phenotypic mean of common bean progenies, con-ducted by the pedigree method.
MATERIAL AND METHODS
The experiment was conducted in Lavras, state of Minas Gerais, Brazil (21º14’S, 40º17’W, 918 m asl). Two cultivars were used as parents of the segregating common bean population: BRS MG Talismã, of inde-terminate growth habit (type III), with cream-colored seeds with light brown stripes, resistant to
Colletotrichumlindemuthianum (pathotypes 65, 67, 73, 75, 81, 83, 89, 95, and 117), to the bean common mo-saic virus (BCMV) and with intermediate resistance to angular leaf spot; and secondly BRS Valente, with inde-terminate growth habit (type II), black grain, resistant to anthracnose (pathotypes 89, 95, 453, and 585) and BCMV, and intermediate resistant to angular leaf spot.
F1 seeds were obtained through artificial crosses of the above described parents, performed in a greenhouse (Peternelli & Borém, 1999). The F1 and F2 plants were grown under field conditions. The fol-lowing generations up to the F4:5 progenies were con-ducted by the pedigree method as follows: 64 F2 plants were collected individually generating 64 F2:3 progenies that were sown in rows in the following growing sea-son. Two plants of each F2:3 progeny were randomly collected, which originated the 128 F3:4 progenies. In turn, these were sown again and two plants per row originated the 256 F4:5 progenies.
The F4:5 progenies were planted in a row and 256 F4:6 progenies were bulk-harvested which were sown in February 2005 and evaluated in the dry
sea-son. The experimental design was a 16 × 16 simple lat-tice. The experimental plots consisted of 2 m long rows, spaced 50 cm apart, with 15 seeds per meter. The other cultural treatments were the regionally applied for com-mon bean. The evaluated trait was grain yield.
The data were analyzed in two ways: by the conventional approach with analysis of variance, us-ing the followus-ing statistical model:
yijk = µ + rj + bk(j) + ai + eijk, where: yijk: observation of the plot that received progeny i in block k within rep-lication j (i=1,2,...,256; j=1,2; k=1,2,...,16); µ: con-stant associated to all observations; rj:fixed effect of replication j; bk(j): random effect of block k within rep-lication j; ai: random effect of progeny i; eijk: random experimental error associated to observation yijk.
The second approach focused on the mixed model. For this purpose, the previous statistical model was re-expressed in the matrix form by:
y = Xβ + Z1b + Z2a + e, where: y: vector of pheno-typic data of the plots, in the dimensions 512 × 1; X: matrix of the model of the fixedeffects βββββ, dimensions 512 × 3; βββββ: vector of the fixed effects, 3 × 1; Z1: ma-trix of the model of the random effects of blocks within replications b, 512 × 32; b: vector of the ran-dom effects of blocks within replications, 32 × 1, with
(
2)
b
I , 0 N
~ σ
b ; Z2: matrix of the model of the random effects of progenies a, 512 × 256; a: vector of the ran-dom effects of the progenies, 256 × 1, with
( )
0,G N ~a , where G isthe matrix of genetic additive covariances between the random progeny effects; e: error vector, dimensions 512 × 1, with e~N
( )
0,R , where 2e
I R= σ .
The genetic additive matrix of covariances be-tween the random effects of progenies (matrix G) can be determined by the matrix of genetic additive par-entage between the progenies multiplied by the com-ponent of variance associated to these random effects - 2
a
A
G= σ (Mrode, 1996; Lynch & Walsh, 1998). According to the described conduction of the segre-gating population, each F2 plant generated four related F4:6 progenies, provided that the F2 generation is as-sumed in equilibrium. Based on this known genealogy of the F4:6 progenies, the coefficients of additive par-entage were thus determined, as well as elements of matrix A, which correspond to twice Malecot’s coancestry coefficient of the progenies. For the F4:6 progenies, matrix A is therefore given by:
A=I64⊗,
⎥ ⎥ ⎥ ⎥
⎦ ⎤
⎢ ⎢ ⎢ ⎢
⎣ ⎡
875 . 1 50 . 1 00 . 1 00 . 1
50 . 1 875 . 1 00 . 1 00 . 1
00 . 1 00 . 1 875 . 1 50 . 1
00 . 1 00 . 1 50 . 1 875 . 1
The statistical analyses were performed using the Mixed procedure of the SAS 8.0 software pack-age (Littlel et al., 1996; SAS, 1999). After the data analysis of the F4:6 progenies, 60 progenies (30 with best and 30 with worst performance) were selected by the mean and by BLUP. These 60 progenies, as well as the F4:7 generation and four controls (BRS MG Talismã, BRS Valente, VC-3 and OP-NS 331) were evaluated again in a field experiment in the wet sea-son sown in November 2005, in an 8 × 8 triple lattice design. The plots had two rows of two meters, spaced 50 cm apart. The management was similar to the pre-vious and grain yield data were obtained. The men-tioned model was also used in the subsequent analy-sis of variance. Based on the joint analyanaly-sis of the F4:6 and F4:7 progenies, the components of the progenies ´ generations interaction were partitioned, as shown by Cruz et al. (2004).
For the F4:6 as well as the F4:7 progenies the components of genetic variance were estimated based on the mean square expectations. The confidence intervals (CI) associated to the estimates of the genetic variance components were estimated based on the following expression (Ramalho et al., 2005):
(
1)
100%2 2 / 1
2 2
2 2 /
2
α χ
σ σ
χ σ
α α
− = ⎥ ⎥ ⎦ ⎤ ⎢
⎢ ⎣ ⎡
< < =
− p p
p V
V P
CI ,
where: α: 0.05 level of significance;
σ
ˆ
2p: estimate ofgenetic variance in progenies;
V
: number of degrees of freedom associated to componentσ
ˆ
2p, which was obtained according to Satterthwaite (1946);χ
α2/2 and2 2 / 1α
χ− : superior quantiles tabled in the χ2 (Chi-square)
distribution for V degrees of freedom.
Furthermore, the heritability
( )
ˆ2h for selection in the progeny mean was estimated based on the mean square expectations of the analysis of variance (Vencovsky & Barriga, 1992). The errors associated to the estimate were determined according to Knapp et al. (1985).
RESULTS AND DISCUSSION
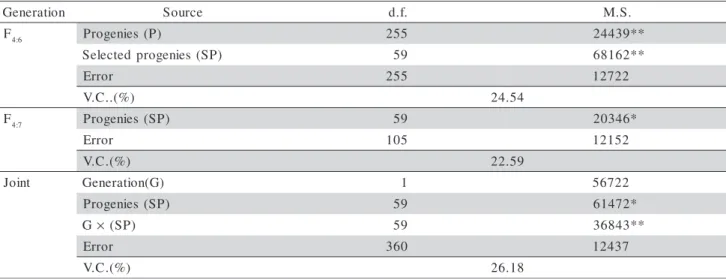
Differences (P≤ 0.01) were verified between the F4:6 progenies regarding grain yield (Table 1). The significance of the effect of progenies was reinforced by the genetic and phenotypic parameter estimates of this generation (Table 2). The estimate of the genetic variance in F4:6 progenies is different from zero, with a lower positive limit. The lower limit of h2 is positive, which allowed the conclusion that it is also different from zero, with 95% probability. The h2 estimate was higher than 47%. The heritability can be considered as in the narrow sense, since dominance variance σD2 is o f little relevance in autogamous crops (Van Oeveren & Stam, 1992). In the particular case of common bean, contribution of σD2 to the genetic variance in grain yield is low (Moreto et al., 2007). Moreover, only 31/256 of (σD2) present in F2 is exploited in F4:5 progenies.
Different h2 estimates for common bean grain yield have been proposed in the literature. In a data col-lection (including 22 estimates) the mean estimate of this parameter was 32% (Moreto et al., 2007). A compari-son of h2
estimates is not easy, owing to variations due to the progeny type and the experimental conditions. Still, the h2 value obtained here (47%) with F4:6 progenies was higher than the estimated mean based on the revision (Table 2). These results evidence the possibility of suc-cess with selection in this segregating population, which was a basic condition for the conduction of this study.
n o i t a r e n e
G Source d.f. M.S.
F4:6 Progenies (P) 255 24439**
) P S ( s e i n e g o r p d e t c e l e
S 59 68162**
r o r r
E 255 12722
) % ( . . C .
V 24.54
F4:7 Progenies (SP) 59 20346*
r o r r
E 105 12152
) % ( . C .
V 22.59
t n i o
J Generation(G) 1 56722
) P S ( s e i n e g o r
P 59 61472*
G× (SP) 59 36843**
r o r r
E 360 12437
) % ( . C .
V 26.18
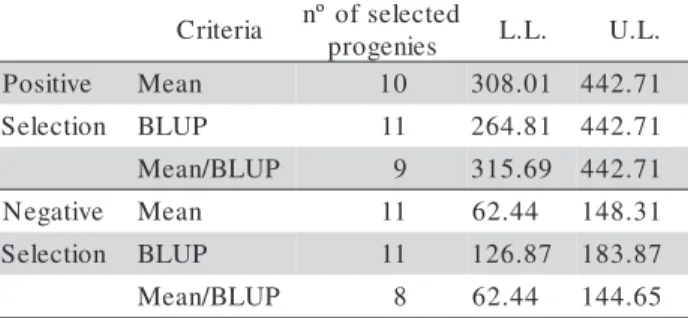
The BLUP method was applied together with the genealogy, in the hope of improving the selection efficiency as suggested elsewhere (Lynch & Walsh, 1998; Resende, 2002). Considering the results of BLUP as well as the means, the 30 best and 30 worst-per-forming progenies were identified (Table 3). Remark-ably, of this total, nine of the best progenies were se-lected by both procedures (mean and BLUP), only eleven by the BLUP and ten by the mean. Thus, 20 best-performing progenies were selected in the BLUP and 19 with the mean. In the negative sense the pro-portions were similar. In this way it was possible to evaluate the efficiency of the mean and of the BLUP in the selection process under similar conditions. Fur-thermore, in terms of mean grain yield the progenies selected by BLUP and those by the mean did not co-incide particularly well, especially regarding the worst-performing progenies for both selection criteria (Table 3).
The analysis of joint variance of the common progenies presented significant differences between progenies (Table 1). Moreover, the effect of the prog-enies × generations interaction was significant (P ≤
0.01). The estimate of the genetic correlation between the progeny means in both generations (rg = 0.59) was not high, indicating that the progeny performance was not coincident in the two environments. Even in the
s r e t e m a r a
P Estimates L.L.1/ U.L.
1 6 . 8 5 8
5 3249.71 13569.45
9 1 . 2 2 7 2
1 10773.46 15255.07
% 4 9 . 7
4 33.42 59.30
Table 2 - Estimates of genetic variance in progenies (σ2p );
residual variances (σe2); heritability in the
progeny means ( 2 r
h ) for the trait grain yield (g per plot) of the F4:6 progenies conducted by the pedigree method.
1/ L.L : lower limit; U.L : upper limits 2
p
σ
2 e
σ
2 r
h
a i r e t i r
C nºofselected s e i n e g o r
p L.L. U.L.
e v i t i s o
P Mean 10 308.01 442.71
n o i t c e l e
S BLUP 11 264.81 442.71
P U L B / n a e
M 9 315.69 442.71
e v i t a g e
N Mean 11 62.44 148.31
n o i t c e l e
S BLUP 11 126.87 183.87
P U L B / n a e
M 8 62.44 144.65
Table 3 - Number of progenies selected by the mean, BLUP, mean/BLUP and their respective lower (L.L.) and upper limits (U.L.) of grain yield in the F4:6 generation.
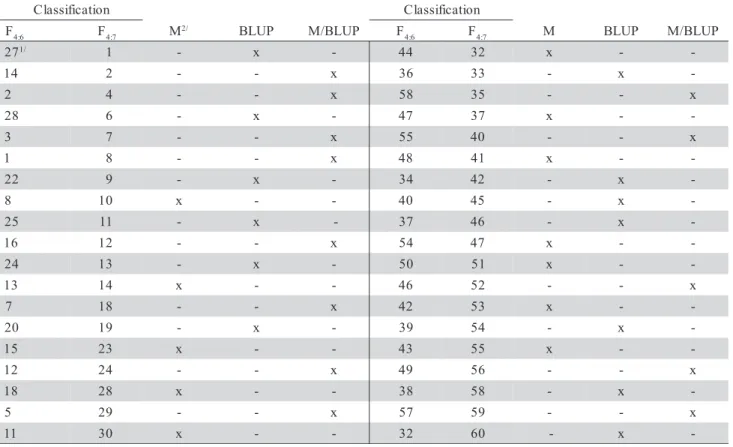
case of the progenies performance coincided in the se-lection, their classification was different (Table 4). The occurrence of progenies × environments interaction in common bean is well-documented (Carneiro et al., 2002; Pereira, 2003; Aguiar et al., 2004).
The main focus of this study was to verify whether there is any difference between the BLUP method and the progeny means. Among the 30 su-perior and 30 inferior progenies selected in the F4:6, 19 coincided in both groups in the following genera-tion (F4:7). Of the progenies identified as superior in F4:6, by the mean as much as by BLUP, 88.9% were also among the 30 best in F4:7. On the other hand, the coincidence for those identified by the BLUP or by the mean only was lower. Considering the selec-tion of the 20 F4:6 progenies by the BLUP, 14 coin-cided (70.0%). By the mean however, of the 19 prog-enies identified among the 30 best in F4:6, 13 coin-cided with good performance in F4:7 (68.4%). Con-sequently, the BLUP presented an efficiency of only 2.4% over the mean. However, in the selection for the opposite extreme, the efficiency was the same (Table 5).
BLUP is particularly recommended when there is an imbalance and/or covariances between genotypes. In the case of the evaluations of progenies in autogamous plants the imbalance is hardly ever sig-nificant. In this situation the results of the BLUP are equivalent to the mean for non-related genotypes (Bernardo, 2002). However, since the genealogy of the progenies makes it possible to measure the par-entage among the progenies in the pedigree method of conducting segregating populations, its use in the BLUP would be a possibility to increase the selec-tion efficiency, justifying the collecselec-tion of this infor-mation.
According to the simulation, the advantage in the selection accuracy of BLUP over the mean in-creases with the reduction of h2 (Nunes, 2006). With a h2
ACKNOWLEDGEMENTS
To the CNPq and CAPES for the scholarships.
REFERENCES
AGUIAR, M.S.; RAMALHO, M.A.P.; ABREU, A.F.B.T.; CARNEIRO, J.E. de S. Effect of the number of intermatings on genetic properties of a segregant common bean population. Crop Breeding and Applied Biotechnology, v.4, p.234-240, 2004.
BERNARDO, R. Breeding for quantitative traits in plants. Woodbury: Stemma Press 2002. 368p.
BROMLEY, C.M.; VAN VLECK, L.D.; JOHNSON, B.E.; SMITH, O.S. Estimation of genetic variance in corn from F1 performance with and without pedigree relationship among inbred lines. Crop Science, v.40, p.651-655, 2000.
n o i t a c i f i s s a l
C Classification
F4:6 F4:7 M2/ BLUP M/BLUP F 6 :
4 F4:7 M BLUP M/BLUP 7
2 1/ 1 - x - 44 32 x -
-4
1 2 - - x 36 33 - x
-2 4 - - x 58 35 - - x
8
2 6 - x - 47 37 x -
-3 7 - - x 55 40 - - x
1 8 - - x 48 41 x -
-2
2 9 - x - 34 42 - x
-8 10 x - - 40 45 - x
-5
2 11 - x - 37 46 - x
-6
1 12 - - x 54 47 x -
-4
2 13 - x - 50 51 x -
-3
1 14 x - - 46 52 - - x
7 18 - - x 42 53 x -
-0
2 19 - x - 39 54 - x
-5
1 23 x - - 43 55 x -
-2
1 24 - - x 49 56 - - x
8
1 28 x - - 38 58 - x
-5 29 - - x 57 59 - - x
1
1 30 x - - 32 60 - x
-Table 4 - Classification of the coincident progenies in the F4:6 andF4:7 generations and their origin in relation to the selection criterion used.
1/Classification of the progenies selected in F
4:6 and evaluated in F4:7.
2/Selection in mean.
F4:7
r e p p u 0
3 30lower Coincidence(%)
d e t c e p x
e observed expected observed 30 upper 30lower
n a e
m 10 5 11 7 50.0 63.6
P U L
B 11 6 11 7 54.5 63.6
P U L B / n a e
m 9 8 8 5 88.9 62.5
l a t o
T 30 19 30 19
Table 5 - Expected and observed number of progenies in the F4:7 generation by the selection based on the mean, BLUP and mean/BLUP in the F4:6 generation, and percentage of coincidence.
CARNEIRO, J.E. de S.; RAMALHO, M.A.P.; ABREU, A. de F.B.; GONÇALVES, F.M.A. Breeding potential of single, double and multiple crosses in common bean. Crop Breeding and Applied Biotechnology, v.2, p.515-524, 2002.
CRUZ, C.D.; REGAZZI, A.J.; CARNEIRO, P.C.S. Modelos biométricos aplicados ao melhoramento genético. 3.ed. Viçosa: UFV, 2004. v.1, 480p.
HENDERSON, C.R.; KEMPTHORNE, O.; SEARLE, S.R.; VON KROSIGK, C.M. The estimation of environmental and genetic trends from records subject to culling. Biometrics, v.13, p.192-218, 1959.
HENDERSON, C.R. Best linear unbiased estimation and prediction under a selection model. Biometrics, v.31, p.23-447, 1975. KNAPP, S.J.; STROUP, W.W.; ROSS, W.M. Exact confidence
intervals for heritability on a progeny mean basis. Crop Science, v.25, p.192-194, 1985.
LITTLEL, R.C.; MILLEKEN, G.A.; STROUP, W.W.; WOLFINGER, R.D. SAS®®®®®
LYNCH, M.; WALSH, B. Genetics and analysis of quantitative traits. Sunderland: Sinauer, 1998. 948p.
MORETO, A.L.; RAMALHO, M.A.P.; NUNES, J.A.R.; ABREU, A.F.B. Estimação dos componentes da variância fenotípica em feijoeiro utilizando o método genealógico. Ciência e Agrotecnologia. v.31, p.1035-1042, 2007.
MRODE, R.A. Linear models for the prediction of animal breeding values. Guildford: Biddles, 1996. 184p.
NUNES, J.A.R. Incorporação da informação de parentesco no método genealógico pelo enfoque de modelos mistos. Lavras: UFLA, 2006. 113p. (Tese - Doutorado).
PANTER, D.M.; ALLEN, F.L. Using best linear unbiased predictions to enhance breeding for yield in soybean: II selection of superior crosses from a limited number of yield trials. Crop Science, v.35, p.405-410, 1995.
PEREIRA, H. S. Seleção de linhagens de feijão tipo Carioca com pirâmide de alelos de resistência à antracnose e outros fenótipos favoráveis. Lavras: UFLA,2003. 78p. (Dissertação - Mestrado). PETERNELLI, L.A.; BORÉM, A. Hibridação em feijão. In: BORÉM, A. Hibridação artificial de plantas. Viçosa: UFV, 1999. p.269-294.
RAMALHO, M.A.P.; ABREU, A.B.F.; SANTOS, J.B. Melhoramento de espécies autógamas. In: NASS, L.L.; VALOIS, A.C.C.; MELO, I.S.; INGLIS, M.C.V. (Org.). Recursos genéticos & melhoramento de plantas. Rondonópolis: Fundação MT, 2001. v.1, p.201-230.
RAMALHO, M.A.P.; FERREIRA, D.F.; OLIVEIRA, A.C. Experimentação em genética e melhoramento de plantas. 2.ed. Lavras: UFLA, 2005. 326p.
RESENDE, M.D.V. Genética biométrica e estatística no melhoramento de plantas perenes. Brasília: Embrapa Informação Tecnológica, 2002. 975p.
SAS INSTITUTE. SAS/STAT®®®®®8.0 User’s Guide. Cary: SAS
Institute, 1999. 373p.
SATTERTHWAITE, F.E. An approximate distribution of estimates of variance components. Biometrics, v.2, p.110-114, 1946. VAN OEVEREN, A.J.; STAM, P. Comparative simulation studies
on the effects of selection for quantitative traits in autogamous crop: early selection versus single seed descent. Heredity, v.69, p.342-351, 1992.
VENCOVSKY, R.; BARRIGA, P. Genética biométrica no fitomelhoramento. Ribeirão Preto: Sociedade Brasileira de Genética, 1992. 496p.