.
1 Laboratorio de Ecologia e Evolução de Plantas, Universidade Federal de Viçosa, 36570-900, Viçosa, MG, Brazil 2 Museo Nacional de Ciencias Naturales, CSIC, 28006, Madrid, Spain
* Corresponding author: [email protected]
Functional antagonism between nitrogen-fi xing leguminous
trees and calcicole-drought-tolerant trees in the Cerrado
João Augusto Alves Meira-Neto1,2*, Gláucia Soares Tolentino1, Maria Carolina Nunes Alves da Silva1, Andreza Viana Neri1, Markus Gastauer1, Luiz Fernando Silva Magnago1, Jorge Curiel Yuste2 and Fernando Valladares2
Received: October 27, 2016 Accepted: November 23, 2016
ABSTRACT
Th e Cerrado is the largest savanna of South America and its physiognomy varies from savanna to woodlands. Th ere are two main types of woodlands in the Cerrado: dystrophic woodlands, dominated by N-fi xing leguminous trees (LEG), and mesotrophic woodlands dominated by non-leguminous drought-tolerant trees (DRY), which are calcicoles and sensitive to Al3+. Th e working hypothesis is that LEG and DRY are functional antagonists in terms of
the acidifi cation/alkalization processes involving diff erent forms of inorganic nitrogen and pH, Ca2+ and Al3+ in soil.
Tree species basal area and soil properties were used to investigate the antagonism between LEG and DRY using generalized linear models. Th e results suggest that LEG and DRY are antagonists. Th e LEG were positively associated with Al3+, NO3- and NH4+ content and negatively related to increasing Ca2+ content, whereas the DRY were negatively
associated with Al3+, NO3- and NH4+ and positively associated with increasing Ca2+ content. Th e upper soil layer in
plots dominated by LEG species became more acidic and the upper soil layer in plots dominated by DRY species became more alkaline. Th e results suggest that LEG and DRY are functional antagonists and their preferences for NH4+ or NO3- might infl uence the way the Cerrado woodland changes.
Keywords: aluminum toxicity, calcicole species, dry forests, ecosystem function, nitrogen fi xing, tropical savanna, woodlands
Introduction
Th e Cerrado domain is a tropical savanna that varies from savannic physiognomies to woodlands (Oliveira-Filho & Ratter 2002). It is considered the richest tropical savanna in the world, with more than 12,000 plant species (Mendonça et al. 2008). It encompasses the largest area of arable land in South America; more than 50 % of its 2 million km² area is suitable for crops and cattle ranching (Lopes & Daher 2008). Nevertheless, its acidic soils are arable and productive only with the implementation of practices such as liming because
of aluminum (Al3+) toxicity and calcium defi ciency (Caires
still a lot remaining to be understood.
Two types of woodlands have been distinguished in the Cerrado: dystrophic and mesotrophic. The dystrophic woodlands (DWs), found on strongly acidic soils with a high Al3+ content, are very often dominated by leguminous
trees, many of them nitrogen fixers (hereafter LEG, only for potential nitrogen fixers) (Sprent 2009; Araújo et al. 2011), whereas the mesotrophic woodlands (MWs), found on soils with a pH close to 7.0 (Neri et al. 2012), are dominated by non-leguminousand drought-toleranttreespeciestypicalof seasonallydryforests (DRY), despite many leguminous trees occurring in MW, and vice-versa. The traditional method to distinguish the two types of woodlands is based on mesotrophic indicator species (Ratter et al. 2003; Durigan & Ratter 2006), which are calcicole and aluminum-intolerant trees (Ratter et al. 1977; Ratter et al. 2003).
Although the Al-Ca gradient has been reported as an ubiquitous selective pressure in ecosystems with acidic soils (Jansen et al. 2002), many findings have encouraged investigations concerning uptake preferences for different forms of N in those soils (Bustamante et al. 2004; Andrews et al. 2011). Since nitrogen is the main taken-up mineral, nitrogen cycling may cause soil changes. For instance, NH4+ preference
may induce soil acidification whereas NO3- preference may
induce soil alkalization (Haynes 1990; Bravin et al. 2008). Thus, LEG and DRY preferences on the Al-Ca gradient might reflect uptake preferences for different forms of nitrogen.
We postulate that LEG are crucial to the functioning of Cerrado woodlands because N-fixing bacteria associated with LEG roots are widely known to obtain NH4+ from N
2 molecules
in the air, causing an unbalance of cation over anion uptake, and acidifying their rhizosphere (e.g., Bolan et al. 1991; Zahran 1999). Furthermore, NH4+ has been related to aluminum
resistance in crops that have NH4+ uptake preference over
NO3- in acidic soils, accumulating NH4+ and preventing Al3+
toxicity, an ubiquitous stress factor of acidic soils (Jansen et al. 2002; Gastauer & Meira-Neto 2013a) that causes roots damage (Zhao et al. 2008; Zhao & Shen 2010). We postulate that DRY are crucial as well because calcicole plants may alkalize their rhizosphere since they have high exudation rates of organic acids for P uptake (Ström et al. 2005). As DRY are calcicole (Ratter et al. 1977; Durigan & Ratter 2006), an alkalization of soil upper layer might be expected where DRY dominate. Therefore, the working hypothesis is that LEG and DRY respond in opposite way to the soil pH as well as to contents of NH4+,
NO3-, Ca2+, and Al3+ and are functional antagonists in terms of
the acidification and alkalization of the uppermost layers of soil.
Materials and methods
Study area
The present study was conducted in the Paraopeba Reserve (Floresta Nacional de Paraopeba or FLONA de
Paraopeba), Brazil (19°20’S; 44°20’W), which is located at 730-760 m above sea level (ASL) and covers an area of 200 ha. The climate of the region is classified as Aw (tropical humid) by the Koeppen system, with a rainy summer from September to April and a dry season from April to September. According to personal statements from former employees, the vegetation in the Paraopeba Reserve regenerated after clear-cutting in 1952. There are records of fires in 1960 and 1963, but since then the area has been protected from fire. Moreover, the Cerrado of the reserve is at an appropriate altitudinal range, small enough to have the same climate throughout required to test our hypothesis. The selection of the studied areas was based on the classification of the soils and physiognomies. The soil types where the woodlands occur are red-yellow oxisols and red oxisols (Neri et al. 2012; Neri et al. 2013).
Vegetation, soil and functional groups
To investigate the relationship between spatial variation in vegetation and soil, forty-five plots were grouped into nine transects (20 m × 100 m) spaced at least 100 meters from each other. Each transect contained five plots (20 m × 20 m each), comprising a total area of 1.8 ha. Three transects were allocated per woodland type: dystrophic, mesotrophic and transitional. The dystrophic woodland (DW) is on a dystrophic red latosol, the transitional woodland (TW) is on a dystrophic red-yellow latosol and the mesotrophic woodland (MW) on a mesotrophic red latosol. All woody plants with a stem diameter at ground level (DGL) > 3 cm were sampled. Species abundance and basal area were calculated for each plot. The basal areas were converted into relative basal areas for each plot (values between 0 and 1). During 2005, one soil profile at five to ten meters from one transect in each woodland type was sampled at depths of 0 - 10 cm, 10 - 20 cm, 20 - 30 cm, 30 - 50 cm, 50 - 70 cm, 70 - 90 cm, 90 - 110 cm, 110 - 130 cm and 130 - 150 cm.
From each 20 m × 20 m plot, three mixed soil samples were collected from a depth of 0 to 10 cm in January. All samples were stored in polyethylene bags and analyzed by the Soil Analysis Laboratory at the Universidade Federal de Viçosa. The mixed soil was then air-dried and analyzed for: pH (H2O); extractable phosphorus (P), sodium (Na), potassium (K) and iron (Fe) (extracted by Mehlich 1extract); exchangeable calcium (Ca2+) magnesium
(Mg), and exchangeable aluminium (Al3+) (extracted in
KCl); potential acidity (H+Al) (calcium acetate at pH 7.0); organic matter (OM) (Walkley-Black method); bases sum (Ca+Mg+K+Na), Cation Exchange Capacity (CEC), bases saturation (V), aluminium saturation (m) (standard international procedures). The Kjeldahl method was used for measurements of total soil N (Raveh and Avnimelech 1979). The NO3- and NH4+ concentrations were determined
the three soil samples.
The functional groups were based on species identification, and the plants were partitioned into LEG and DRY species. The other species were considered as a third group: OTHER (Tabs. S1, S2 in supplementary material). For LEG delimitation, we considered only leguminous species from the genera that are nitrogen fixers (Sprent 2009). We considered Senegalia polyphylla as OTHER because it is a non-nodulating reference among leguminous trees for experiments with 15N stable isotope (Soares 2007). For DRY delimitation, we considered all non-leguminous tree species reported as the most frequent (> 70 % of checklists) in the tropical dry forests of the eastern and central western regions of South America (Oliveira-Filho et al. 2006). We used the lists from both regions because Paraopeba lies near their borders. In addition, we used the lists of the low and high altitude tropical dry forests from both regions because the altitude of the Paraopeba Reserve (730-760 m ASL) is near the limit (700 m ASL) of both categories (Oliveira-Filho et al. 2006). The functional trait measured was basal area, a proxy of biomass (Baraloto et al. 2010).
Soil chemical composition
To document vegetation and soil changes due to the relationship of LEG and DRY species to soil properties, five plots (20 m × 20 m) of each woodland type were sampled in January 2005, in the Paraopeba Reserve (Neri et al. 2012; Neri et al. 2013). The same plots were resampled in January 2009. The same information for the vegetation and soil (depth of 0 to 10 cm) described above was acquired, except for the N content (total N, NO3- and NH4+), which was not
evaluated in 2005. Variation in soil pH between 2005 and 2009 was calculated by subtracting the pH in 2005 from the pH in 2009 (pH2009-2005).
Phylogenetic structure
To detect environmental filtering, we used phylogenetic structure as a tool, assuming that phylogenetic clustering occurs where environmental filtering (i.e., drought caused by contrasting soil pH where DRY species dominate) acts as the predominant assembly rule (Cavender-Bares et al. 2009). To evaluate the community composition for phylogenetic clustering or overdispersion, the net relatedness index (NRI) between individuals was calculated for the 20 m × 20 m spatial scale. All species from the phylogenies were inserted into APG III megatree R20100701.nMW using the phylomatic function of Phylocom 4.2 (Webb & Donoghue 2005). This tree was dated using the Bladj algorithm (Webb
et al. 2008), which is based on the fossil dating proposed by Wikström et al. (2001) in combination with the agescl3 file for precision improvement (Gastauer & Meira-Neto 2013b). A checklist from a wider sampling that also included species
from the savannic physiognomies of the Paraopeba Reserve was used as a metacommunity. For community partitioning, individuals were split into LEG (creating samples only with LEG) and all non-leguminous species (DRY + OTHER) to run in Phylocom 4.2.
Statistical analyses
To test the relationships between vegetation and soil properties, we used generalized linear models (GLM) with the following variables: the functional groups (LEG and DRY) and the relative basal areas of LEG and DRY; soil Al3+, NO3-, NH4+, Ca2+, Ca2+ variation (Ca2+ 2009-2005), pH
and pH variation (pH2009-2005) and community NRI. The dredge function from the MuMIn package was used to test all combinations of variables included in the models. An information theoretical approach based on the Akaike Information Criterion of the Second Order (AICc) was used to determine which variables were more important. The best model was indicated by the lowest AICc value (Burnham
et al. 2010). All analyses were performed using R version 2.15.1 (R Development Core Team 2012).
Results
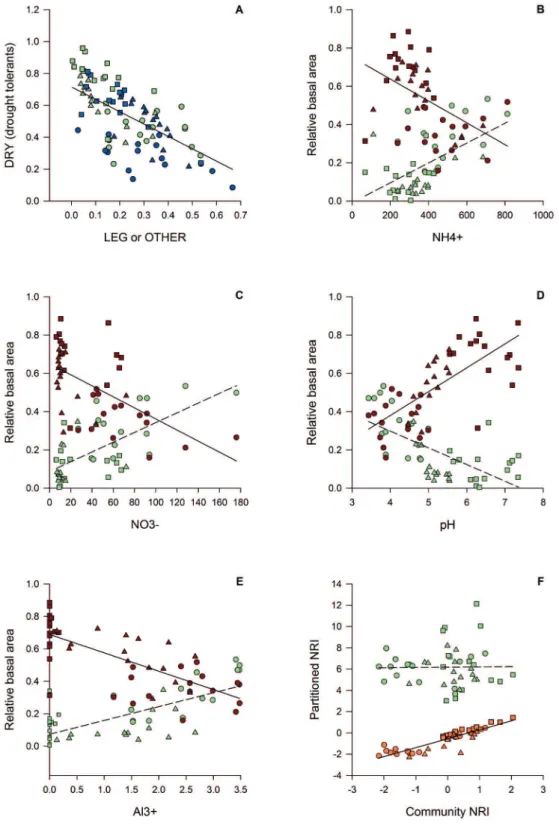
The results from the GLM analyses indicated antagonistic relationships between LEG and DRY (as functional groups), and the relative basal areas of the LEG and DRY species interacted strongly with NH4+, NO3-, Ca2+, pH and Al3+ (Figs.
1, 2, Tabs. 1 and S1 in supplementary material). The LEG and DRY were negatively related to each other whereas LEG and OTHER were not related (Fig. 1A). The relative basal areas of the LEG species were positively related to the inorganic soil N (NO3- and NH4+) concentrations, whereas
those of the DRY species were negatively related (Fig. 1). However, we did not find a significant relationship between total N and the basal area of LEG or DRY species (Tab. S2 in supplementary material). The relative basal area of LEG species was negatively related to soil pH and positively related to soil Al3+ content, which was inversely related to
basal area of DRY species. The basal area of DRY species was positively related to pH and negatively related to soil Al3+ content (Fig. 1, Tabs. 1 and S1, S2 in supplementary
material).
The NRI of the entire community was not related to the NRI of the LEG community; however, the NRI of the entire community was strongly related to the NRI of the non-leguminous trees (DRY + OTHER; Fig. 1, Tab. 1).
Figure 1. A – Generalized linear model (GLM) of the relative basal area of nitrogen-fixing leguminous trees (LEG, light green polygons, dashed line) or other species (OTHER, blue polygons, solid line) and the relative basal area of drought-tolerant tree species typical of seasonally dry forests (DRY) in Cerrado woodlands. B – GLM of the soil ammonium content (NH4+) and relative basal area per plot (cm2) of LEG (light
green polygons, dashed line) and DRY (red polygons, solid line); P=0.004 and P=0.00002, respectively. C – GLM of the soil nitrate content (NO3-) and basal area per plot (cm2) of LEG (light green polygons, dashed line) and DRY (red polygons, solid line). D – GLM of the soil pH
and basal area per plot (cm2) of LEG species (light green polygons, dashed line) and DRY species (red polygons, solid line). E – GLM of the
soil Al3+ content and basal area per plot (cm2) of LEG (light green polygons, dashed line) and DRY (red polygons, solid line). F - GLM of the
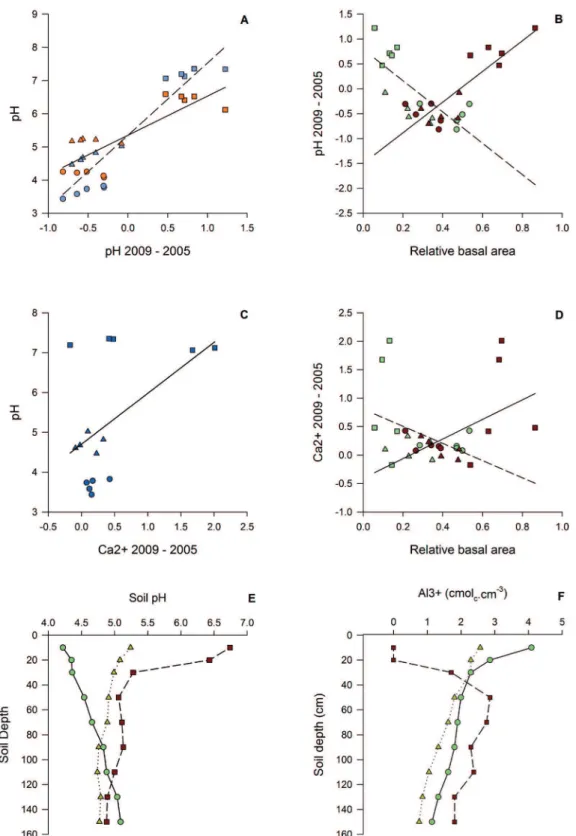
Figure 2. A – Generalized linear model (GLM) of pH variation (pH2009–2005), 2005 pH (pH, blue polygons, dashed line) and 2009 pH (pH, orange polygons, solid line). B – GLM of the LEG relative basal area (light green polygons, dashed line) and DRY relative basal area (red polygons, solid line) and soil pH variation (pH 2009–pH2005). C - GLM of Ca2+ variation (Ca2+ 2009-2005) and 2009 pH (pH). D - GLM - of
LEG relative basal area (light green polygons, dashed line) and DRY relative basal area (red polygons, solid line) with Ca2+ variation (Ca2+
2009–2005). E and F – Relationship between soil depth and soil pH and Al3+ of the soil profiles of the Cerrado woodlands. E and F, the solid
and negatively (down to 0.7) in the TW. The acidification and alkalization are explained by the basal areas of LEG and DRY (Fig. 2). The basal areas of LEG were negatively related to pH2009-2005, while in contrast the basal areas of DRY were positively related to the pH2009-2005 values (Fig. 2). The Ca2+ varied (Ca2+ 2009-2005) positively with
pH (Fig. 2C), positively with DRY relative basal area and negatively with LEG basal area (Fig. 2D).
The pH of the soil profiles varied with depth. In the dystrophic woodland, the pH varied gradually, increasing with depth. In the mesotrophic woodland, the pH decreased drastically from the surface to a depth of 50 cm where there was a contrasting pH. The transitional plots had an intermediate condition that was closer to the MW pattern than the DW pattern. The Al3+ contents of the soil profiles
varied non-linearly as expected as a result of the variation in pH (Fig. 2).
Discussion
All study plots in the Cerrado woodlands encompassed
LEG and DRY trees. The negative relationship between the basal areas (proxy of biomass) of LEG and DRY suggests a functional antagonism between them.
We found evidence of antagonism between LEG and DRY in the relationship between their relative basal areas and soil biogeochemical characteristics. Over four years, the uppermost layer of the soil of LEG-dominated plots experienced acidification, and the uppermost layer of soil of DRY-dominated plots experienced alkalization. Congruently, in LEG-dominated plots, the Ca2+ content
decreased whereas in DRY-dominated plots the Ca2+ content
increased. The relationship between the alkalization in the uppermost 20 cm of the soil in DRY-dominated plots and the acidification in the uppermost 20 cm of the soil in LEG-dominated plots over 4 years (Fig. 2) suggests a causal relationship between the type of plant community and soil biogeochemistry. The uppermost 20 cm of the soil in the studied woodlands in the Paraopeba Reserve has the highest content of organic matter, according to Neri et al. (2013). This indicates the strong biotic influence in this upper soil horizon and supports the hypothesized causality between plant composition and soil functioning.
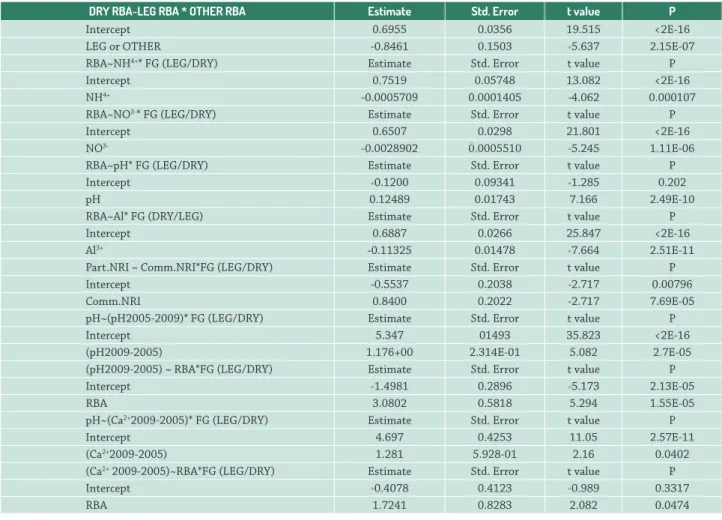
Table 1.Generalized linear models for Al3+, NO3-, NH4+, pH, pH variation (pH 2009-2005) and Ca2+ variation (Ca2+ 2009-2005) with interactions
with functional groups – FG (LEG/DRY) and periods (2005/2009) related to the relative basal area - RBA. See Figures 1 and 2 for graphs and for further explanation. The corresponding AICc values are presented in Table S1 in supplementary material.
DRY RBA~LEG RBA * OTHER RBA Estimate Std. Error t value P
Intercept 0.6955 0.0356 19.515 <2E-16
LEG or OTHER -0.8461 0.1503 -5.637 2.15E-07
RBA~NH4+* FG (LEG/DRY) Estimate Std. Error t value P
Intercept 0.7519 0.05748 13.082 <2E-16
NH4+ -0.0005709 0.0001405 -4.062 0.000107
RBA~NO3-* FG (LEG/DRY) Estimate Std. Error t value P
Intercept 0.6507 0.0298 21.801 <2E-16
NO3- -0.0028902 0.0005510 -5.245 1.11E-06
RBA~pH* FG (LEG/DRY) Estimate Std. Error t value P
Intercept -0.1200 0.09341 -1.285 0.202
pH 0.12489 0.01743 7.166 2.49E-10
RBA~Al* FG (DRY/LEG) Estimate Std. Error t value P
Intercept 0.6887 0.0266 25.847 <2E-16
Al3+ -0.11325 0.01478 -7.664 2.51E-11
Part.NRI ~ Comm.NRI*FG (LEG/DRY) Estimate Std. Error t value P
Intercept -0.5537 0.2038 -2.717 0.00796
Comm.NRI 0.8400 0.2022 -2.717 7.69E-05
pH~(pH2005-2009)* FG (LEG/DRY) Estimate Std. Error t value P
Intercept 5.347 01493 35.823 <2E-16
(pH2009-2005) 1.176+00 2.314E-01 5.082 2.7E-05
(pH2009-2005) ~ RBA*FG (LEG/DRY) Estimate Std. Error t value P
Intercept -1.4981 0.2896 -5.173 2.13E-05
RBA 3.0802 0.5818 5.294 1.55E-05
pH~(Ca2+2009-2005)* FG (LEG/DRY) Estimate Std. Error t value P
Intercept 4.697 0.4253 11.05 2.57E-11
(Ca2+2009-2005) 1.281 5.928-01 2.16 0.0402
(Ca2+ 2009-2005)~RBA*FG (LEG/DRY) Estimate Std. Error t value P
Intercept -0.4078 0.4123 -0.989 0.3317
The acidic soils of LEG-dominated plots in the dystrophic woodland were generally associated with very high levels of Al3+, which are stressors for DRY species (Ratter et al. 1977;
Crawley 1996; Haridasan & Araújo 2005). Additionally, if LEG avoid Al3+ uptake, they contribute to the accumulation
of Al3+ in the soil. The pH dynamics indicate that
LEG-dominated soils had become more acidic and that LEG were related to this acidification. These findings are consistent with the negative relationship between LEG and pH, and the positive relationships between LEG and Al3+, NH4+ and
even NO3-, as the nitrification of NH4+ occurs continuously
in the N cycle (e.g., Booth et al. 2005).
The processes that caused these relationships are not completely understood, indeed. The cause of the relationships between LEG basal area and soil properties is likely the N-fixing process that fixes NH4+, as well as the
preference to take up NH4+, which causes acidification of
the rhizosphere (Riley & Barber 1971; Haynes 1990; Bolan
et al. 1991; Zahran 1999; Kanu et al. 2014). Although we did not test nitrogen fixation, we tested the potentiality for fixation expressed by the basal area of LEG.
Inversely, DRY-dominated communities of the MW are less affected by Al3+ toxicity because of the alkalization of the
uppermost soil layer. The cause might be the preference of calcicole-DRY for NO3-, alkalizing the uppermost soil layer;
however, the results are not conclusive. Another explanation for the soil alkalization is that DRY are calcicoles and have high exudation rates for organic acids for P uptake (Ratter
et al. 1977; Ström et al. 2005). Congruently, the N/P ratio of the leaves of 23 non-leguminous species from the Paraopeba Reserve ranged from 13.3 to 57.9, with an average value of 21.5 (Nascimento 2011), which is higher than the average value of 18 reported by Bustamante et al. (2006). Among the 23 species sampled by Nascimento (2011), eight species were DRY and had N/P ratios lower than the average; of these, seven had N/P ratios between 13.3 and 16.9, indicating they were not P-limited or that they were not only P-limited (Koerselman & Meuleman 1996).
Results suggest that LEG and DRY are antagonists because of the negative relationship of basal area to each other and because they likely change pH, Ca2+ and,
consequently, Al3+ in opposite ways. Thus, LEG and DRY do
not only have different preferences for contents or levels of soil factors along a gradient; LEG are also positively related to contents of NH4+ and NO3- in the upper layers of soil,
whereas DRY are negatively related.
The confirmation of our results may allow generalizations to be made for the Cerrado domain and for other tropical vegetation occurring on acidic soils. If the results are confirmed, at least for the Cerrados, the understanding of the Cerrado MW as a transitional ecosystem between Cerrado and seasonal forests (e.g., Durigan & Ratter 2006) shifts toward another perspective. Our results suggest that woodland composition with dominance of LEG or DRY influence the way the Cerrado woodlands change: toward
dystrophic woodlands when the LEG are dominant or toward mesotrophic woodlands when the DRY are dominant.
Acknowledgments
The authors especially thank CNPq, CAPES, FAPEMIG and SECTES-MG (Floresta-Escola Project) for the scholarships, sponsorship and support, and thank the board of the Paraopeba Reserve, particularly Rosângela Ribeiro Silva, Renato Drummond and José Vicente. The authors also thank Carlos Schaefer and anonymous reviewers for valuable suggestions. JAAMN holds a productivity fellowship of CNPq.
References
Andrews M, James EK, Sprent JI, Boddey RM, Gross E, Jr FBR. 2011. Nitrogen fixation in legumes and actinorhizal plants in natural ecosystems: values obtained using 15N natural abundance. Plant Ecology & Diversity 4: 131-140.
Araújo GM, Nascimento ART, Lopes SF, Rodrigues RF, Ratter JA. 2011. Structure and floristics of the arboreal component of a dystrophic cerradão and comparison with other cerradões in central Brazil. Edinburgh Journal of Botany 68: 401-418.
Assis ACC, Coelho RM, Pinheiro ES, Durigan G. 2011. Water availability determines physiognomic gradient in an area of low-fertility soils under Cerrado vegetation. Plant Ecology 212: 1135-1147.
Baraloto C, Paine CET, Patiño S, Bonal D, Hérault B, Chave J. 2010. Functional trait variation and sampling strategies in species-rich plant communities. Functional Ecology 24: 208-216.
Bolan NS, Hedley MJ, White RE. 1991. Processes of soil acidification during nitrogen cycling with emphasis on legume based pastures. Plant Soil 134: 53-63.
Booth MS, Stark JM, Rastetter E. 2005. Controls on nitrogen cycling in terrestrial ecosystems: a synthetic analysis of literature data. Ecological Monographs 75: 139-157.
Bravin MN, Martí AL, Clairotte M, Hinsinger P. 2008. Rhizosphere alkalisation - a major driver of copper bioavailability over a broad pH range in an acidic, copper-contaminated soil. Plant Soil 318: 257-268. Burnham KP, Anderson DR, Huyvaert KP. 2010. AIC model selection
and multimodel inference in behavioral ecology: some background, observations, and comparisons. Behav Ecol Sociobiol 65: 23-35. Bustamante MMC, Martinelli LA, Silva DA, et al. 2004. 15n natural
abundance in woody plants and soils of central brazilian savannas (cerrado). Ecological Applications 14: 200-213.
Bustamante MMC, Medina E, Asner GP, Nardoto GB, Garcia-Montiel DC. 2006. Nitrogen cycling in tropical and temperate savannas. Biogeochemistry 79: 209-237.
Caires EF, Corrêa JCL, Churka S, Barth G, Garbuio FJ. 2006. Surface application of lime ameliorates subsoil acidity and improves root growth and yield of wheat in an acid soil under no-till system. Scientia Agricola 63: 502-509.
Cavender-Bares J, Kozak KH, Fine PVA, Kembel SW. 2009. The merging of community ecology and phylogenetic biology. Ecology Letters 12: 693-715.
Crawley MJ. 1996. Life History and Environment. In: Crawley MJ. (ed.) Plant Ecology. Oxford, Blackwell Publishing Ltd. p. 73-131 Durigan G, Ratter JA .2006. Successional changes in cerrado and cerrado/
forest ecotonal vegetation in western São Paulo state, Brazil, 1962-2000. Edinburgh Journal of Botany 63: 119-130.
Gastauer M, Meira-Neto JAA. 2013a. Interactions, environmental sorting and chance: Phylostructure of a tropical forest assembly. Folia Geobot 49: 443-459.
Haridasan M, Araújo GM. 2005. Perfil nutricional de espécies lenhosas de duas florestas semidecíduas em Uberlândia, MG. Revista Brasileira de Botânica 28: 295-303.
Haynes RJ. 1990. Active ion uptake and maintenance of cation-anion balance: A critical examination of their role in regulating rhizosphere pH. Plant Soil 126: 247-264.
Jansen S, Broadley MR, Robbrecht E, Smets E. 2002. Aluminum hyperaccumulation in angiosperms: A review of its phylogenetic significance. Bot Rev 68: 235-269.
Júnior M, Hur B, Haridasan M. 2005. Comparação da vegetação arbórea e características edáficas de um cerradão e um cerrado sensu stricto em áreas adjacentes sobre solo distrófico no leste de Mato Grosso, Brasil. Acta Botanica Brasilica 19: 913-926.
Kanu SA, Barnabas AD, Przybylowicz WJ, Mesjasz-Przybylowicz J, Dakora FD. 2014. Elemental distribution in tissue components of N2-fixing nodules of Psoralea pinnata plants growing naturally in wetland and upland conditions in the Cape Fynbos of South Africa. Protoplasma 251: 869-879.
Koerselman W, Meuleman AFM. 1996. The vegetation N: P Ratio: a new tool to detect the nature of nutrient limitation. Journal of Applied Ecology 33: 1441-1450.
Lloyd J, Domingues TF, Schrodt F, et al. 2015. Edaphic, structural and physiological contrasts across Amazon Basin forest-savanna ecotones suggest a role for potassium as a key modulator of tropical woody vegetation structure and function. Biogeosciences 12: 6529-6571. Lopes A, Daher E. 2008. Agronegócio e recursos naturais no Cerrado:
desafios para uma coexistênica harmônica. In: Faleiro FG,; Farias Neto AL. (eds.) Savanas: desafios e estratégias para o equilíbrio entre sociedade, agronegócio e recursos naturais. Brasília, Embrapa. p. 173-209.
Mendonça RC, Felfili JM, Walter B, et al. 2008. Flora vascular do bioma Cerrado. Vol. 2. Brasília, Embrapa.
Nascimento MT. 2011. Ecologia funcional e padrões de alocação de alumínio e nutrientes em plantas lenhosas do Cerrado. Viçosa, Universidade Federal de Viçosa.
Neri AV, Schaefer CEGR, Silva AF, Souza AL, Ferreira-Junior WG, Meira-Neto J AA. 2012. The influence of soils on the floristic composition and community structure of an area of Brazilian Cerrado vegetation. Edinburgh Journal of Botany 69: 1-27.
Neri AV, Schaefer CEGR, Souza AL, Ferreira-Junior WG, Meira-Neto JAA. A 2013. Pedology and plant physiognomies in the cerrado, Brazil. Anais da Academia Brasileira de Ciências 85: 87-102.
Oliveira-Filho A, Ratter JA. 2002. Vegetation physiognomies and woody flora of the Cerrado Biome. In: Oliveira PS, Marquis RJ. (eds.) The Cerrados of Brazil: ecology and natural history of a Neotropical savanna. New York, Columbia University Press. p. 91-120. Oliveira-Filho AT, Jarenkow JA, Rodal M. 2006. Floristic relationships
of seasonally dry forests of eastern South America based on tree species distribution patterns. In: Pennington RT, Lewis GP, Ratter JA. (eds.) Neotropical savannas and seasonally dry forests: plant diversity, biogeography, and conservation. Boca Raton, CRC Press. p. 159-192.
R Development Core Team. 2012. R: A language and environment for statistical computing. http://www.R-project.org./ 19 Feb.15. Ratter JA, Bridgewater S, Ribeiro JF. 2003. Analysis of the floristic
composition of the Brazilian cerrado vegetation III: comparison of the woody vegetation of 376 areas. Edinburgh Journal of Botany 60: 57-109.
Ratter JA, Montgomery R, Askew D. 1977. Observações adicionais sobre o cerradão de solos mesotróficos no Brasil Central. In: IV Simpósio Sobre o Cerrado. São Paulo/Belo Horizonte, Editora USP e Editora Itatiaia. p. 303-316
Raveh A, Avnimelech Y. 1979. Total nitrogen analysis in water, soil and plant material with persulphate oxidation. Water Research 13: 911-912. Riley D, Barber SA. 1971. Effect of ammonium and nitrate fertilization
on phosphorus uptake as related to root-induced pH changes at the root-soil interface. Soil Science Society of America Journal 35: 301. Soares PG. 2007. Efeito da inoculação com rizóbio no estabelecimento, crescimento inicial e abundância natural de 15N em leguminosas (Fabaceae) arbóreas nativas plantadas por semeadura direta. MScThesis, Universidade de São Paulo, Brazil.
Sprent JI. 2009. Legume nodulation: a global perspective. New Delhi, John Wiley and Sons.
Ström L, Owen AG, Godbold DL, Jones DL. 2005. Organic acid behaviour in a calcareous soil implications for rhizosphere nutrient cycling. Soil Biology and Biochemistry 37: 2046-2054.
Webb CO, Ackerly DD, Kembel SW. 2008. Phylocom: software for the analysis of phylogenetic community structure and trait evolution. Bioinformatics 24: 2098-2100.
Webb CO, Donoghue MJ. 2005. Phylomatic: tree assembly for applied phylogenetics. Molecular Ecology Notes 5: 181-183.
Wikström N, Savolainen V, Chase MW. 2001. Evolution of the angiosperms: calibrating the family tree. Proceedings of the Royal Society of London B: Biological Sciences 268: 2211-2220.
Zahran HH. 1999. Rhizobium-legume symbiosis and nitrogen fixation under severe conditions and in an arid climate. Microbiol Mol Biol Rev 63: 968-989.
Zhao XQ, Shen RF. 2010. Can aluminium resistance and nitrogen utilization of rice be enhanced simultaneously in acidic soils? In: Proceedings of 19th World Congress of Soil Science, Soil Solutions for a Changing World. Brisbane, CSIRO Publishing. p. 5880-5883.