Abstract
Study Objectives
To develop and validate a novel non-contact system for whole-night sleep evaluation using breathing sounds analysis (BSA).
Design
Whole-night breathing sounds (using ambient microphone) and polysomnography (PSG) were simultaneously collected at a sleep laboratory (mean recording time 7.1 hours). A set of acoustic features quantifying breathing pattern were developed to distinguish between sleep and wake epochs (30 sec segments). Epochs (n = 59,108 design study and n = 68,560 validation study) were classified using AdaBoost classifier and validated epoch-by-epoch for sensitivity, specificity, positive and negative predictive values, accura-cy, and Cohen's kappa. Sleep quality parameters were calculated based on the sleep/wake classifications and compared with PSG for validity.
Setting
University affiliated sleep-wake disorder center and biomedical signal processing laboratory.
Patients
One hundred and fifty patients (age 54.0±14.8 years, BMI 31.6±5.5 kg/m2, m/f 97/53) re-ferred for PSG were prospectively and consecutively recruited. The system was trained (de-sign study) on 80 subjects; validation study was blindly performed on the additional
70 subjects.
Measurements and Results
Epoch-by-epoch accuracy rate for the validation study was 83.3% with sensitivity of 92.2% (sleep as sleep), specificity of 56.6% (awake as awake), and Cohen's kappa of 0.508.
OPEN ACCESS
Citation:Dafna E, Tarasiuk A, Zigel Y (2015) Sleep-Wake Evaluation from Whole-Night Non-Contact Audio Recordings of Breathing Sounds. PLoS ONE 10(2): e0117382. doi:10.1371/journal.pone.0117382
Academic Editor:Ian McLoughlin, The University of Science and Technology of China, CHINA
Received:August 13, 2014
Accepted:December 22, 2014
Published:February 24, 2015
Copyright:© 2015 Dafna et al. This is an open access article distributed under the terms of the
Creative Commons Attribution License, which permits unrestricted use, distribution, and reproduction in any medium, provided the original author and source are credited.
Data Availability Statement:All relevant data are within the paper and its Supporting Information files.
Funding:This work was supported by the Israel Ministry of Economics - the Kamin Program, award no. 46168 to YZ and AT. The funder had no role in study design, data collection and analysis, decision to publish, or preparation of the manuscript.
Comparing sleep quality parameters of BSA and PSG demonstrate average error of sleep latency, total sleep time, wake after sleep onset, and sleep efficiency of 16.6 min, 35.8 min, and 29.6 min, and 8%, respectively.
Conclusions
This study provides evidence that sleep-wake activity and sleep quality parameters can be reliably estimated solely using breathing sound analysis. This study highlights the potential of this innovative approach to measure sleep in research and clinical circumstances.
Introduction
Polysomnography (PSG) is currently considered the gold standard for sleep evaluation [1]. This method requires a full night laboratory stay and subjects are connected to numerous elec-trodes and sensors, which are attached on the patient's body. Time series data are aggregated, processed, and visually examined or mathematically transformed in order to reveal insights about sleep-wake states and many aspects of physiology. Moreover, in routine sleep diagnostic procedures, sleep scoring is done manually by applying complex and visual scoring rules simul-taneously on multiple signals acquired by applying contact sensors, e.g., electroencephalogra-phy (EEG), electrooculograelectroencephalogra-phy (EOG), electromyograelectroencephalogra-phy (EMG), electrocardiograelectroencephalogra-phy (ECG), and respiratory activity [1,2]. PSG is time-consuming, tedious, and costly due to complexity and the need for technical expertise.
Currently, the biomedical engineering field of sleep disorders evaluation is on a“fast track” towards ambulatory sleep medicine [3–5]. In recent years, extensive effort has been devoted to seeking alternative simple cost-effective technologies for objective sleep-wake evaluation to in-crease accessibility in sleep disorders diagnosis. These new technologies are based on reduced-channels and sensors, and sophisticated computer-based algorithms [3,4,6–9]. Under the as-sumption that movement is associated with wake phase and lack of movement implies a sleep phase, clinicians and researchers have attempted to measure the binary presence of sleep or wake phases by measuring wrist movements using actigraphy [5,10,11]. Field-based activity monitoring devices are increasingly used as simple and cheap accelerometer-based devices [12–14]. Montgomery-Downs et al. [13] recently reported that this new technology has speci-ficity limitations similar to those of a traditional actigraphy device. These devices consistently misidentify wake as sleep and thus overestimate both sleep time and quality.
We hypothesize that sleep-wake activity can be estimated using audio signal analysis of breathing sounds, which are altered by changes in ventilation and upper airway patency. The ob-jectives of our work are: 1) to develop a breathing sound analysis (BSA) algorithm for distin-guishing between sleep and wake phases using non-contact technology; 2) to reliably estimate sleep quality parameters such as total sleep time, sleep latency, sleep efficiency, wake after sleep onset time, and arousal index; and 3) to validate the proposed algorithms in comparison to PSG.
Methods
This article has online Supporting Information,S1 Dataset.
Setting
University affiliated sleep-wake disorder center and biomedical signal processing laboratory. This study analyzed routinely collected data and the data were analyzed anonymously; there-fore informed consent was not required. The Institutional Review Committee of Soroka Uni-versity Medical Center approved this study protocol (protocol number 10141). The
institutional review board waived the need for written informed consent from the participants.
Subjects
We prospectively recruited 150 consecutive adults (aged 19 to 86 years, 53/97 female/male) referred to the Sleep-Wake Unit for routine PSG study for sleep disorders diagnosis, starting February 2008. We selected the first 80 subjects (patients) for the system design (training) study; the remaining 70 subjects (starting July 2010) were included in the blind validation study. SeeTable 1andTable 2for patient characteristics and sleep quality assessments.
PSG study
Subjects reported to the laboratory at 20:30 and were discharged at 06:00 the following morn-ing. They were encouraged to maintain their usual daily routine and to avoid any caffeine and/ or alcohol intake on the day of the study. The laboratory environment was sleep-friendly ac-cording to recommendations of the National Sleep Foundation [24].
PSG study (SomniPro 19 PSG, Deymed Diagnostic, Hronov, Czech Republic) included EEG (referential derivations, international 10–20 system, C3/A2, C4/A1, and O2/A1, O1/A2), EOG, EMG, ECG, respiratory activity (abdomen and chest effort belts—respiratory inductance plethysmography), oxygen saturation, and snore level intensity (Quest Technology 2700, Or-lando, FL, USA). Simultaneous video monitoring was digitally recorded. PSG scoring includes sleep-wake pattern determined by a trained technician and underwent a second scoring by one
of the investigators (AT); scoring followed the American Academy of Sleep Medicine criteria [1]. The scoring included labeling of each (30 sec) epoch as sleep or wake using the PSG signals—this was used as the gold-standard labeling for the training and validation of the proposed breathing sound analysis system. For labeled data visualization see Figure A inS1 Dataset.
Study protocol
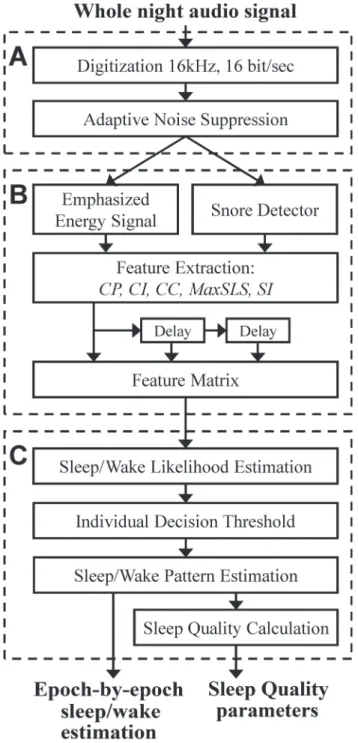
We developed a system for sleep-wake pattern estimation and sleep quality evaluation. The system is composed of a non-contact microphone, digital audio recording device, and an algorithm that estimates sleep and wake states from a full night audio recording (Fig. 1). Using concepts from audio signal processing and pattern recognition techniques, acoustic properties of breathing were classified into two states: sleep and wake. Breathing sounds events were automatically located, seg-mented, and isolated using our breathing detection system [22] that is capable of detecting even low intensity (>20 dB) breathing sounds. This system was validated to distinguish breathing sounds from irrelevant noises, such as movements, linen noises, speech, and other interferences. Using the detected breathing events and the calculated energy signal from the audio recordings, eight acoustic features were developed and extracted per subject; these features express the acous-tic properties of breathing events and emphasize the differences between sleep and wake phases. These eight features were used for training an AdaBoost [25] classifier configured as a time-series model that aimed to classify each 30-sec epoch as sleep or awake. Finally, sleep quality parameters were estimated (i.e., total sleep time, sleep latency, sleep efficiency, wake time after sleep onset, and awakening index). Validation study was performed prospectively on a separate group of con-secutive subjects for whom the breathing analysis was performed using a blind design.
The experimental system
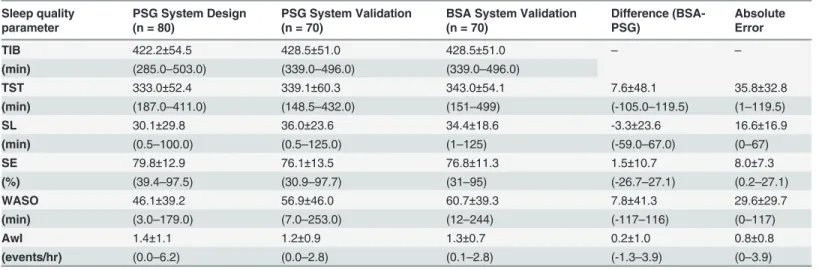
A digital audio recorder device (Edirol R-4 pro, Bellingham, WA, USA) with a directional micro-phone (RØDE, NTG-1, Silverwater, NSW, Australia) placed at a distance of 1 meter above the Table 2. Sleep Quality Parameters.
Sleep quality parameter
PSG System Design (n = 80)
PSG System Validation (n = 70)
BSA System Validation (n = 70)
Difference (BSA-PSG)
Absolute Error
TIB 422.2±54.5 428.5±51.0 428.5±51.0 – –
(min) (285.0–503.0) (339.0–496.0) (339.0–496.0)
TST 333.0±52.4 339.1±60.3 343.0±54.1 7.6±48.1 35.8±32.8
(min) (187.0–411.0) (148.5–432.0) (151–499) (-105.0–119.5) (1–119.5)
SL 30.1±29.8 36.0±23.6 34.4±18.6 -3.3±23.6 16.6±16.9
(min) (0.5–100.0) (0.5–125.0) (1–125) (-59.0–67.0) (0–67)
SE 79.8±12.9 76.1±13.5 76.8±11.3 1.5±10.7 8.0±7.3
(%) (39.4–97.5) (30.9–97.7) (31–95) (-26.7–27.1) (0.2–27.1)
WASO 46.1±39.2 56.9±46.0 60.7±39.3 7.8±41.3 29.6±29.7
(min) (3.0–179.0) (7.0–253.0) (12–244) (-117–116) (0–117)
AwI 1.4±1.1 1.2±0.9 1.3±0.7 0.2±1.0 0.8±0.8
(events/hr) (0.0–6.2) (0.0–2.8) (0.1–2.8) (-1.3–3.9) (0–3.9)
TIB—Time in bed; PSG—Polysomnography; BSA—breathing sound analysis; TST—Total sleep time; SL—Sleep latency; SE—Sleep efficiency; WASO— Wake time after sleep onset; AwI—Awakening index. The differences between the sleep quality parameters as measured by PSG and BSA are presented to show the direction of any bias. Absolute error (difference) was presented to quantify the overall magnitude of differences among measurements. Values are mean±SD (range) between subjects.
subject's head, was used for acquiring the audio signals.Fig. 2A and Eillustrates examples of audio signal (12-sec interval). Data was acquired from a 65-year-old female, body mass index (BMI) of 36 kg/m2, apnea-hypopnea index (AHI) of 12 events/hr. The audio signals were stored along with the PSG signals for later analysis. Each audio signal was synchronized with the PSG study at 15 ms resolution according to cross-correlation technique between the PSG (snore in-tensity level channel) and the digital audio signal (after matching energy sampling rate). Fig 1. Block diagram of the proposed system.The system consists of three main stages: A) Preprocessing and signal enhancement. B) Feature extraction. C) Sleep/wake Estimation.
Fig 2. An example of 24-sec interval of audio signal collected from 65-year-old female, BMI 36, AHI 12.Left column illustrates data collected during sleep; right column illustrates data collected during wake. (A) Audio signal following noise suppression. (B) The corresponding spectrogram (frequency components) of the audio signal in (A). (C) The sorted frequency components according to periodicity measure. (D) The enhanced autocorrelation of the interval calculated from the lower half of the sorted frequency components (C), visualized by the vertical solid line.
The sleep-wake pattern estimation algorithm
To estimate sleep/wake activity from audio signal, several steps must be applied.Fig. 1is the block diagram of the proposed sleep-wake pattern estimation algorithm for the design and vali-dation phases of the study. The algorithm is composed of three basic steps: A) pre-processing, B) feature extraction, and C) sleep-wake pattern estimation. This last step (C) is designed to classify each 30-sec epoch as sleep or awake. It includes classification parameters that were esti-mated (trained) in the design phase; the training was performed using labeled epochs (sleep and wake) that were derived from the PSG study. The outputs of this algorithm are the whole-night sleep-wake pattern and sleep quality parameters.
Preprocessing & noise reduction
For design and validation phases, the acquired audio signals were digitized and stored at 16 kHz, 16 bits per sample. Each audio signal underwent adaptive noise suppression (spectral subtraction) process based on the Wiener-filter. The use of the noise suppression in this system is crucial, since it is designed to emphasize low intensity breathing sounds while suppressing any stationary background noise, such as air-conditioner or fan noises. This process relies on automatically and adaptively tracking background noise segments in order to estimate their spectra and subtracting them from the audio signal [26]. For more information see preprocess-ing section in the supplements part of Dafna et al [22].
Feature extraction
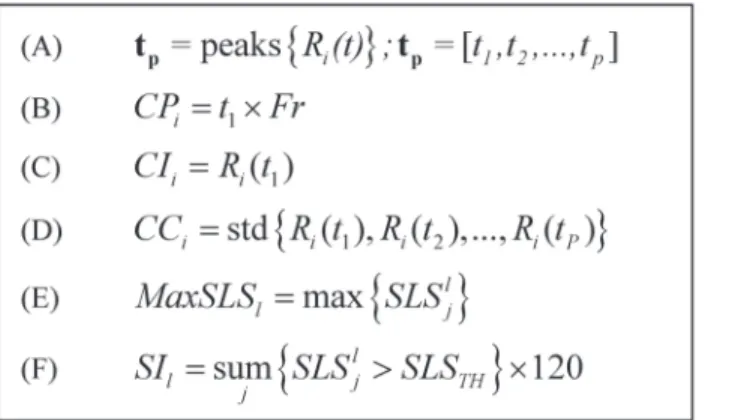
Eight features were extracted from the full-night audio signal; these features can be divided into 2 categories: A)breathing pattern—which is based on periodicity of the energy signal, and B)Snore properties—which are based on snore likelihood scores (SLS) [22].Fig. 3contains the equations used for the feature extraction process.
A) Breathing pattern—these features are designed to capture and quantify breathing pattern such as breathing cycle period, period intensity, and consistency. Since the breathing pattern changes over time, the audio signal is divided into (fixed-length) time intervals. In order to cal-culate breathing pattern features such as breathing rate, each audio interval should consist of at least two breathing cycles. Therefore we chose an interval length of 12 seconds. In each time in-terval the autocorrelation of the audio signal is calculated. The autocorrelation function is a Fig 3. Summary of the equations used for feature extraction process.(A) The function: peaks{} stands for an operator that finds positive peaks and returns their time-frame index. std{} stands for standard-deviation function. Indexirepresents the interval of interest (12 or 24 sec), indexjrepresents thejthsnore index within thelthepoch index. (B) Cycle period feature. (C) Cycle intensity. (D) Cycle consistency. (E) Maximum snore likelihood score in epoch. (F) Snore index.
mathematical tool for finding repeating patterns; informally, it measures the similarity between signal samples as a function of time lag between them [27]. Since the audio signal may contain noises in different frequencies, the autocorrelation was calculated selectively from part of the spectrum in order to emphasize the periodicity of the interval. For this, a spectrogram,X(k,n), was calculated for each interval (Fig. 2B). The spectrogram of theithinterval,Xi(k,n), presents
the running frequency (spectral) components that are calculated from 60-msec signal frames (kis the frequency component index andnis the time frame index). In order to find repeating breathing patterns, we keep the most periodic information in the spectrogram using the auto-correlation function. Therefore, the autoauto-correlation is calculated separately for each frequency component:
Riðk;tÞ ¼
1
N t
XN t
n¼1
Xiðk;nÞ Xiðk;nþtÞ; ð1Þ
wheretis the time-frame-lag index andNrepresents the total number of frames in the interval. For each time interval, we calculate an emphasized version of autocorrelation function. The emphasized autocorrelation function,Ri(t), was calculated as an average function from only
the most periodic frequency components according to theRi(k,t). For that, we sorted the
fre-quency components according to the first peak amplitude value as criterion (seeFig. 3A), and summed the top 50% components (seeFig. 2C). In this stage, theithinterval is represented with a single function of emphasized autocorrelation,Ri(t) (seeFig. 2D). From every 12 sec
time interval, three features are extracted using the emphasized autocorrelation (see equations inFig. 3):Cycle period (CP)—which is the location of the first peak,t1, excluding the
zero-lagged peak;Cycle intensity (CI)—which is the corresponding peak amplitude,Ri(t1); and
Cycle consistency (CC)—which measures how much the breathing pattern is homogenously
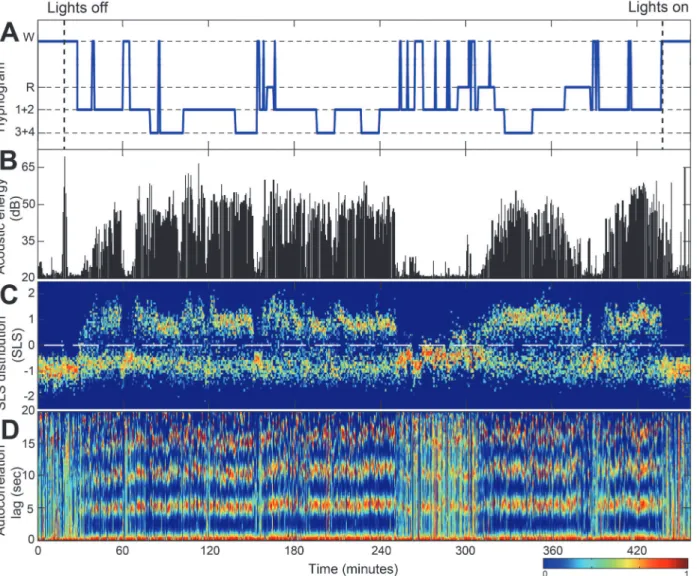
periodic and consistent within an interval. The more harmonic and repetitive the interval, the lower this feature’s value, and vice versa. The same“breathing pattern”feature extraction pro-cess is repeated for 24 sec intervals of the audio signal.Fig. 4presents an example of the run-ning autocorrelation (used for breathing pattern features extraction) and the runrun-ning snore properties calculated from a whole-night audio recording. When observing the acoustic energy during sleep (Fig. 4B), breathing becomes more energetic and noisy (sometimes referred to as snores) compared to wake phase. The probability of snores (SLS distribution,Fig. 4C) is also increased during sleep (SLS>0). The running autocorrelation of the breathing pattern,Ri(t), is
shown inFig. 4D; the running autocorrelation is composed of autocorrelation functions (Fig. 2D) calculated for each epoch (30 sec). Note that sleep episodes exhibit more“zebra-like” stripes patterns compared to the more chaotic one in wake phases, meaning that during sleep, respiration is more periodic, as expected.Fig. 5illustrates the association between the different vigilance states and the main acoustic features, extracted from specific locations (epochs from Fig. 4C, D). It is clearly notable that there is a similar autocorrelation function during sleep ep-ochs (Fig. 5E, F) in contrast to wakefulness (Fig. 5D). In order to match thebreathing pattern's features’time-resolution (24 sec and 12 sec) to the epoch resolution (i.e., 30 sec, the same as the PSG’s hypnogram), thebreathing patternfeatures were linear-interpolated to be sampled at 30 sec resolution.
evidence of sleep phase.Fig. 5left illustrates the association between the different vigilance states and the SLS distribution. It is clearly noticeable that there is a similar SLS histogram dur-ing sleep phases (Fig. 5B, C) in contrast to wakefulness (Fig. 5A). Two features were extracted using this SLS parameter:Maximum SLSin epoch (MaxSLSl) andSnore Index(SIi).MaxSLSl
feature is calculated as the maximum of SLS within 30-sec epochl(seeFig. 3E). The rationale behind this feature is to determine the epoch's maximum likelihood to contain a snore event. The higher this score is, the more probable this epoch is to contain a sleep episode. The second feature issnoring index(SIi) [22], which is the estimation of the number of snores per hour;
this estimation is based on counting the snore events within thelthepoch and multiplying by the number of epochs per hour; seeFig. 3Ffor equation details. It is worth noting that each fea-ture was developed to capfea-ture breathing sound while minimizing the effect of sound intensity Fig 4. Example of whole night recording and main features.(A) Hypnogram determined by PSG. (B) Audio energy signal after noise reduction. (C) SLS distribution. (D) Autocorrelation of the audio signal over time. Warmer colors represent higher values of SLS distribution (C), and higher values of
autocorrelation (D). Note that in (C) during sleep phases there are more SLS values that are above zero (above the horizontal dashed line). In these sleep phases, the autocorrelation (in D) exhibits a more homogeneous stripes pattern compared to the more chaotic behavior in wake phases. For more detailed illustration of the SLS and autocorrelation values during difference vigilance states, seeFig. 5. Data was collected from 52-year-old male, BMI 31. W—wake; R—rapid eye movement (REM); 1+2, 3+4—light and deep non-REM sleep stages, respectively. SLS—snore-likelihood score.
including body posture and distance to microphone [22].Table 3summarizes the extracted features.
Sleep/wake likelihood estimation
Using the eight sleep/wake features, sleep-wake likelihood (SWL) curve is estimated for each patient at 30 second epoch resolution. In this study we chose AdaBoost classifier [25] as a time-series model in which each feature was fed along with two previous epochs (atl-1 andl-2). In this way, the sleep/wake estimation of the current epoch is supported with the previous epochs' estimations; this approach is suitable for a quasi-stationary process such as sleep and wake phases.Fig. 1Bpresents a visualization of the time series feature matrix configuration. General-ly, ak-order AdaBoost classifier involveskbinary discriminations in ad-dimensional feature space (in our cased= 24, 8×3), based on the true labeling of the epochs. In the design phase, the classifier parameters were estimated to discriminate two classes: sleep and awake. Sleep was assigned the value '-1' and wake with '+1' (arbitrarily to match the hypnogram), hence produc-ing a linear estimation within that range, i.e., a sleep epoch is more likely to have a negative score than a wake phase. The optimal order was found to bek= 100 empirically.Fig. 6shows a typical example of SWL curve estimated from whole-night audio recording of a subject from Fig 5. Detailed presentation of the SLS and autocorrelation values during different 30 sec epochs of wake (A, D), REM (B, E), and NREM (C, F).Left panel (A-C): SLS distribution (snore properties), right panel (D-F): autocorrelation function (breathing pattern periodicity). Data is presented from three epochs (wake, REM, NREM) derived fromFig. 4C and D. The dashed line in the left panel represents the decision threshold for snore detection (SLS = 0); higher SLS values indicate greater likelihood of snore event. REM—rapid eye movement, NREM—non-REM.
the validation design set. Higher values of SWL indicate increased likelihood towards wake state. Note the impressive similarity between the Hypnogram (Fig. 6B) and the proposed acoustic-based SWL curve (Fig. 6C). It should be emphasized that there is a considerable in-crease in SWL values as soon as wake initiates and it declines immediately during sleep onset.
doi:10.1371/journal.pone.0117382.t003
Fig 6. Example of sleep-wake likelihood (SWL) score curve.(A) Audio signal of whole-night recording. (B) Hypnogram. (C) The estimated whole-night SWL score curve. SWL was calculated using the eight acoustic features fed into AdaBoost classifier. Higher values of SWL indicate increased likelihood towards wake state. When focusing on sleep and wake phases, note the similarity between the hypnogram (B) and the SWL (C). The horizontal dashed line represents the corresponding individual decision threshold over time; for more details see main body. Data was collected from 52-year-old male, BMI 31.
Individual decision threshold
Since breathing properties can vary between subjects, we found that applying an individual de-cision threshold improved system performance. Firstly, for each subject, a likelihood threshold (LTH) was calculated using his SWL epoch scores (example presented inFig. 6C). These SWL
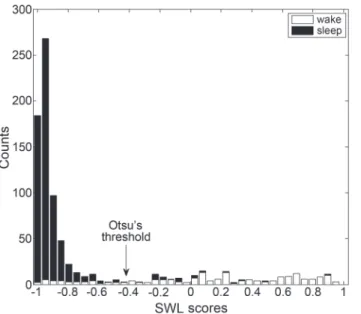
values' distribution (histogram) is considered to behave as a bi-modal distribution, since it is assumed to be composed of sleep and wake phases. The threshold was determined using Otsu’s method [28], which searches for the threshold that minimizes the intra-class variance (see Fig. 7). Secondly, according to our preliminary results, we modified the fixedLTHto better cope
with pinpointing the beginning of sleep, as it may considerably affect estimation of sleep pa-rameters. Therefore, for the first 90 minutes of the recording, the threshold gradually decreases, starting from a higher value towardsLTH, in order to reduce false detection of sleep epochs:
LTHðtÞ ¼LTHþmaxf0:5 t=360;0g; ð2Þ
wheretrepresents the time index of the epoch, and 360 is a parameter empirically obtained using the design SWL distribution. Note that higherLTHscores will reduce false detection of
sleep episodes. SeeFig. 6Cfor demonstration.
Sleep quality parameterization
Using the detected sleep-wake states, we calculated five sleep quality parameters:1)Total sleep time(TST)—actual sleep time in a sleep period; equal to total sleep period less movement and awake time. Total sleep time is the total of all REMS and NREMS in a sleep period.2)Sleep la-tency(SL)—time period measured from“lights out”, or bedtime, to the beginning of sleep. We measured from start of the recording.3)Sleep efficiency(SE)—The ratio of total sleep time to time in bed.4)Wake time after sleep onset(WASO)—the time spent awake after sleep has been initiated and before final awakening.5)Awakening index(AwI)—the average awakening per hour of time in bed.
Fig 7. Example of individual decision threshold determination.Stacked-bar-histogram of SWL scores of one subject. Black bars represent sleep epoch scores and white bars represent wake epoch scores. The individual threshold (arrow) was calculated using Otsu's method [28].
Data and statistical analyses
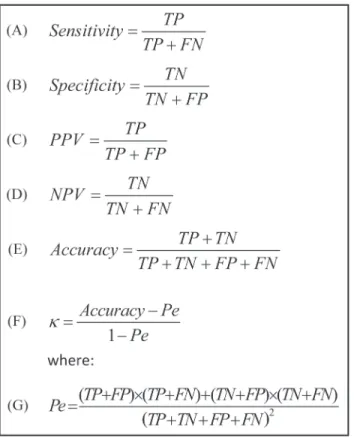
Audio signal processing and statistical analyses were performed using MATLAB (R-2012b, The MathWorks, Inc., Natick, MA, USA). Both the system design study (n= 80) and the vali-dation study (n= 70) had similar data handling protocols. A sample size of 64 subjects was cal-culated to provide a statistical power of 0.80 (α= 0.05) in order to achieve>0.45 Cohen's kappa agreement (sleep/wake estimation) for each subject. Therefore, 70 subjects were re-cruited for the validation study. PSG, demographic, and audio data were compared between design and validation study groups using unpaired two-tailed studentt-test orχ2test. Epoch-by-epoch sleep-wake estimation performances were calculated using sensitivity (Fig. 8A), spec-ificity (Fig. 8B), positive and negative predictive values (Fig. 8C and D), accuracy (Fig. 8E), and Cohen's kappa (Fig. 8F). We denote“sleep”as positive of interest and“wake”as negative. HenceTP(true positive) andTN(true negative) represent the counts of true detection of sleep as sleep and wake as wake, respectively. In addition, performances for different working points were obtained from a receiver-operating curve (ROC) and the area under its curve (AUC). Cohen's kappa values are usually associated with five agreement categories [27] (0–0.2 is slight, 0.2–0.4 is fair, 0.4–0.6 is moderate, 0.6–0.8 is substantial, and 0.8–1 is almost perfect). To assess how parameters such as age, gender, BMI, AHI, and signal-to-noise-ratio (SNR) affected the kappa agreement of our BSA system, we tested the person correlation coefficient for each of these parameters.
Fig 8. Epoch-by-epoch sleep-wake performance evaluation equations.All of these equations rely on four basic classification parameters: True positive (TP), true negative (TN), false positive (FP), and false negative (FN). We denote 'sleep' as positive and 'wake' as negative. PPV and NPV stand for positive and negative predictive values, respectively.κ—the Cohen's kappa coefficient.Pe—probability of agreement
by chance.
In the analyses, first, for each subject in the validation dataset, we performed epoch detec-tion performances as described above. A global average and standard deviadetec-tion were calculated among all validation subjects. Second, based on the estimated epochs, for each subject, we cal-culated the five sleep quality parameters and compared to PSG. Then a global average and stan-dard deviation were calculated among subjects. For better visualization of system performance, we presented each subject's sleep quality parameter using Bland-Altman plot method [29].
Results
Subjects and PSG characteristics
One hundred and fifty subjects referred to PSG evaluation of sleep disorders were included in our study (Table 1). An average of 7.1±0.9 hours of audio signals were recorded from each sub-ject with no significant differences between design and validation studies; a total of 562.9 hours and 499.9 hours were analyzed in the design and validation studies, respectively (Table 2). No significant differences in subject anthropometric parameters (Table 1) and sleep quality param-eters (Table 2) were found between system design and validation study groups. As a group, both design and validation patients have moderate obstructive sleep apnea and fragmented sleep. In this study we included 127,668 manually examined epochs: 59,108 design study and 68,560 validation study. Figure A inS1 Datasetillustrates individual big-data visualization for the design study (n = 80) and validation study (n = 70).
Feature extraction
Eight acoustic features were developed in this study (Table 3). These features were calculated at different interval durations in order to capture breathing sounds and to extract sleep-wake pat-tern information. These features are based on short- and long-term analyses, and later were ad-justed to construct a time-series feature matrix at a 30 sec epoch resolution.Fig. 6Dshows an example of sleep-wake prediction according to each of the developed features from a 52-year-old male, AHI 22 events/hr, BMI 31 kg/m2. Note that each feature exhibits the actual sleep-wake pattern determined by PSG.
Fig. 9presents evaluation (kappa values) of each individual feature to distinguish between sleep and wake epochs using the study validation dataset. Each feature is presented as a box-plot, measuring the quartile distribution of kappa agreements of sleep-wake epochs among var-ious patients. Note the relatively wide range of kappa values, indicating the large variability between subjects. The median kappa agreement of each feature is between 0.2 and 0.4. Howev-er, when combining all features, the overall kappa agreement is improved to a narrower distri-bution, i.e., median kappa of 0.5 and quartiles of 0.4 to 0.7.
Sleep/wake pattern estimation
During the design phase, an AdaBoost model was trained on the entire design dataset in order to classify sleep and wake epochs. Based on the SWL score for each subject, an individual threshold was picked to better fit the global sleep-wake model to the individual. Each subject’s scores (for sleep and awake epochs) were shifted using this threshold value, allowing adaptation for the global sleep-wake model to better fit the individual subject. Moreover, global alignment of the scores from all the subjects will allow standardization and overall evaluation of system performance. On average, the individualLTHimproved system accuracy by 3%.Fig. 6Cshows
Epoch-by-epoch system performances (sleep/wake estimation) were analyzed for each sub-ject (individual performances). Based on the individual performances, we calculated a global mean and standard deviation between subjects.Table 4shows the comparison between the proposed BSA and PSG for the entire group of subjects using the validation dataset. The overall (global) accuracy between subjects of the BSA system was 0.833. The sensitivity (detecting sleep epochs as sleep epochs) was 0.922 and the specificity was 0.566. Cohen's kappa agreement was 0.508. The ROC curve (Fig. 10, solid line) has an area under the curve of 0.829. Accuracy, sensitivity, specificity, positive and negative predictive values, area under the curve, and Cohen's kappa were also calculated for the entire pool of validation epochs (regardless of sub-jects’epoch origin), and no discernable differences were observed between the two cases (data not shown). To assess how parameters such as age, gender, BMI, AHI, and SNR affected the kappa agreement of our breathing sound analysis (BSA) system, we tested the Pearson correla-tion coefficient for each of these parameters. Our calculacorrela-tions reveal negligible correlacorrela-tions (<0.1) for age, gender, BMI, and AHI. Correlation between system performances and breath-ing SNR reveals positive correlation of 0.37 (p<.001) (Figure B inS1 Dataset).
Table 4. Performance of BSA vs. PSG classification (epoch-by-epoch).
Performance SEN SPC PPV NPV ACU AUC kappa
Subject's Mean .922 .566 .859 .723 .833 .829 .508
Subject's standard deviation .078 .179 .102 .184 .076 .065 .156
SEN = sensitivity; SPC = Specificity; PPV = Positive predictive value; NPV = negative predictive value; ACU = accuracy; AUC = Area under ROC curve; kappa = Cohen's kappa coefficient. The mean and standard deviation values represent the distributions of subject's performances (validation dataset).
doi:10.1371/journal.pone.0117382.t004
Fig 9. Feature performances.Boxplot representing the distribution of kappa agreement values for all subjects within the validation dataset using Otsu's threshold [28]. The rightmost box represents the agreement derived using all features as a group (using the AdaBoost classifier).
Sleep quality parameterization
No significant differences in sleep quality parameters as measured by PSG and BSA were found (Table 2). The differences between the sleep quality parameters as measured by PSG and BSA are presented to show the direction of any bias. The average difference between SPG and BSA were: TST (7.6±48.1 min), SL (-3.3±23.5 min), SE (1.5±10.7%), WASO (7.8±41.3 min), and AwI (0.2±1.0 per hr). Moreover, the absolute error (differences) was presented to quantify the overall magnitude of differences among measurements. The absolute error between SPG and BSA were: TST (35.8±32.8 min), SL (16.6±16.9 min), SE (8.0±7.3%), WASO (29.6±29.7 min), and AwI (0.8±0.8 per hr).Fig. 11A-Eshows evaluation of five sleep quality parameters: TST, SL, SE, WASO, and AwI, according to the Bland-Altman plot. Examining the Bland-Altman plots and comparing the proposed breathing sound analysis (BSA) approach versus PSG, we found good agreement. All sleep quality parameters show no major consistent bias (Fig. 11and Table 2). The plots also show (for SL, WASO, and AI) that the BSA values are closely matched to PSG in the left part of the plot, and therefore present less difference when the parameter val-ues are relatively small; this implies reliability of the estimated parameters.
Discussion
In this paper a novel method for evaluation of sleep-wake patterns using non-contact micro-phone is proposed. This method utilizes analysis of breathing sounds and machine-learning techniques in order to reliably estimate sleep-wake activity and to reliably estimate sleep quality parameters. The main idea beyond this approach is that central control of ventilation and upper airway patency are strongly affected by sleep and wake activity [4,15]. The human upper airway is a complicated structure comprising a number of muscles whose functional integra-tion is essential for several complex tasks including speech [30] and breathing [20]. From the respiratory perspective, the primary goal of these pharyngeal muscles is to keep the airway Fig 10. Receiver operating characteristics (ROC) plot of epoch-by-epoch sleep/wake estimation system performances.Solid line represents the TP of the system as a function of FP, the dashed line represents the accuracy as a function of FP. Dot-dashed line represents the random-guess performance. TP—True positive of detecting sleep epochs. FP—false positive.
open. While the pharyngeal muscles manage this task with relative ease during wakefulness, their activity is often diminished at sleep onset [19,31,32]. During sleep, there is a considerable increase of upper airway resistance [4,17,18,33] due to decreased activity of the pharyngeal di-lator muscles [19,20]. This elevated resistance is reflected by amplification of air-pressure oscil-lations in the upper airways during breathing. These air-pressure osciloscil-lations are perceived as typical breathing sounds during sleep. In contrast, during wakefulness, there is an increase in activity of the upper airway dilating muscles, hence decreased upper airway resistance [19] and airway oscillations.
This study provides evidence that by audio analysis of breathing sounds, the breathing pat-tern and hence the sleep-wake activity can be estimated. We developed and validated a system that incorporates eight features (extracted mainly from the audio energy signal; seeMethods) Fig 11. Bland-Altman plot of the PSG & BSA.X-axis represents the mean sleep parameter value between the PSG & BSA (in the relevant parameter units). The Y-axis is the difference between the PSG and BSA sleep quality parameter. The dashed lines represent the 95% CI. (A) SL—Sleep latency, (B) TST—Total sleep time, (C) SE—Sleep efficiency, (D) WASO—Wake time after sleep onset, (E) AwI—the average awakening per hour of time in bed.
that were designed to measure and quantify breathing pattern and breathing properties. These features were used for training an AdaBoost [25] classification model to estimate sleep and wake activity at 30 sec epoch resolution. Using the estimated epoch labels (sleep/wake), we cal-culated five acceptable sleep quality parameters. System performances were analyzed
epoch-by-epoch. The accuracy was 0.833, the sensitivity was 0.922, and the specificity was 0.566. Cohen's kappa agreement was 0.508. When analyzing sleep quality parameters (BSA vs. PSG), the average error (in minutes) of sleep-latency, total sleep time, and wake after sleep onset was 16.6, 35.8, and 29.6, respectively.
Breathing signals and analysis
Extracting sleep-wake activity pattern from breathing sounds using a non-contact microphone is challenging. Since breathing sounds may be“contaminated”by background noise, it is essen-tial to improve SNR prior to analysis in order to enhance the breathing events. To achieve this, we used an adaptive spectral subtraction technique [26] that subtracts the estimated back-ground noise. This technique is acceptable in the speech and audio signal enhancement field [34]; however, it was not fully explored on whole-night breathing sounds. By applying this technique, background noise was considerably reduced, similar to earlier studies [22,34].
We developed a unique set of features that are specifically designed to distinguish between sleep and wake phases (Table 3,Fig. 4). These features can be categorized into two categories:
breathing patternandsnore-characteristics. Thebreathing patternfeatures are designed to cap-ture and to quantify variations in breathing periodicity as they may contribute to distinguishing between sleep and wake epochs. The basic idea here is that the new developed features: CP, CC, and CI (collectively named“periodicity features”; seeMethods) are strongly influenced by breathing properties, such as rate and consistency. It was well established that changes in vigi-lance states strongly affect breathing rate and regularity in humans and animals [4,16,19,33,35– 39]. Thesnore-characteristicsfeatures are designed to find the probability of a given epoch to contain snores. The basic idea is that the probability of detecting snoring events is increased dur-ing sleep. Snordur-ing is caused by the vibration of soft tissue in the upper airways due to elevated upper airway resistance during sleep [21]. Recently, it was shown that snore analysis may carry valuable information about sleep conditions [23,40]. In order to calculate these
snore-characteristicsfeatures, we used our high performance (>98% detection accuracy rate) snore de-tector [22] module. By using all these (eight) features as a multi-dimensional input to our sleep-wake classifier, the performances were superior to using each feature separately (Fig. 9).
We used the AdaBoost [25] algorithm to classify epochs as sleep or wake. The main advantage of this algorithm is its ability to discriminate multi-dimensional complex-patterns using a non-parametric, non-linear boundary threshold [25]. The use of this kind of classifier was supported by an earlier study [41], which claimed that sleep and wake activity (using wrist-actigraph) should be discriminated using non-linear classifiers. In addition, other studies have shown that there is a strong correlation between the labels (sleep/wake) of adjacent (30 sec) epochs [28,42]. Therefore, we configured our AdaBoost classifier as a time-series model, in which the prediction of each epoch state is influenced by the adjacent epochs, i.e., it is unlikely (though it's possible) to find a fragmented sequence of [wake-sleep-wake] and vice versa. In our earlier study [43] we also explored the effect of different classifiers such as two states hidden Markov models [44]. The time-series AdaBoost classifier was found to produce the best results and therefore was chosen.
Comparison to existing approaches
tested scientifically [13]. Our BSA system yields matched and even superior performances rela-tive to an actigraph technology. Furthermore, in our system, according to Bland-Altman plot (Fig. 11), all sleep quality parameters showed no consistent bias, where actigraphy-based tech-nology showed some bias in the sleep quality parameters [11,47,48]. When calculating the aver-age error (mean absolute difference) of the sleep quality parameters between PSG and
actigraph, Lotjonen at el. [46] and Blackwell et al. [49] showed a TST estimation error of 54 min and 44 min, respectively. Blackwell et al. [49] also calculated the estimation error of SE and WASO; they showed an average error of 9.8% for sleep efficiency and 39 min for WASO. By comparing the errors of these sleep quality parameters, our BSA system yields superior per-formances (TST 35.8 min, SE 8%, and WASO 29.6 min).
In addition to actigraphy-based methods, some researchers took movement detection even further in order to estimate sleep and wake activity in non-contact technologies [50–52]. Col-lectively, these studies showed performances that are inferior to or close to actigraphy-based approaches. It is generally recognized that body-movement-based technologies (contact and non-contact) are biased [9,11,47,48], since any lack of movement is interpreted as sleep, while movement is interpreted as awake. In contrast, our approach of estimating sleep-wake from breathing sounds is based on the notion that during sleep onset there are considerable changes in upper airway mechanics, affecting airflow and pressure oscillations. In contrast to these movement-based technologies, we found that our system performance is not influenced by any physiological variables, such as age, BMI, AHI, and gender.
Strengths and limitations
Summary
One of the main goals of sleep medicine today is to improve early diagnosis and treatment of the“flood”of subjects presenting with sleep disorders. New simple technologies are needed in order to improve patient accessibility to sleep diagnosis; this in turn will reduce the cost of management and treatment [53], and improve quality of life and health.
This study presents a pioneering approach for determining sleep-wake pattern using non-contact audio-based signals. We found that by analyzing breathing sounds a reliable estimation of sleep quality parameters can be achieved. This study highlights the potential of breathing sound analysis to measure sleep in research and clinical situations.
Supporting Information
S1 Dataset. This file contains Figure A and Figure B.Figure A, Individual big-data visualiza-tion for the study design (training, n = 80) and validavisualiza-tion (testing, n = 70): design dataset— upper panels; validation dataset—lower panels. Each horizontal line represents one individual’s data. Sleep/wake activity pattern was manually annotated epoch-by-epoch using polysomno-graphy (PSG) scoring criteria. Note the large individual differences in sleep-wake pattern, espe-cially the sleep latency (from time zero to the first black mark of sleep) and the large individual variability of awakening during sleep (mustard colors between black regions). The onset of the gray area indicates study termination for each individual. Cohen's kappa (epoch-by-epoch sleep/wake) agreement score for each subject was calculated comparing our proposed breath-ing sound analysis (BSA) system and the PSG scorbreath-ing. For study protocol, see main body of the manuscript. Figure B, The correlation between sleep-wake estimation performances (using kappa score) and subject's breathing sound recording quality (signal to noise ratio, SNR). Each dot represents the mean SNR of one individual from the validation (testing) dataset (n = 70). (PDF)
Acknowledgments
We would like to thank Ms. Bruria Freidman from the Sleep Wake Disorder Unit of Soroka University Medical Center, for her support and collaboration.
Soroka University Medical Center Institutional Review Board protocol approval number: 10141.
Author Contributions
Conceived and designed the experiments: ED AT YZ. Performed the experiments: ED YZ. An-alyzed the data: ED YZ. Contributed reagents/materials/analysis tools: ED AT YZ. Wrote the paper: ED AT YZ. Designed the software used in analysis: ED YZ.
References
1. Iber C, Ancoli-Israel S, Chesson A, Quan SF (2007) The AASM Manual for the Scoring of Sleep and As-sociated Events: Rules, Terminology, and Tech-nical Specifications; 1, editor. Westchester, IL: The American Academy of Sleep Medicine.
2. Collop N, Anderson WM, Boehlecke B, Claman D, Goldberg R, et al. (2007) Clinical guidelines for the use of unattended portable monitors in the diagnosis of obstructive sleep apnea in adult patients. J Clin Sleep Med 3: 737–747. PMID:18198809
3. Hedner J, Pillar G, Pittman SD, Zou D, Grote L, et al. (2004) A novel adaptive wrist actigraphy algorithm for sleep-wake assessment in sleep apnea patients. Sleep 27: 1560–1566. PMID:15683148
4. Colrain IM, Trinder J, Fraser G, Wilson G (1989) Ventilation during sleep onset: University of Tasmania.
11. Marino M, Li Y, Rueschman MN, Winkelman J, Ellenbogen J, et al. (2012) Measuring sleep: accuracy, sensitivity, and specificity of wrist actigraphy compared to polysomnography. Sleep 36: 1747–1755.
12. Appelboom G, Camacho E, Abraham ME, Bruce SS, Dumont EL, et al. (2014) Smart wearable body sensors for patient self-assessment and monitoring. Archives of Public Health 72: 28. doi:10.1186/ 2049-3258-72-28PMID:25232478
13. Montgomery-Downs HE, Insana SP, Bond JA (2012) Movement toward a novel activity monitoring de-vice. Sleep and Breathing 16: 913–917. doi:10.1007/s11325-011-0585-yPMID:21971963
14. Vashist SK, Schneider EM, Luong JH (2014) Commercial Smartphone-Based Devices and Smart Ap-plications for Personalized Healthcare Monitoring and Management. Diagnostics 4: 104–128.
15. Malik V, Smith D (2012) Respiratory Physiology During Sleep. Sleep Medicine Clinics 7: 497–505.
16. Phillipson EA (1978) Respiratory adaptations in sleep. Annual review of Physiology 40: 133–156. PMID:345949
17. Trinder J, Whitworth F, Kay A, Wilkin P (1992) Respiratory instability during sleep onset. Journal of Ap-plied Physiology 73: 2462–2462. PMID:1490959
18. Trinder J, Kay A, Kleiman J, Dunai J (1997) Gender differences in airway resistance during sleep. Jour-nal of applied physiology 83: 1986–1997. PMID:9390972
19. Worsnop C, Kay A, Kim Y, Trinder J, Pierce R (2000) Effect of age on sleep onset-related changes in respiratory pump and upper airway muscle function. Journal of Applied Physiology 88: 1831–1839. PMID:10797148
20. Edwards BA, White DP (2011) Control of the pharyngeal musculature during wakefulness and sleep: implications in normal controls and sleep apnea. Head & neck 33: S37–S45.
21. Hoffstein V, Mateika S, Anderson D (1994) Snoring: is it in the ear of the beholder? Sleep 17: 522–526. PMID:7809565
22. Dafna E, Tarasiuk A, Zigel Y (2013) Automatic Detection of Whole Night Snoring Events Using Non-Contact Microphone. PLoS One 8: e84139. doi:10.1371/journal.pone.0084139PMID:24391903
23. Ben-Israel N, Tarasiuk A, Zigel Y (2012) Obstructive apnea hypopnea index estimation by analysis of nocturnal snoring signals in adults. Sleep 35: 1299–1305C. doi:10.5665/sleep.2092PMID:22942509
24. National Sleep Foundation. Avalible:http://sleepfoundation.org/bedroom/. Accessed 2014 Dec 30.
25. Freund YS, Schapire RE (1997) A decision-theoretic generalization of on-line learning and an applica-tion to boosting. Journal of Computer and System Sciences 55: 119–139.
26. Scalart P (1996) Speech enhancement based on a priori signal to noise estimation. Conf Proc IEEE In-ternational Conference on Acoustics, Speech, and Signal Processing 2: 629–632.
27. Landis JR, Koch GG (1977) The measurement of observer agreement for categorical data. biometrics 33: 159–174. PMID:843571
28. Kim J, Lee J-S, Robinson P, Jeong D-U (2009) Markov analysis of sleep dynamics. Physical review let-ters 102: 178104. PMID:19518839
29. Martin Bland J, Altman D (1986) Statistical methods for assessing agreement between two methods of clinical measurement. The lancet 327: 307–310.
30. Goldshtein E, Tarasiuk A, Zigel Y (2011) Automatic detection of obstructive sleep apnea using speech signals. Biomedical Engineering, IEEE Transactions on 58: 1373–1382. doi:10.1109/TBME.2010. 2100096PMID:21172747
32. Fogel RB, Trinder J, White DP, Malhotra A, Raneri J, et al. (2005) The effect of sleep onset on upper air-way muscle activity in patients with sleep apnoea versus controls. The Journal of physiology 564: 549–562. PMID:15695240
33. Smith L, Schwartz AR (2012) Effect of end-expiratory lung volume on upper airway. J Appl Physiol 113: 691–699. doi:10.1152/japplphysiol.00091.2012PMID:22628372
34. Hasan MK, Salahuddin S, Khan MR (2004) A modified a priori SNR for speech enhancement using spectral subtraction rules. IEEE Signal Processing Letters 11: 450–453.
35. Coote J (1982) Respiratory and circulatory control during sleep. Journal of Experimental Biology 100: 223–244. PMID:6757369
36. Coote J, Tsang G, Baker A, Stone B (1993) Respiratory changes and structure of sleep in young high-altitude dwellers in the Andes of Peru. European journal of applied physiology and occupational physi-ology 66: 249–253. PMID:8477682
37. Douglas N, White D, Pickett C, Weil J, Zwillich C (1982) Respiration during sleep in normal man. Thorax 37: 840–844. PMID:7164002
38. Kantelhardt JW, Penzel T, Rostig S, Becker HF, Havlin S, et al. (2003) Breathing during REM and non-REM sleep: correlated versus uncorrelated behaviour. Physica A: Statistical Mechanics and its Applica-tions 319: 447–457.
39. Rostig S, Kantelhardt JW, Penzel T, Cassel W, Peter JH, et al. (2005) Nonrandom variability of respira-tion during sleep in healthy humans. Sleep 28: 411. PMID:16171285
40. Akhter S, Abeyratne UR, Swarnkar V (2013) Variations of snoring properties with macro sleep stages in a population of Obstructive Sleep Apnea patients. Conf Proc IEEE Eng Med Biol Soc 2013: 1318–1321. doi:10.1109/EMBC.2013.6609751PMID:24109938
41. Tilmanne J, Urbain J, Kothare MV, Wouwer AV, Kothare SV (2009) Algorithms for sleep–wake identifi-cation using actigraphy: a comparative study and new results. Journal of sleep research 18: 85–98. doi:10.1111/j.1365-2869.2008.00706.xPMID:19250177
42. Robinson P, Phillips A, Fulcher B, Puckeridge M, Roberts J (2011) Quantitative modelling of sleep dy-namics. Philosophical Transactions of the Royal Society A: Mathematical, Physical and Engineering Sciences 369: 3840–3854.
43. Dafna E, Tarasiuk A, Zigel Y (2012) Sleep-quality assessment from full night audio recordings of sleep apnea patients. 34th Annual International IEEE EMBS Conference, IEEE EMBS. San diego.
44. Elliott RJ, Aggoun L, Moore JB (1995) Hidden Markov Models: Springer.
45. Acebo C, Sadeh A, Seifer R, Tzischinsky O, Wolfson A, et al. (1999) Estimating sleep patterns with ac-tivity monitoring in children and adolescents: how many nights are necessary for reliable measures? Sleep 22: 95–103. PMID:9989370
46. Lotjonen J, Korhonen I, Hirvonen K, Eskelinen S, Myllymaki M, et al. (2003) Automatic sleep-wake and nap analysis with a new wrist worn online activity monitoring device vivago WristCare. Sleep 26: 86–90. PMID:12627738
47. Lichstein KL, Stone KC, Donaldson J, Nau SD, Soeffing JP, et al. (2006) Actigraphy validation with in-somnia. Sleep 29: 232. PMID:16494091
48. Ancoli-Israel S, Cole R, Alessi C, Chambers M, Moorcroft W, et al. (2003) The role of actigraphy in the study of sleep and circadian rhythms. American Academy of Sleep Medicine Review Paper. Sleep 26: 342–392. PMID:12749557
49. Blackwell T, Redline S, Ancoli-Israel S, Schneider JL, Surovec S, et al. (2008) Comparison of sleep pa-rameters from actigraphy and polysomnography in older women: the SOF study. Sleep 31: 283. PMID: 18274276
50. Liao WH, Yang CM (2008) Video-based Activity and Movement Pattern Analysis in Overnight Sleep Studies. 19th International Conference on Pattern Recognition, Vols 1–6: 1774–1777.
51. De Chazal P, Fox N, O’hare E, Heneghan C, Zaffaroni A, et al. (2011) Sleep/wake measurement using a non‐contact biomotion sensor. Journal of sleep research 20: 356–366. doi:10.1111/j.1365-2869. 2010.00876.xPMID:20704645
52. Scatena M, Dittoni S, Maviglia R, Frusciante R, Testani E, et al. (2012) An integrated video-analysis software system designed for movement detection and sleep analysis. Validation of a tool for the beha-vioural study of sleep. Clinical Neurophysiology 123: 318–323. doi:10.1016/j.clinph.2011.07.026 PMID:21873109