CREB Targets Define the Gene Expression
Signature of Malignancies Having Reduced
Levels of the Tumor Suppressor
Tristetraprolin
Mohammad Fallahi1, Antonio L. Amelio2, John L. Cleveland3, Robert J. Rounbehler3*
1.Informatics Core, The Scripps Research Institute, Scripps Florida, Jupiter, FL, United States of America,2.
Lineberger Comprehensive Cancer Center, School of Dentistry, University of North Carolina at Chapel Hill, Chapel Hill, NC, United States of America,3.Department of Tumor Biology, H. Lee Moffitt Cancer Center and Research Institute, Tampa, FL, United States of America
Abstract
The RNA-binding protein Tristetraprolin (TTP, ZFP36) functions as a tumor suppressor that impairs the development and disables the maintenance of MYC-driven lymphoma. In addition, other human cancers expressed reduced levels of
TTP, suggesting that it may function as a tumor suppressor in several malignancies. To identify genes that may be associated with TTP tumor suppressor functions in human cancer, we analyzed The Cancer Genome Atlas (TCGA) breast cancer, lung adenocarcinoma, lung squamous cell carcinoma, and colon adenocarcinoma datasets. These analyses defined a signature of 50 genes differentially regulated between high and low TTP-expressing tumors. Notably, patients with low
TTP-expressing breast cancer and lung adenocarcinoma had decreased survival rates and more aggressive tumors with increased necrosis. In addition, analysis across non-TCGA tumor gene expression databases identified a broad spectrum of human cancers having similarities with theTTP-low tumor gene signature, including pancreatic, bladder, and prostate cancer. TTP has documented roles in regulating mRNAs encoding inflammatory proteins, and pathway analysis identified several inflammatory pathways that are altered in tumors with low TTPexpression. Surprisingly, the TTP-low tumor gene signature includes a core component of 20 under-expressed CREB target genes, suggesting that the regulation of CREB activity may be related to the tumor suppressor function of TTP. Thus, reduced levels of TTP are a potential biomarker for human cancers with poor outcome, and OPEN ACCESS
Citation:Fallahi M, Amelio AL, Cleveland JL, Rounbehler RJ (2014) CREB Targets Define the Gene Expression Signature of Malignancies Having Reduced Levels of the Tumor Suppressor Tristetraprolin. PLoS ONE 9(12): e115517. doi:10. 1371/journal.pone.0115517
Editor:Carol J. Wilusz, Colorado State University, United States of America
Received:March 6, 2014
Accepted:November 25, 2014
Published:December 26, 2014
Copyright:ß2014 Fallahi et al. This is an
open-access article distributed under the terms of the
Creative Commons Attribution License, which permits unrestricted use, distribution, and repro-duction in any medium, provided the original author and source are credited.
Data Availability:The authors confirm that all data underlying the findings are fully available without restriction. The datasets we used for our manu-script are available through The Cancer Genome Atlas portal: http://tcga-data.nci.nih.gov/ These datasets were generated by The Cancer Genome Atlas and they have made them publicly available.
Funding:This work is supported by NIH grants (R01-CA167093 to J.L.C. and K99-CA157954 to A.L.A.), by monies from the ThinkPink Kids Foundation (J.L.C.), by monies from the State of Florida to TSRI (J.L.C.), and UNC University Cancer Research Funds (A.L.A.). This work was also supported in part by NCI Comprehensive Cancer Center Grants P30-CA076292 awarded to the H. Lee Moffitt Cancer Center & Research Institute and P30-CA016086 awarded to the Lineberger Comprehensive Cancer Center. The funders had no role in study design, data collection and analysis, decision to publish, or preparation of the manuscript.
targeting the CREB pathway may be a therapeutic route for treating aggressive
TTP-low tumors.
Introduction
The Cancer Genome Atlas (TCGA) is a comprehensive project aimed at capturing the genomic and clinical details of more than 20 different types of cancer, with data from hundreds of patients for each tumor type [1]. Even though specific anatomical and histological features have historically defined cancer, in this age of genomics it has become evident that genetic alterations in tumors even within a given subtype are unique from one patient to another, underscoring the need for personalized cancer therapies. To move towards the ultimate goal of personalizing cancer treatment it is necessary to identify novel molecular biomarkers and therapeutic targets that serve as the basis for developing treatment options. Accordingly, here we utilized several TCGA datasets to define the gene expression signature of malignancies that express reduced levels of the newly discovered tumor suppressor Tristetraprolin (TTP, ZFP36) [2].
TTP functions in the post-transcriptional control of short-lived mRNAs having adenosine-uridine (AU)-rich elements (AREs) located in their 39 untranslated regions (39UTRs). Notably, genomic analysis has shown that at least 11% of all human genes contain AREs, and, pertinent to this study, all ten of the molecular mechanisms defined as the ‘‘Hallmarks of Cancer’’ include genes that contain AREs [3,4]. AREs are bound by a class of proteins, including TTP, called AU-binding proteins (AUBPs), which either stabilize these transcripts or direct their destruction [5]. The NMR structure of TIS11D showed that the tandem zinc-finger domains, common to all TTP family members, bind to the nonameric 59
-UUAUUUAUU-39motif present in its mRNA targets; however, recent global
analysis has shown that TTP can also bind to shorter ARE regions [6–8]. Upon binding, TTP transports its cargo to regions of the cell known as processing bodies (P-bodies), where the mRNA undergoes deadenylation, decapping, and
degradation by a series of mRNA decay enzymes [9]. The role of TTP in post-transcriptional control was discovered from its ability to directly bind to an ARE present in the mRNA encoding the inflammatory cytokine tumor necrosis factor-a (TNFa), thereby promoting the decay of TNFatranscripts [10]. Indeed, TTP
loss in knockout mice leads to supraphysiological levels of TNFa that, in turn, causes a severe autoimmune disease that manifests as erosive arthritis, dermatitis, cachexia and myeloid hyperplasia [11]. However, the ability of TTP to bind to
TNFamRNA can be suppressed by the p38/MK2 pathway, which phosphorylates
have suggested that reduced levels of TTP may contribute to an array of human diseases where inflammation plays critical roles, including cancer [14].
A variety of tumor types and models have been used to assess the role of TTP in
cancer. In a Myc-driven mouse model of B cell lymphoma, Myc represses TTP
transcription. However, enforcing TTP expression in Myc-expressing B cells doubles the lifespan of these tumor-prone mice and disables maintenance of Myc-driven lymphoma; thus, in this scenario TTP functions as tumor suppressor [2]. Further, TTP loss in cervical cancer leads to stabilization ofE6-APubiquitin ligase mRNA, and E6-AP triggers p53 degradation and the induction of hTERT, overriding senescence [15]. Also, reductions of TTP levels in colon cancer have been shown to lead to increased levels of the inflammatory cytokine COX-2and the pro-angiogenic cytokine VEGF [16,17]. Moreover, low TTP levels correlate with high tumor grade and poor outcome in human breast cancer patients [18]. Finally, genomic analyses have revealed low levels ofTTPin human glioma, head and neck squamous cell carcinoma, melanoma, and prostate cancer [18–21]. However, the targets of TTP that are required for its tumor suppressor functions remain undefined.
Here we applied genomic analyses using four TCGA tumor datasets (breast cancer, lung adenocarcinoma, lung squamous cell carcinoma, and colon adenocarcinoma) [22–24] to define the mRNA expression signature associated with reduced TTP levels in human malignancies. These analyses identified a shared signature, comprised of 50 genes, which are differentially expressed in high-TTP versus low-TTP expressing tumors. Notably, clinical data associated with these datasets establish that in some tumor types reducedTTPexpression is a poor prognostic indicator that is associated with more aggressive and necrotic tumors. Unexpectedly, these analyses revealed that CREB target genes represent a significant proportion of the TTP-low tumor gene signature, suggesting that manipulating activity of the CREB pathway is a potential treatment option for patients with low TTP expressing tumors.
Materials and Methods
The Cancer Genome Atlas (TCGA) Data Retrieval
Breast cancer, lung adenocarcinoma, lung squamous cell carcinoma, and colon
adenocarcinoma were downloaded from the TCGA portal (http://tcga-data.nci.
Gene expression profiling analysis
RNA-Sequencing (RNA-Seq) by Expectation-Maximization (RSEM) normalized count was used to analyze gene-level or isoform level transcription estimates for the RNASeqV2 data from each TCGA dataset. For each cancer dataset, log2 normalized counts were imported into GeneSpring GX V12.1 (Agilent Technologies). Baseline transformation was set as the median for all samples. Upper and lower quartile groups (TTP-high andTTP-low) were defined based on
TTP (ZFP36) expression within each dataset. Out of 20,475 genes in each RNA-Seq dataset, only genes that expressed higher than median in at least one sample were filtered for downstream analysis.
The GeneSpring Volcano Plot function was used to identify differentially
expressed genes (DEGs) between the TTP-high andTTP-low groups for each
TCGA dataset. Statistical test parameters were as follows: selected test, unpairedt -test; p-value computation, Asymptotic; multiple testing correction, Benjamini-Hichberg. Corrected p-value cut-off was set to 0.05 and fold change cut-off was set to 2.
The GeneSpring hierarchical clustering algorithm was used to generate heatmaps. The similarity measure was set to Pearson centered and the linkage rule was set to average. A Venn diagram was created using GeneSpring GX V12.1 software to evaluate which DEGs overlap between all four datasets to identify the
TTP-low tumor gene signature.
Data from GSE32574 was used for gene expression analysis of unstimulated versus LPS-treated macrophages [25]. All genes shown on the heatmap were above the 50th percentile in at least one sample.
Analysis of clinical data
All clinical data analyzed herein are part of open access data generated from patient samples collected by TCGA. The clinical matrix dataset for each cancer type downloaded from the TCGA portal included overall survival or relapse-free survival, tumor subtype, tumor stage and tumor necrosis percentage. The TCGA breast cancer dataset included data for the presence and absence of estrogen receptor (ER), progesterone receptor (PR), and human epidermal growth factor receptor 2 (HER2), along with data for triple negative breast cancers (TNBCs).
TCGA lung adenocarcinoma dataset included mutation data for EGFR, ERBB4,
Identification of tumor sets having similarities to the
TTP
-low
tumor gene signature
The NextBio Research platform (www.nextbio.com; Illumina, Inc.) was used to search thousands of human cancer-related mRNA biosets for significant overlap with theTTP-low tumor gene signature. Tumor sets with at least 10 samples and 25 genes shared with the TTP-low signature list were included in the list of significantly similar tumor datasets (p-value ,0.05). Fisher’s exact test was used to calculate the p-values.
Identification of canonical pathways and upstream regulators of
the
TTP
-low tumor gene signature
Ingenuity Pathway Analysis (IPA) software (Qiagen) was used to identify canonical pathways having significant overlap and upstream transcriptional regulators with significantly enriched targets of the TTP-low tumor gene
signature. Fisher’s exact test was used for assessing significance (p–value ,0.05).
Results
Identification of a
TTP
-low tumor gene signature using The
Cancer Genome Atlas
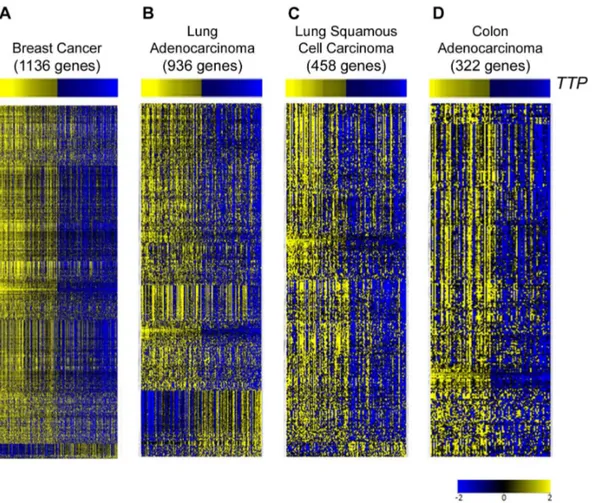
RNA Sequencing (RNA-Seq) data from TCGA breast cancer, lung adenocarci-noma, lung squamous cell carciadenocarci-noma, and colon adenocarcinoma datasets [22-24] was analyzed, and each tumor type was divided into quartiles based on TTP
expression levels (S1,S2, S3, S4 Tables). TheTTP-high (top quartile) andTTP -low (bottom quartile) groups for each tumor were then analyzed for differentially expressed genes. These analyses revealed that the expression of hundreds of genes is altered in each tumor type between TTP-high andTTP-low tumors (Fig. 1;S5,
S6, S7, S8 Tables).
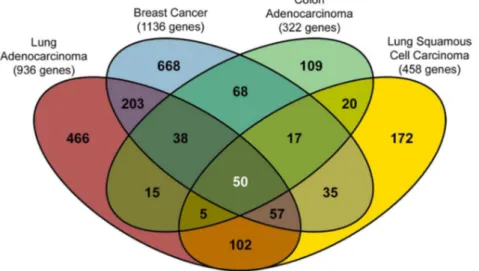
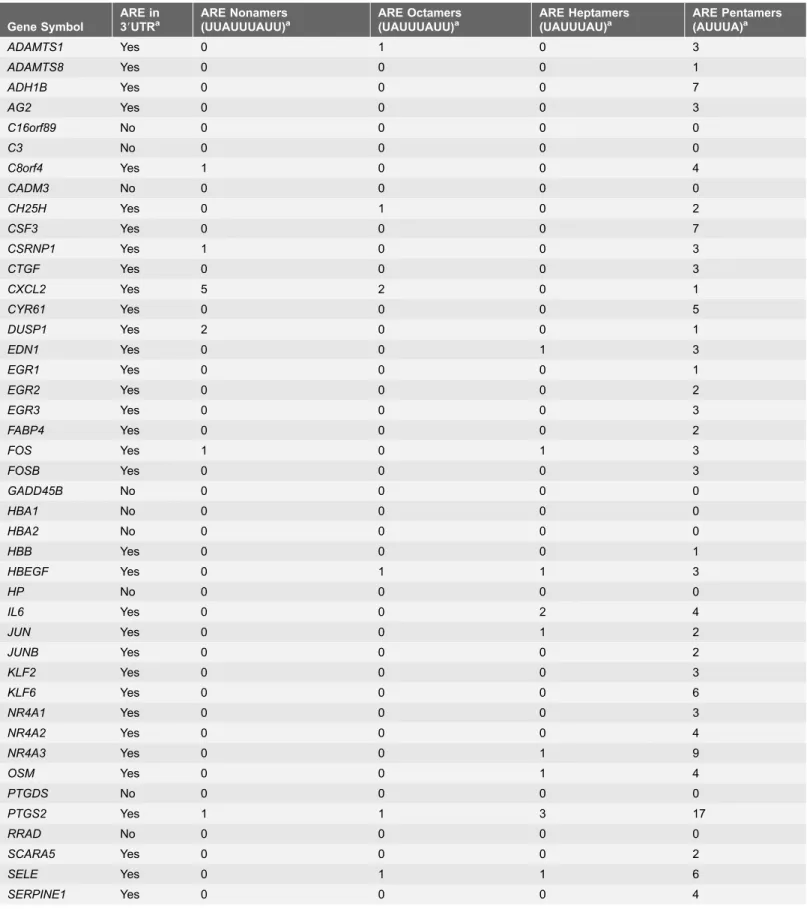
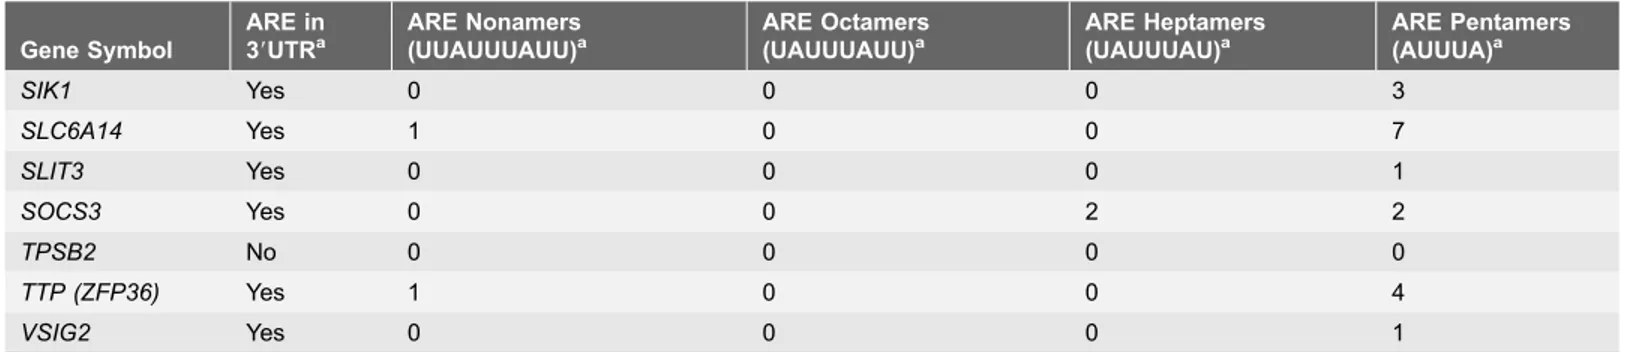
To identify genes whose expression is changed in all four tumor datasets, the sets of differentially expressed genes were compared, and a set of 50 genes was identified – the TTP-low tumor gene signature (Fig. 2;Table 1). As predicted, a large fraction (80%, 40 out of 50 genes) of the mRNAs in theTTP-low tumor gene
signature have AREs in their 39UTRs, including UUAUUUAUU nonamers,
UAUUUAUU octamers and AUUUA pentamers that have been shown to be bound by TTP in global analyses (Table 1) [8]. Interestingly, though the role of TTP as an mRNA destabilizing AUBP predicted that TTP-target genes would be increased in the TTP-low cohort, the expression of all 50 of these signature genes
is markedly reduced in TTP-low tumors compared to TTP-high tumors in the
TCGA breast cancer, lung adenocarcinoma, lung squamous cell carcinoma and colon adenocarcinoma datasets (Table 2). Thus, other regulatory factors in these malignancies may be involved in controlling the expression of genes of the
TTP-low tumor gene signature, and it is possible that such factors are common to all
Low
TTP
expression is a poor prognostic indicator in breast
cancer and lung adenocarcinoma
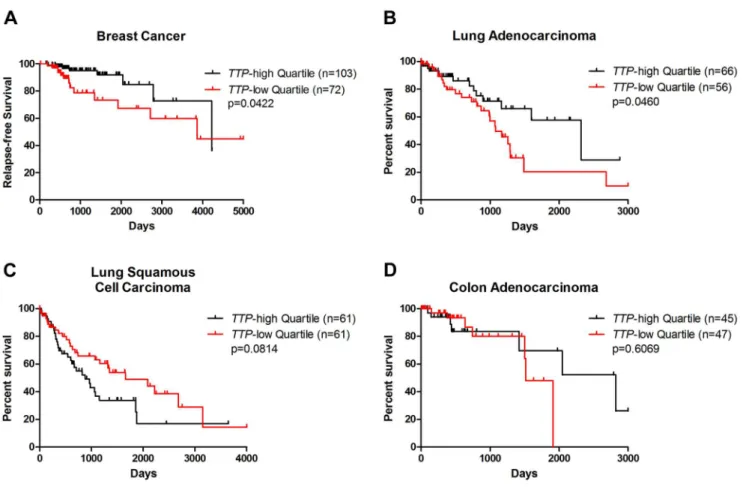
To determine the association of lowTTPexpression with patient outcome in these cancers, available TCGA survival data were analyzed between the TTP-high and
TTP-low tumor sets. For the TCGA breast cancer clinical dataset, only a few overall survival events are currently available [22]. However, relapse-free survival data is available, and analysis of this data shows that breast cancer patients with low levels of TTP expression have a higher incidence of relapse than their TTP -high counterparts (Fig. 3A). This confirms previous findings suggesting that low
TTP expression is a poor prognostic indicator in breast cancer [18].
TCGA data was also used to compare overall survival rates betweenTTP-high andTTP-low patients for the three other cancer types. For lung adenocarcinoma, patients with low levels ofTTPexpression have decreased survival rates compared to TTP-high cohorts (Fig. 3B). However, there were no significant differences in Fig. 1. Differentially expressed genes between tumors in TCGA datasets with high and low expression ofTTP.Gene expression profiling showing differentially expressed genes betweenTTP-high andTTP-low expressing tumors in TCGA breast cancer (A), lung adenocarcinoma (B), lung squamous cell carcinoma (C), and colon adenocarcinoma (D) databases. Information regarding the tumor samples in theTTP-high andTTP-low cohorts and the differentially expressed genes for each tumor type is presented inS1,S2,S3,S4,S5,S6,S7,S8 Tables. All genes shown are hierarchically clustered, have.2.0-fold change, and are significantly altered by unpairedt-test analysis (corrected p-value,0.05).
survival rates of TTP-low versus TTP-high cohorts in lung squamous cell carcinoma or colon adenocarcinoma patients (Figs. 3C and D). Thus, in some (e.g., breast cancer and lung adenocarcinoma), but not all, cancer types patients
with tumors having decreased levels of TTP have a worse outcome.
Genomic analysis of human cancer datasets using NextBio Research software identified another 260 datasets, which compared either cancer tissue to normal tissue, cancer adjacent tissue to normal tissue, or differential tumor populations, as having significant similarities to theTTP-low tumor gene signature (S9 Table). In addition to breast, lung, and colon cancers, other malignancies having
similarities to theTTP-low tumor gene signature include uterine, pancreatic, liver, bladder and prostate cancers (Table 3). Thus, TTP might be an important diagnostic biomarker for predicting patient outcome in a broad spectrum of human tumor types.
Biomarkers in
TTP
-low breast cancer and lung adenocarcinoma
Specific proteins and/or genes are clinically proven diagnostic markers for classifying tumor subtypes, predicting patient outcomes, and developing treatment plans. For example, breast tumors are commonly assessed for three receptors that are used as pathological biomarkers: the presence or absence of estrogen receptor (ER) and progesterone receptor (PR), and the enrichment of human epidermal growth factor receptor 2 (HER2 or ERBB2) [26,27]. In the TCGA breast cancer dataset,TTP-low tumors are twice as likely to be ER-negative (ER-) or PR-negative (PR-) versus TTP-high tumors, indicating that hormone therapies commonly used to block estrogen activity might be less effective at Fig. 2. Identification of theTTP-low tumor gene signature.Venn diagram showing the overlap of differentially expressed genes betweenTTP-high andTTP-low expressing tumors. The center of the diagram indicates that there are 50 genes shared by all four cancer datasets that make up theTTP-low tumor gene signature. These 50 genes are listed inTable 1, and their fold change in each tumor dataset is listed in Table 2.
Table 1.AREs located in genes in theTTP-low tumor gene signature.
Gene Symbol
ARE in 39UTRa
ARE Nonamers (UUAUUUAUU)a
ARE Octamers (UAUUUAUU)a
ARE Heptamers (UAUUUAU)a
ARE Pentamers (AUUUA)a
ADAMTS1 Yes 0 1 0 3
ADAMTS8 Yes 0 0 0 1
ADH1B Yes 0 0 0 7
AG2 Yes 0 0 0 3
C16orf89 No 0 0 0 0
C3 No 0 0 0 0
C8orf4 Yes 1 0 0 4
CADM3 No 0 0 0 0
CH25H Yes 0 1 0 2
CSF3 Yes 0 0 0 7
CSRNP1 Yes 1 0 0 3
CTGF Yes 0 0 0 3
CXCL2 Yes 5 2 0 1
CYR61 Yes 0 0 0 5
DUSP1 Yes 2 0 0 1
EDN1 Yes 0 0 1 3
EGR1 Yes 0 0 0 1
EGR2 Yes 0 0 0 2
EGR3 Yes 0 0 0 3
FABP4 Yes 0 0 0 2
FOS Yes 1 0 1 3
FOSB Yes 0 0 0 3
GADD45B No 0 0 0 0
HBA1 No 0 0 0 0
HBA2 No 0 0 0 0
HBB Yes 0 0 0 1
HBEGF Yes 0 1 1 3
HP No 0 0 0 0
IL6 Yes 0 0 2 4
JUN Yes 0 0 1 2
JUNB Yes 0 0 0 2
KLF2 Yes 0 0 0 3
KLF6 Yes 0 0 0 6
NR4A1 Yes 0 0 0 3
NR4A2 Yes 0 0 0 4
NR4A3 Yes 0 0 1 9
OSM Yes 0 0 1 4
PTGDS No 0 0 0 0
PTGS2 Yes 1 1 3 17
RRAD No 0 0 0 0
SCARA5 Yes 0 0 0 2
SELE Yes 0 1 1 6
impairing the growth of breast tumors with low TTPexpression (Fig. 4A). Conversely, twice as many TTP-low breast cancers are HER2-positive (HER2+) compared to the TTP-high cohort, indicating that such patients might have an improved response to trastuzumab (Herceptin), which targets HER2 [28]. Further, TTP-low breast cancers have approximately two times more triple-negative breast cancers (TNBCs) thanTTP-high tumors. TNBCs lack the presence of all three receptors, and have limited treatment options and poor overall outcome [29].
Expression profiling has identified three molecular subtypes of lung
adenocarcinoma, bronchioid, magnoid, and squamoid [30].EGFRmutations are
more frequent in bronchioid tumors, whereasTP53, KRAS, and STK11(the gene encoding the tumor suppressor LKB1) mutations are more frequent in magnoid tumors [31]. TCGA clinical data was analyzed for mutations of these genes in
TTP-high versusTTP-low lung adenocarcinomas (except forTP53, which was not included in this dataset [24]). No difference was found for the mutation frequency
of EGFR between the two TTP groups (data not shown). However, the EGFR
family member ERBB4 is less commonly mutated in TTP-low than TTP-high
tumors (Fig. 4B). Similarly,KRASand STK11mutations are less frequent in low
TTP-expressing lung adenocarcinomas than in the highTTP-expressing cohort. Thus, even though the prognosis of patients having TTP-low expressing lung adenocarcinomas is worse (Fig. 3B), the classifying mutations of this malignancy are much less frequent in this cohort, suggesting that other alterations, or perhaps reductions in TTP alone, are drivers of these tumors.
Low levels of
TTP
correlate with more aggressive subtypes of
breast cancer, lung adenocarcinoma and lung squamous cell
carcinoma
Breast cancer is divided into four molecular subtypes, luminal A, luminal B, HER2, and basal-like, based on the expression of ER, PR, and HER2 [26,27]. Luminal A and luminal B are ER-positive (ER+) subtypes, and, in general, luminal B breast tumors are more aggressive and these patients have a worse prognosis Table 1.Cont.
Gene Symbol
ARE in 39UTRa
ARE Nonamers (UUAUUUAUU)a
ARE Octamers (UAUUUAUU)a
ARE Heptamers (UAUUUAU)a
ARE Pentamers (AUUUA)a
SIK1 Yes 0 0 0 3
SLC6A14 Yes 1 0 0 7
SLIT3 Yes 0 0 0 1
SOCS3 Yes 0 0 2 2
TPSB2 No 0 0 0 0
TTP (ZFP36) Yes 1 0 0 4
VSIG2 Yes 0 0 0 1
a
Annontated by AREsite 1.0 (http://rna.tbi.univie.ac.at/cgi-bin/AREsite.cgi) [46].
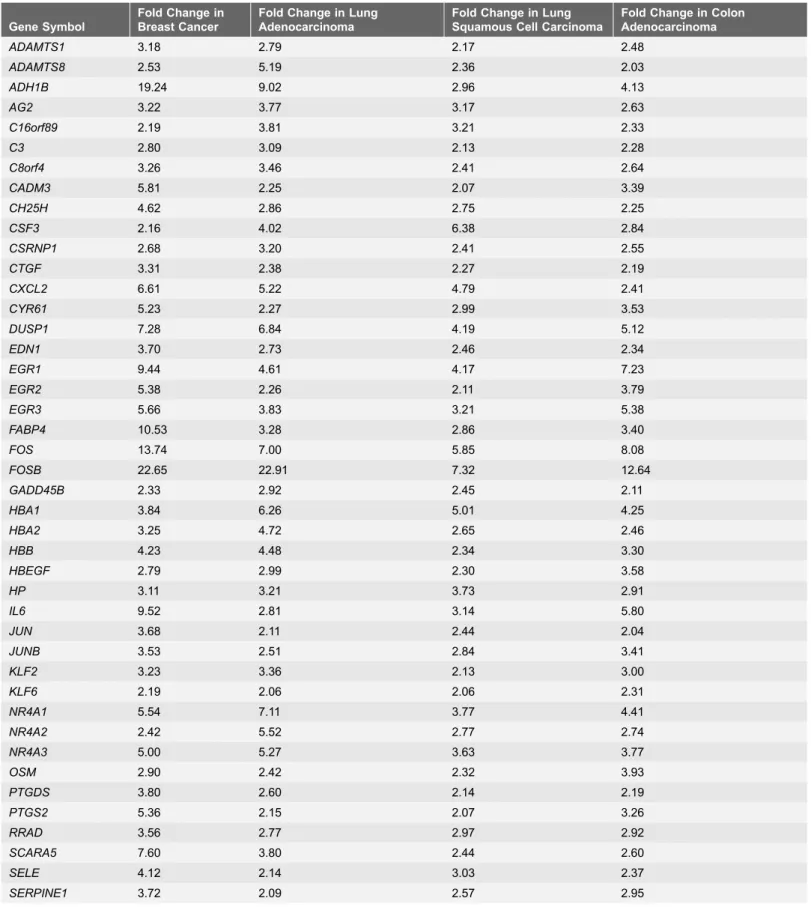
Table 2.Fold change in gene expression between high and lowTTP-expressing tumors in TCGA datasets.
Gene Symbol
Fold Change in Breast Cancer
Fold Change in Lung Adenocarcinoma
Fold Change in Lung Squamous Cell Carcinoma
Fold Change in Colon Adenocarcinoma
ADAMTS1 3.18 2.79 2.17 2.48
ADAMTS8 2.53 5.19 2.36 2.03
ADH1B 19.24 9.02 2.96 4.13
AG2 3.22 3.77 3.17 2.63
C16orf89 2.19 3.81 3.21 2.33
C3 2.80 3.09 2.13 2.28
C8orf4 3.26 3.46 2.41 2.64
CADM3 5.81 2.25 2.07 3.39
CH25H 4.62 2.86 2.75 2.25
CSF3 2.16 4.02 6.38 2.84
CSRNP1 2.68 3.20 2.41 2.55
CTGF 3.31 2.38 2.27 2.19
CXCL2 6.61 5.22 4.79 2.41
CYR61 5.23 2.27 2.99 3.53
DUSP1 7.28 6.84 4.19 5.12
EDN1 3.70 2.73 2.46 2.34
EGR1 9.44 4.61 4.17 7.23
EGR2 5.38 2.26 2.11 3.79
EGR3 5.66 3.83 3.21 5.38
FABP4 10.53 3.28 2.86 3.40
FOS 13.74 7.00 5.85 8.08
FOSB 22.65 22.91 7.32 12.64
GADD45B 2.33 2.92 2.45 2.11
HBA1 3.84 6.26 5.01 4.25
HBA2 3.25 4.72 2.65 2.46
HBB 4.23 4.48 2.34 3.30
HBEGF 2.79 2.99 2.30 3.58
HP 3.11 3.21 3.73 2.91
IL6 9.52 2.81 3.14 5.80
JUN 3.68 2.11 2.44 2.04
JUNB 3.53 2.51 2.84 3.41
KLF2 3.23 3.36 2.13 3.00
KLF6 2.19 2.06 2.06 2.31
NR4A1 5.54 7.11 3.77 4.41
NR4A2 2.42 5.52 2.77 2.74
NR4A3 5.00 5.27 3.63 3.77
OSM 2.90 2.42 2.32 3.93
PTGDS 3.80 2.60 2.14 2.19
PTGS2 5.36 2.15 2.07 3.26
RRAD 3.56 2.77 2.97 2.92
SCARA5 7.60 3.80 2.44 2.60
SELE 4.12 2.14 3.03 2.37
versus patients with luminal A tumors [27]. The HER2 and basal-like subtypes are both ER-negative forms of breast cancer [26]. Further most, but not all, basal-like breast cancers are also TNBCs [32]. The TCGA breast cancer database includes tumors from all four subtypes, and the percentage of each in the TTP-high and Table 2.Cont.
Gene Symbol
Fold Change in Breast Cancer
Fold Change in Lung Adenocarcinoma
Fold Change in Lung Squamous Cell Carcinoma
Fold Change in Colon Adenocarcinoma
SIK1 2.48 3.30 2.33 2.44
SLC6A14 2.47 3.88 3.29 2.86
SLIT3 2.24 3.00 2.45 2.32
SOCS3 3.41 2.63 2.38 3.27
TPSB2 3.00 2.54 2.26 2.28
VSIG2 3.24 4.19 2.48 4.48
TTP (ZFP36) 8.07 7.32 5.69 4.98
doi:10.1371/journal.pone.0115517.t002
Fig. 3. Low expression ofTTPconnotes poor outcome for breast cancer and lung adenocarcinoma patients.Relapse-free survival data from TCGA breast cancer (A) and overall survival data from TCGA lung adenocarcinoma (B), lung squamous cell carcinoma (C), and colon adenocarcinoma (D) was used to generate Kaplan-Meier survival curves ofTTP-high versusTTP-low patients in each dataset. The p-values were determined by the Mantel-Cox log-rank test.
Table 3.Top 20 other human cancers with similarities to theTTP-low tumor gene signature.
Bioset
Number of genes
shareda p-Value
Normal gastric tissue tumor adjacent _vs_ normal gastric tissue from healthy individuals 27 1.80E-42 Uterine leiomyomata neoplasm fibroid without 7q deletion _vs_ normal myometrium 37 1.30E-37
Uterine leiomyoma samples _vs_ adjacent normal myometrium 37 4.60E-37
Uterine leiomyomata neoplasm fibroid with 7q deletion _vs_ normal myometrium 31 4.60E-35 Human uterine leiomyomata fibroid _vs_ adjacent normal myometrium_GPL1355 37 8.40E-35 Pancreatic cancer sample _vs_ non-malignant adjacent pancreatic tissue 32 1.20E-33 Uterine cervix - low grade squamous intraepithelial lesions _vs_ normal tissue_GPL571 27 5.70E-32
Adult germ cell carcinoma - Teratoma _vs_ normal testis 46 1.50E-30
Differentiated hepatocellular carcinoma Grade I-II _vs_ normal liver 29 2.30E-30 Soft-tissue samples of all sarcoma patients _vs_ healthy adipose controls 37 1.90E-26 Bladder urothelial cell carcinoma samples _vs_ non-cancerous samples 38 2.30E-26
Human adrenocortical adenoma _vs_ normal adrenal cortex 33 1.30E-25
Adrenal cortex - adrenocortical adenoma _vs_ normal tissue 33 1.30E-25 Prostate Cancer Pathological Gleason Score 8-10 _vs_ Gleason Score 5-6 28 3.00E-25 Soft-tissue samples of malignant fibrous histiocytoma patients _vs_ healthy adipose controls 38 2.10E-24 Soft-tissue samples of MFH-myxofibrosarcoma patients _vs_ healthy adipose controls 35 3.30E-24
Human adrenocortical carcinoma _vs_ normal adrenal cortex 36 1.90E-23
Adrenal cortex - adrenocortical carcinoma _vs_ normal tissue 36 1.90E-23 Soft-tissue samples of leiomyosarcoma patients _vs_ healthy adipose controls 39 3.10E-23 Thyroid tumors _vs_ adjacent matched normal thyroid biopsies 29 3.30E-23
aMinimum 25 genes shared between the bioset and theTTP-low tumor gene signature.
doi:10.1371/journal.pone.0115517.t003
Fig. 4. Differences in breast cancer biomarkers and lung adenocarcinoma mutations based onTTPexpression levels.(A) Percentages of estrogen receptor-negative (ER-), progesterone receptor-negative (PR-), human epidermal growth factor receptor 2-enriched-positive (HER2+), and triple negative breast cancer (TNBC) patients in theTTP-high andTTP-low TCGA breast cancer sets. (B) Percentages ofERBB4,KRAS, andSTK11mutations inTTP -high andTTP-low TCGA lung adenocarcinoma patients.
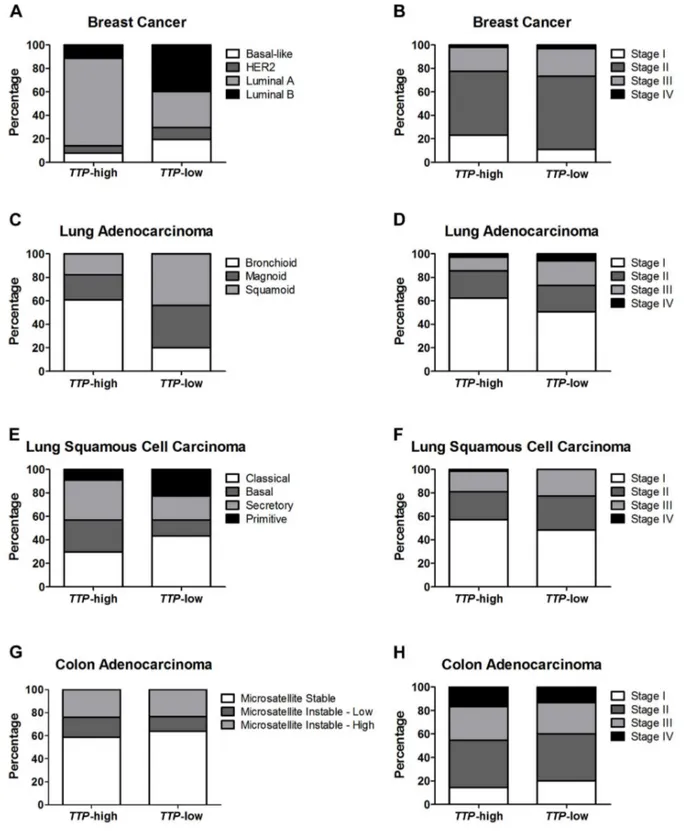
Fig. 5. LowTTPexpression correlates with more aggressive tumor subtypes and advanced tumor stage.Percentages of tumor expression subtypes (left column) and tumor stage (right column) are shown for patients in theTTP-high andTTP-low groups for TCGA breast cancer (A and B), lung adenocarcinoma (C and D), lung squamous cell carcinoma (E and F), and colon adenocarcinoma (G and H) datasets.
TTP-low quartiles was calculated (Fig. 5A). Comparing these subtypes between the two groups, only luminal A, the subtype with the best prognosis, has a higher percentage inTTP-high (71%) thanTTP-low tumors (30%). In contrast, inTTP -low breast tumors, the percentage of luminal B (40%) and basal-like (19%) subtypes is much higher than in theTTP-high cohort (11% and 7%, respectively). Finally, patients in theTTP-low group present more with Stage II (62%) and less
with Stage I tumors (11%) compared to the TTP-high patients (55% and 23%,
respectively) (Fig. 5B). Thus, low expression of TTP in breast cancer correlates with more aggressive tumor types.
Bronchioid lung adenocarcinoma has the most favorable patient outcome of the three lung adenocarcinoma subtypes [30,31]. Notably, over 60% of the patients having high levels of TTP expressed in their tumors were of the bronchioid subtype, while only 20% of TTP-low patients have this favorable subtype (Fig. 5C). In contrast, magnoid and squamoid tumors, which have similar overall survival rates, are much more prevalent in TTP-low lung
adenocarcinoma patients (36% and 44%, respectively) than their TTP-high
counterparts (21% and 18%). This is particularly noteworthy for squamoid lung adenocarcinoma, as analyses of this subtype have yet to identify any characteristic genomic alterations [31]. Finally, nearly twice as many TTP-low lung
adenocarcinoma patients have Stage III or Stage IV tumors (27% combined) than
TTP-high patients (14% combined) (Fig. 5D). Therefore, like in breast cancer, lung adenocarcinomas with low expression of the tumor suppressor geneTTPare much more likely to have more aggressive and advanced tumors.
There are four expression subtypes of lung squamous cell carcinoma, primitive, classical, secretory, and basal [33]. The classical, secretory, and basal subtypes have similar patient outcomes, and the classical form accounts for the largest
percentage of the TTP-low group (43%) versus theTTP-high cohort (30%)
(Fig. 5E). In contrast, secretory or basal lung squamous cell carcinomas were more likely to have high levels of TTP (27% and 34%, respectively) than tumors with lowTTP(14% and 20%, respectively). Importantly, the primitive subtype of lung squamous cell carcinoma are poorly differentiated and have the worse prognosis [33], and patients with lowTTPexpression have this detrimental form more often (23%) than individuals with high TTPexpression (9%). Finally, lung squamous cell carcinoma patients with lowTTPlevels have a higher percentage of
Stage II, III and IV tumors (52% combined) than TTP-high patients (43%
combined) (Fig. 5F). Thus, although there are no differences in overall survival betweenTTP-high andTTP-low lung squamous cell carcinoma patients, there are differences in clinical phenotypes that suggest that reduced TTP expression may contribute to the aggressiveness of these tumors.
Colon adenocarcinomas are comprised of two biological subtypes, the
microsatellite instability group, which have high levels of hypermethylation, and the microsatellite stable group, which lack hypermethylation but are chromoso-mally unstable [23]. There was no difference in the occurrence of these
phenotypes between the TTP-high and TTP-low cohorts in the TCGA colon
high and lowTTP expression were similar (Fig. 5H). Thus, TTP expression does not correlate with colon adenocarcinoma subtypes.
TTP
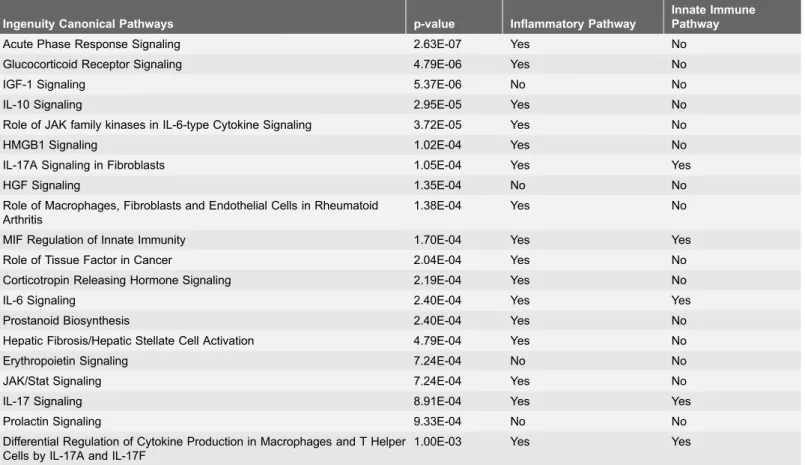
-low tumor signature genes affect inflammatory pathways
To identify mechanistic pathways that might be altered in TTP-low tumors, Ingenuity Pathway Analysis (IPA) software was applied to the gene signature. This revealed that 16 of the top 20 pathways affected by TTP expression levels are inflammatory pathways (Table 4,S10 Table) in accord with data showing that decreased levels of TTP result in increased inflammation [11,14]. Further,TTP
expression is induced by ligands that trigger the innate immune response [10], and five of the inflammatory pathways affected by this gene signature are also innate immunity pathways. Lipopolysaccharide (LPS) is well-established as an inducer of innate immunity, and gene expression profiling of macrophages
stimulated by LPS compared to unstimulated macrophages [25] found that
several genes in theTTP-low tumor signature are altered during activation of the
innate immune pathway in a fashion similar to cancer based on TTP expression
(S1 Fig.). Finally, 14 of the genes in the TTP-low tumor gene signature are classified as innate immune genes by the InnateDB database (www.innatedb.com) [34]. This suggests that TTP is specifically involved in controlling inflammation that is directed by the innate immune response.
The presence of necrosis within tumors is linked with aggressive disease and increased inflammation [35,36]. Indeed, histological examination of tumor samples in the TCGA datasets revealed that TTP-low breast cancers and lung
adenocarcinomas have significantly more tumor necrosis than TTP-high tumors
(Fig. 6). In contrast, no differences in tumor necrosis were found in lung squamous cell carcinoma and colon adenocarcinoma. Collectively, these data suggest that TTP plays a critical role in regulating tumor inflammation in at least in some malignancies.
CREB target genes are a core component of the
TTP
-low tumor
gene signature
Table 4.Top 20 canonical pathways significantly altered by theTTP-low tumor gene signature.
Ingenuity Canonical Pathways p-value Inflammatory Pathway
Innate Immune Pathway
Acute Phase Response Signaling 2.63E-07 Yes No
Glucocorticoid Receptor Signaling 4.79E-06 Yes No
IGF-1 Signaling 5.37E-06 No No
IL-10 Signaling 2.95E-05 Yes No
Role of JAK family kinases in IL-6-type Cytokine Signaling 3.72E-05 Yes No
HMGB1 Signaling 1.02E-04 Yes No
IL-17A Signaling in Fibroblasts 1.05E-04 Yes Yes
HGF Signaling 1.35E-04 No No
Role of Macrophages, Fibroblasts and Endothelial Cells in Rheumatoid Arthritis
1.38E-04 Yes No
MIF Regulation of Innate Immunity 1.70E-04 Yes Yes
Role of Tissue Factor in Cancer 2.04E-04 Yes No
Corticotropin Releasing Hormone Signaling 2.19E-04 Yes No
IL-6 Signaling 2.40E-04 Yes Yes
Prostanoid Biosynthesis 2.40E-04 Yes No
Hepatic Fibrosis/Hepatic Stellate Cell Activation 4.79E-04 Yes No
Erythropoietin Signaling 7.24E-04 No No
JAK/Stat Signaling 7.24E-04 Yes No
IL-17 Signaling 8.91E-04 Yes Yes
Prolactin Signaling 9.33E-04 No No
Differential Regulation of Cytokine Production in Macrophages and T Helper Cells by IL-17A and IL-17F
1.00E-03 Yes Yes
doi:10.1371/journal.pone.0115517.t004
Fig. 6. LowTTPlevels correlate with increased tumor necrosis in breast cancer and lung
adenocarcinoma.Average percentages of tumor necrosis inTTP-high andTTP-low tumors in TCGA breast cancer, lung adenocarcinoma, lung squamous cell carcinoma, and colon adenocarcinoma datasets. The p-values were determined by Student’st-test (*p,0.05, *** p,0.001).
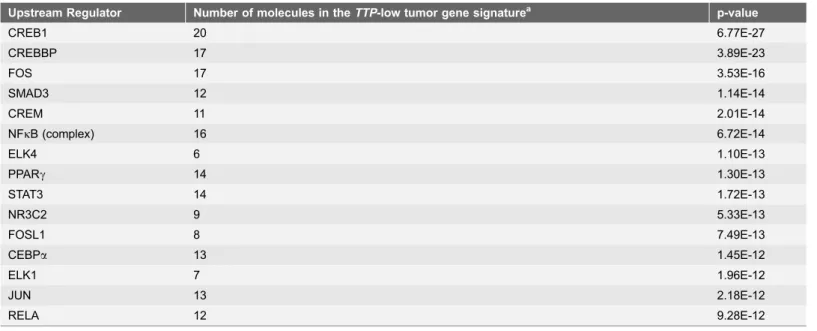
adenocarcinoma. Interestingly, ATF3 expression is induced by innate signaling and functions to harness this response [25,37]. In scenarios where there is chronic stimulation of innate immune signaling, such as that provoked by high levels of necrosis, one would predict innate immune tolerance [38] resulting in reductions Table 5.Top 10 upstream regulators of theTTP-low tumor gene signature.
Upstream Regulator Number of molecules in theTTP-low tumor gene signaturea p-value
CREB1 20 6.77E-27
CREBBP 17 3.89E-23
FOS 17 3.53E-16
SMAD3 12 1.14E-14
CREM 11 2.01E-14
NFkB (complex) 16 6.72E-14
ELK4 6 1.10E-13
PPARc 14 1.30E-13
STAT3 14 1.72E-13
NR3C2 9 5.33E-13
FOSL1 8 7.49E-13
CEBPa 13 1.45E-12
ELK1 7 1.96E-12
JUN 13 2.18E-12
RELA 12 9.28E-12
a
Minimum 3 genes in theTTP-low tumor gene signature must be targets of the upstream regulator.
doi:10.1371/journal.pone.0115517.t005
Fig. 7. CREB-target genes are a core component of theTTP-low tumor gene signature.Diagram of the 20 CREB-target genes found by Ingenuity Pathway Analysis in theTTP-low tumor gene signature.
ofATF3expression, which is precisely what is observed in the necrosis-associated
TTP-low gene expression signature.
Some splice variants of CREB family members function as dominant negative repressors of CREB activity [39,40]. Thus, we assessed if the repression of CREB target genes in the TTP-low tumor gene signature was associated with alterations in the levels of the well-characterized cAMP Response Element Modulator (CREM) variant known as Inducible cAMP Early Repressor (ICER). ICER contains a basic leucine zipper (bZIP) domain that directs binding to CRE sites but lacks the N-terminal domain that binds to regulatory cofactors necessary for CREB transcriptional activity (Fig. 8B). ICER expression significantly correlated with TTP in all four cancer datasets; thus, it is unlikely to impair the
transcriptional activity of CREB family members inTTP-low tumors (Fig. 8C;S3 Fig.). However, the expression ofCREM transcript variant 2, which harbors theN -terminal domain of CREM but lacks the bZIP domain (CREMDZIP) and is predicted to compete with CREB family members for necessary transcriptional cofactors (Fig. 8B), was significantly increased in breast cancer, lung adenocar-cinoma, and lung squamous cell carcinoma having lowTTPexpression (Fig. 8C). Therefore, CREMDZIP may impair the transcriptional activity of CREB family
members in some TTP-low cancers and lead to the repression of CREB target
genes in these tumors.
Fig. 8. Expression of CREB family members in breast cancer and lung adenocarcinoma based onTTP
levels.Gene expression profiling showing the expression levels of canonicalCREBfamily members (A), and comparing the expression levels ofCREMversus its dominant negative splice variantsICERandCREMDZIP
(C) inTTP-high andTTP-low expressing TCGA breast cancers and lung adenocarcinomas. (B) Cartoon showing the canonical CREM protein and its dominant negative splice variants ICER and CREMDZIP.
Discussion
The identification of the TTP-low tumor gene signature in the TCGA breast cancer, lung adenocarcinoma, lung squamous cell carcinoma and colon
adenocarcinoma datasets provides new avenues for investigating the functions of TTP as a tumor suppressor across a broad spectrum of human malignancies. In some scenarios, such as breast cancer and lung adenocarcinoma, reduced levels of
TTP are associated with worse patient outcome, more aggressive tumor stage and subtypes, and increased tumor necrosis. In addition, the expression of genes in the
TTP-low tumor gene signature is altered in a similar fashion in hundreds of other human tumor datasets, including uterine, pancreatic, bladder, liver, and prostate cancers. For most of these tumor types little is known regarding potential roles of TTP, and in the case of pancreatic and bladder cancer this is the first time any connection to TTP has been described. Therefore, TTP should be thoroughly explored across an array of human cancers, especially in more aggressive subtypes and/or in tumors having high levels of tumor necrosis, to determine if low TTP
expression levels are a prognostic indicator.
The analyses herein show that theTTP-low tumor gene signature is involved in inflammatory pathways, particularly innate immunity, and the increased necrosis in tumors classified as TTP-low supports this notion. Necrotic cells release endogenous ligands called damage-associated molecular patterns (DAMPs), which bind to and activate Toll-like receptors (TLRs) to induce the innate immune response [41]. Initial activation of TLRs triggers an inflammatory cytokine response, including the induction of TNFa, yet TTP is also induced by
TLRs to harness the expression of these cytokines and control inflammation [10,42]. However, subsequent activation of TLRs results in an impaired innate inflammatory response known as tolerance [38]. Thus, inTTP-low tumors with high levels of necrosis, it is likely that increased levels of DAMPs are present, which cause chronic stimulation of TLRs that leads to a tolerant state of the innate immune pathway and immune suppression. Further studies will determine if decreased levels ofTTPcause the increased levels of necrosis, or if rather decreases in TTP levels reflect tolerance of the innate immune response.
Gene cluster analysis of kinetic profiles following LPS treatment of macro-phages revealed that TTP andATF3 are coordinately and rapidly induced in response to TLR4-activated innate immunity [25]. Other genes similarly regulated include DUSP1,EGR1, EGR2, JUN, and NR4A1 [25], which are components of theTTP-low tumor gene signature, again linkingTTPlevels and innate immunity. Similar to TTP function in controlling innate immunity, ATF3 transcriptionally represses the expression of cytokines, such as IL-6 andIL-12b, to function as a negative feedback regulator of innate immune-driven inflammation [25]. This suggests that TTP and ATF3 together harness TLR-mediated inflammation, and future studies should include tests of their functional relationship and how this relates to tumor development and progression.
regulator, for example p38 mitogen-activated protein kinase (MAPK). In LPS-treated macrophages, p38 activates its downstream kinase MK2, which stabilizes
TTP mRNA and directly phosphorylates TTP protein regulating its subcellular localization and stability [13,43]. Also p38 activates the mitogen- and stress-activated protein kinases MSK1 and MSK2 that, in turn, induce TTP protein [12]. In addition, MSK1 and MSK2 facilitate the stress-induced phosphorylation of CREB at Ser-133, which induces the transcription of several immediate early genes including c-fos, junB, and egr1[44], which are, notably, part of the low-TTP
tumor gene signature. Therefore, future studies should test if impairing p38
MAPK in tumor cells suppresses both TTP expression and CREB activity. In
addition, given that LKB1 functions in part to prevent CREB target gene
activation [45], the decreased mutation frequency ofSTK11 (LKB1) in TTP-low
lung adenocarcinomas compared to the TTP-high cohort corresponds with the
observed decrease in CREB-target gene expression in TTP-low tumors.
Furthermore, TTP-low tumors express a novel CREB family member,
CREMDZIP, that most likely functions as a dominant negative repressor of CREM by acting in a manner similar to ATF3DZIP, an ATF3 isoform that also lacks the leucine zipper domain. ATF3DZIP is unable to bind to DNA but functions as a dominant negative of ATF3 by competing for co-factors that ATF3 requires to repress transcription [40]. Collectively, these links between reduced TTP
expression and repressed CREB activity in cancer support the idea that therapeutic CREB agonists, for example colforsin, salbutamol, clenbuterol, or isoprenaline, may show benefit as therapeutics for TTP-low expressing tumors, particularly ones where there is a decrease in CREB activity.
Supporting Information
S1 Fig. Genes in the TTP-low tumor gene signature are also regulated by activation of innate immunity by LPS. Gene expression profiling analysis of GSE32574 shows the expression levels of genes in theTTP-low tumor signature in unstimulated macrophages versus LPS-treated macrophages. All genes shown were expressed above the 50th percentile in at least one sample.
doi:10.1371/journal.pone.0115517.s001 (TIF)
S2 Fig. CREB family expression in lung squamous cell carcinoma and colon adenocarcinoma based on TTP levels. Gene expression profiling showing the
expression levels of canonical CREBfamily members in TTP-high and TTP-low
expressing TCGA lung squamous cell carcinomas and colon adenocarcinomas.
doi:10.1371/journal.pone.0115517.s002 (TIF)
S3 Fig. Expression of CREM splice variants in lung squamous cell carcinoma and colon adenocarcinoma based on TTP levels.Gene expression profiling comparing the expression levels of CREMversus its dominant negative splice
variantsICERandCREMDZIP inTTP-high and TTP-low expressing TCGA lung
squamous cell carcinomas and colon adenocarcinomas.
S1 Table. TCGA breast cancer tumors in the TTP-high andTTP-low quartiles.
doi:10.1371/journal.pone.0115517.s004 (XLSX)
S2 Table. TCGA lung adenocarcinomas in the TTP-high and TTP-low quartiles.
doi:10.1371/journal.pone.0115517.s005 (XLSX)
S3 Table. TCGA lung squamous cell carcinomas in theTTP-high andTTP-low quartiles.
doi:10.1371/journal.pone.0115517.s006 (XLSX)
S4 Table. TCGA colon adenocarcinomas in the TTP-high andTTP-low quartiles.
doi:10.1371/journal.pone.0115517.s007 (XLSX)
S5 Table. Differentially expressed genes in TCGA breast cancer dataset between high and low TTP-expressing tumors.
doi:10.1371/journal.pone.0115517.s008 (XLSX)
S6 Table. Differentially expressed genes in TCGA lung adenocarcinoma dataset between high and low TTP-expressing tumors.
doi:10.1371/journal.pone.0115517.s009 (XLSX)
S7 Table. Differentially expressed genes in TCGA lung squamous cell carcinoma dataset between high and low TTP-expressing tumors.
doi:10.1371/journal.pone.0115517.s010 (XLSX)
S8 Table. Differentially expressed genes in TCGA colon adenocarcinoma dataset between high and low TTP-expressing tumors.
doi:10.1371/journal.pone.0115517.s011 (XLSX)
S9 Table. Human cancer datasets with similarities to the TTP-low tumor gene signature.
doi:10.1371/journal.pone.0115517.s012 (XLSX)
S10 Table. Canonical pathways significantly altered by the TTP-low tumor gene signature.
doi:10.1371/journal.pone.0115517.s013 (XLSX)
S11 Table. Upstream regulators of the TTP-low tumor gene signature.
doi:10.1371/journal.pone.0115517.s014 (XLSX)
Acknowledgments
We thank Lindsey Rounbehler of Elephant Trunk Studio for assistance with graphics and figure design for this manuscript.
Author Contributions
References
1. Cancer Genome Atlas Research N(2008) Comprehensive genomic characterization defines human glioblastoma genes and core pathways. Nature 455: 1061–1068.
2. Rounbehler RJ, Fallahi M, Yang C, Steeves MA, Li W, et al.(2012) Tristetraprolin impairs myc-induced lymphoma and abolishes the malignant state. Cell 150: 563–574.
3. Halees AS, El-Badrawi R, Khabar KS(2008) ARED Organism: expansion of ARED reveals AU-rich element cluster variations between human and mouse. Nucleic Acids Res 36: D137–140.
4. Hanahan D, Weinberg RA(2011) Hallmarks of cancer: the next generation. Cell 144: 646–674.
5. Chen CY, Shyu AB(1995) AU-rich elements: characterization and importance in mRNA degradation. Trends Biochem Sci 20: 465–470.
6. Hudson BP, Martinez-Yamout MA, Dyson HJ, Wright PE(2004) Recognition of the mRNA AU-rich element by the zinc finger domain of TIS11d. Nat Struct Mol Biol 11: 257–264.
7. Lai WS, Carrick DM, Blackshear PJ(2005) Influence of nonameric AU-rich tristetraprolin-binding sites on mRNA deadenylation and turnover. J Biol Chem 280: 34365–34377.
8. Mukherjee N, Jacobs NC, Hafner M, Kennington EA, Nusbaum JD, et al.(2014) Global target mRNA specification and regulation by the RNA-binding protein ZFP36. Genome Biol 15: R12.
9. Brooks SA, Blackshear PJ(2013) Tristetraprolin (TTP): interactions with mRNA and proteins, and current thoughts on mechanisms of action. Biochim Biophys Acta 1829: 666–679.
10. Carballo E, Lai WS, Blackshear PJ(1998) Feedback inhibition of macrophage tumor necrosis factor-alpha production by tristetraprolin. Science 281: 1001–1005.
11. Taylor GA, Carballo E, Lee DM, Lai WS, Thompson MJ, et al.(1996) A pathogenetic role for TNF alpha in the syndrome of cachexia, arthritis, and autoimmunity resulting from tristetraprolin (TTP) deficiency. Immunity 4: 445–454.
12. Brook M, Tchen CR, Santalucia T, McIlrath J, Arthur JS, et al.(2006) Posttranslational regulation of tristetraprolin subcellular localization and protein stability by p38 mitogen-activated protein kinase and extracellular signal-regulated kinase pathways. Mol Cell Biol 26: 2408–2418.
13. Mahtani KR, Brook M, Dean JL, Sully G, Saklatvala J, et al.(2001) Mitogen-activated protein kinase p38 controls the expression and posttranslational modification of tristetraprolin, a regulator of tumor necrosis factor alpha mRNA stability. Mol Cell Biol 21: 6461–6469.
14. Sanduja S, Blanco FF, Young LE, Kaza V, Dixon DA(2012) The role of tristetraprolin in cancer and inflammation. Front Biosci (Landmark Ed) 17: 174–188.
15. Sanduja S, Kaza V, Dixon DA(2009) The mRNA decay factor tristetraprolin (TTP) induces senescence in human papillomavirus-transformed cervical cancer cells by targeting E6-AP ubiquitin ligase. Aging (Albany NY) 1: 803–817.
16. Lee HH, Son YJ, Lee WH, Park YW, Chae SW, et al.(2010) Tristetraprolin regulates expression of VEGF and tumorigenesis in human colon cancer. Int J Cancer 126: 1817–1827.
17. Young LE, Sanduja S, Bemis-Standoli K, Pena EA, Price RL, et al. (2009) The mRNA binding proteins HuR and tristetraprolin regulate cyclooxygenase 2 expression during colon carcinogenesis. Gastroenterology 136: 1669–1679.
18. Brennan SE, Kuwano Y, Alkharouf N, Blackshear PJ, Gorospe M, et al. (2009) The mRNA-destabilizing protein tristetraprolin is suppressed in many cancers, altering tumorigenic phenotypes and patient prognosis. Cancer Res 69: 5168–5176.
19. Bourcier C, Griseri P, Grepin R, Bertolotto C, Mazure N, et al. (2011) Constitutive ERK activity induces downregulation of tristetraprolin, a major protein controlling interleukin8/CXCL8 mRNA stability in melanoma cells. Am J Physiol Cell Physiol 301: C609–618.
20. Suswam E, Li Y, Zhang X, Gillespie GY, Li X, et al.(2008) Tristetraprolin down-regulates interleukin-8 and vascular endothelial growth factor in malignant glioma cells. Cancer Res 68: 674–682.
22. Cancer Genome Atlas N(2012) Comprehensive molecular portraits of human breast tumours. Nature 490: 61–70.
23. Cancer Genome Atlas N(2012) Comprehensive molecular characterization of human colon and rectal cancer. Nature 487: 330–337.
24. Cancer Genome Atlas Research N(2012) Comprehensive genomic characterization of squamous cell lung cancers. Nature 489: 519–525.
25. Gilchrist M, Thorsson V, Li B, Rust AG, Korb M, et al.(2006) Systems biology approaches identify ATF3 as a negative regulator of Toll-like receptor 4. Nature 441: 173–178.
26. Perou CM, Sorlie T, Eisen MB, van de Rijn M, Jeffrey SS, et al.(2000) Molecular portraits of human breast tumours. Nature 406: 747–752.
27. Sorlie T, Tibshirani R, Parker J, Hastie T, Marron JS, et al.(2003) Repeated observation of breast tumor subtypes in independent gene expression data sets. Proc Natl Acad Sci U S A 100: 8418–8423.
28. Carter P, Presta L, Gorman CM, Ridgway JB, Henner D, et al. (1992) Humanization of an anti– p185HER2 antibody for human cancer therapy. Proc Natl Acad Sci U S A 89: 4285–4289.
29. Perou CM(2011) Molecular stratification of triple-negative breast cancers. Oncologist 16 Suppl 1: 61– 70.
30. Hayes DN, Monti S, Parmigiani G, Gilks CB, Naoki K, et al.(2006) Gene expression profiling reveals reproducible human lung adenocarcinoma subtypes in multiple independent patient cohorts. J Clin Oncol 24: 5079–5090.
31. Wilkerson MD, Yin X, Walter V, Zhao N, Cabanski CR, et al.(2012) Differential pathogenesis of lung adenocarcinoma subtypes involving sequence mutations, copy number, chromosomal instability, and methylation. PLoS One 7: e36530.
32. Prat A, Perou CM(2011) Deconstructing the molecular portraits of breast cancer. Mol Oncol 5: 5–23.
33. Wilkerson MD, Yin X, Hoadley KA, Liu Y, Hayward MC, et al.(2010) Lung squamous cell carcinoma mRNA expression subtypes are reproducible, clinically important, and correspond to normal cell types. Clin Cancer Res 16: 4864–4875.
34. Lynn DJ, Winsor GL, Chan C, Richard N, Laird MR, et al.(2008) InnateDB: facilitating systems-level analyses of the mammalian innate immune response. Mol Syst Biol 4: 218.
35. Grivennikov SI, Greten FR, Karin M(2010) Immunity, inflammation, and cancer. Cell 140: 883–899.
36. Vakkila J, Lotze MT(2004) Inflammation and necrosis promote tumour growth. Nat Rev Immunol 4: 641–648.
37. Whitmore MM, Iparraguirre A, Kubelka L, Weninger W, Hai T, et al.(2007) Negative regulation of TLR-signaling pathways by activating transcription factor-3. J Immunol 179: 3622–3630.
38. Biswas SK, Lopez-Collazo E(2009) Endotoxin tolerance: new mechanisms, molecules and clinical significance. Trends Immunol 30: 475–487.
39. Molina CA, Foulkes NS, Lalli E, Sassone-Corsi P(1993) Inducibility and negative autoregulation of CREM: an alternative promoter directs the expression of ICER, an early response repressor. Cell 75: 875–886.
40. Chen BP, Liang G, Whelan J, Hai T(1994) ATF3 and ATF3 delta Zip. Transcriptional repression versus activation by alternatively spliced isoforms. J Biol Chem 269: 15819–15826.
41. Newton K, Dixit VM(2012) Signaling in innate immunity and inflammation. Cold Spring Harb Perspect Biol 4.
42. Poltorak A, He X, Smirnova I, Liu MY, Van Huffel C, et al.(1998) Defective LPS signaling in C3H/HeJ and C57BL/10ScCr mice: mutations in Tlr4 gene. Science 282: 2085–2088.
43. Tchen CR, Brook M, Saklatvala J, Clark AR(2004) The stability of tristetraprolin mRNA is regulated by mitogen-activated protein kinase p38 and by tristetraprolin itself. J Biol Chem 279: 32393–32400.
45. Shaw RJ, Lamia KA, Vasquez D, Koo SH, Bardeesy N, et al.(2005) The kinase LKB1 mediates glucose homeostasis in liver and therapeutic effects of metformin. Science 310: 1642–1646.