Transcriptome Analysis of Canola (Brassica
napus) under Salt Stress at the Germination
Stage
Weihua Long, Xiling Zou, Xuekun Zhang*
Key Lab of Biology and Genetic Improvement of Oil Crops, Ministry of Agriculture, Oil Crops Research Institute of Chinese Academy of Agriculture Science, Wuhan 430062, China
Abstract
Canola (Brassica napus) is one of the most important oil crops in the world. However, its yield has been constrained by salt stress. In this study, transcriptome profiles were explored using Digital Gene Expression (DGE) at 0, 3, 12 and 24 hours after H2O (control) and NaCl treatments onB. napusroots at the germination stage. Comparisons of gene-expression between the control and the treatment were conducted after tag-mapping to the sequenced Brassica rapagenome. The differentially expressed genes during the time course of salt stress were focused on, and 163 genes were identified to be differentially expressed at all the time points. Gene Ontology and Kyoto Encyclopedia of Genes and Genomes enrich-ment analyses revealed that some of the genes were involved in proline metabolism, inosi-tol metabolism, carbohydrate metabolic processes and oxidation-reduction processes and may play vital roles in the salt-stress response at the germination stage. Thus, this study provides new candidate salt stress responding genes, which may function in novel putative nodes in the molecular pathways of salt stress resistance.
Introduction
Salinization of agricultural land has been a major problem worldwide for decades. According to Food and Agriculture Organization (FAO land and plant nutrition management service, 2008), 7% of the world’s land has been salinized, and this percentage is still increasing. As one of the major abiotic stresses, salt stress greatly reduces crop productivity. Meanwhile, the worldwide population is predicted to grow to 9 billion by the end of 2050 (www.un.org/popin/ data.html.). Thus, understanding plant-salt interaction mechanisms and breeding salt-tolerant crops will be invaluable to secure the world’s food supply [1–3].
High soil salt level can result in physiological drought and ionic poisoning in plants by de-creasing their water potential and causing the accumulation of excess ions [4]. Plants evolve several mechanisms to cope with salt stress, such as ion homeostasis, osmotic homeostasis, redox equilibrium, growth regulation and others [5]. These mechanisms are all achieved through corresponding physiological and biochemical changes by regulation of numerous salt-a11111
OPEN ACCESS
Citation:Long W, Zou X, Zhang X (2015) Transcriptome Analysis of Canola (Brassica napus) under Salt Stress at the Germination Stage. PLoS ONE 10(2): e0116217. doi:10.1371/journal. pone.0116217
Academic Editor:Girdhar K. Pandey, University of Delhi South Campus, INDIA
Received:July 30, 2014
Accepted:December 5, 2014
Published:February 13, 2015
Copyright:© 2015 Long et al. This is an open access article distributed under the terms of the Creative Commons Attribution License, which permits unrestricted use, distribution, and reproduction in any medium, provided the original author and source are credited.
Data Availability Statement:All relevant data are within the paper and its Supporting Information files.
Funding:Funding provided by the Opening Fund of Key Lab of Biology and Genetic Improvement of Oil Crops of Ministry of Agriculture (2011-1), Hi-Tech Research and Development Program of China (2011AA10A104).
responsive genes. One such group of genes consists of structural protein-coding genes, includ-ing osmoregulatory genes, antioxidant proteins, late embryogenesis abundant (LEA) proteins, and transporters/antiporters. For example, Renet al. (2005) cloned a major quantitative trait locus encoding a high-affinity K+transporter (HKT)-type sodium transporter that recycles the Na+from the shoots to the roots [6]. Another group of salt-response genes includes transcrip-tion factors (TFs), such as ERF and WRKY, and signal-related protein kinases [7]. By combin-ing the interaction mode among the mentioned genes above, several pathways that potentiate the salt-stress signal have been revealed, such as the salt overly sensitive (SOS) pathway [8–9], the calcium-dependent protein kinase (CDPK) pathway [10] and the mitogen-activated pro-tein kinase (MAPK) pathway [11]. Furthermore, plant hormones, such as abscisic acid (ABA), ethylene, salicylic acid, and jasmonic acid, also play important roles in stress signaling and ad-aptation [12–14]. In spite of the progress that has been made in detailing these processes, the integrated mechanisms of salt tolerance in plants require further exploration.
Canola (Brassica napus) is one of the most widely cultivated oil crops in the world because of the healthy fatty acid composition of its oil and high protein content of its meal. Similar to the other crops,B. napusis threatened by salt stress, especially in arid and semi-arid countries (or regions). Its salt tolerance mechanism at the molecular level remains unclear, despite of a few recent reports [15–17].
Next generation sequencing (NGS), with the advantage of its cost-effectiveness and high-throughput characteristics, is the most promising method to explore molecular profiles for non-model crops [18]. And it has been applied successfully to detect transcriptome variation in
B. napusin at least three applications to date. Firstly, genes that are expressed in distinct
spe-cies, organs or conditions have been identified [19–21]. Secondly, single nucleotide polymor-phisms in transcript sequences have been analyzed, which made associative transcriptomics more efficient for delineating regions of the genome that control traits and provide markers [22,23]. Thirdly, conserved and novel microRNA functions in specific organs have been ex-plored [24]. Digital Gene Expression (DGE) profiling, based on an NGS platform, has been ap-plied to gene-expression comparisons of different species, developmental stages and stresses [25].
To date, there has been little transcriptome information in response to salt stress inB.
napus. The root is the first mediation organ exposed to salt stress; therefore, it may have
prima-ry functions in the interaction process. In this study, we applied DGE profiling to root samples at 0-, 3-, 12- and 24-hour time points under control and salt treatments, to explore the tran-scriptome profiles and to identify salt-responsive genes ofB. napusat the germination stage.
Materials and Methods
2.1. Plant material and stress treatment
Healthy seeds ofB. napusline WH126 were surface-sterilized with 5% sodium hypochlorite for 5 min and washed three times with ddH2O. About 700 clean seeds were placed on eight-layer
filter papers supplied with adequate water (dH2O) in petri dishes (diameter = 13 cm) in a
cli-mate chamber (25 ± 1°C, 130μmol/m2s in light and 60–80% in humidity). When young
radi-cles emerged (approximately 1–2 mm in length out of the seed coats), 600 uniform seeds were distributed into six dishes, three of which were treated with dH2O (control) and the others
with 1.25% NaCl solution (salt treatment, abbreviated as ST). The three dishes of each treat-ment were thought of as three replicates. The subsequent culture procedures were the same for each treatment. The chosen NaCl concentration was based on our previous research [26]. Four time points (0-, 3-, 12- and 24-hour) after transfer of the seedlings were set as sampling nodes. At each time point, whole roots under control or ST were cut as samples (named H0, H3, H12,
H24 and S3, S12, S24; where H and S correspond to dH2O and ST, respectively) and flash
fro-zen in liquid N2for storage. Note that the H0 represented the starting sample for both
treat-ments. Three biological replications were prepared and the corresponding root samples from each replication were mixed equally for subsequent steps.
2.2. Measurement of root length
At the sampling points of each replicate, 10 typical germinated seeds from each dish under con-trol and ST conditions were photographed. The root lengths of each treatment at each time point were calculated using the software Image J, by referring to the graph paper scale plate. Software Origin 8.5.1 was used to draw the figure using the data from Image J.
2.3. RNA extraction and library construction
RNA was extracted from seven mixed root tissues (H0, H3, H12, H24, S3, S12 and S24) follow-ing the protocol of Total RNA Purification Kit (TRK1001, LC Science, Houston, TX, USA). The quality and purity of the RNA were evaluated by Bioanalyzer 2100 and RNA 6000 Nano Lab Chip Kit (Agilent, Santa Clara, CA, USA).
Fifty nanograms of purified RNAs were taken from each RNA sample to construct the li-braries, and the rest of the RNA was carefully preserved for later use. Following the detailed protocol of the Gene Expression Sample Prep Kit (Illumina, San Diego, CA, USA), including the important steps of mRNA purification, mRNA fragmentation, adding adapter, reverse transcription and library validating, seven corresponding gene-expression libraries were suc-cessfully constructed, named H0, H3, H12, H24, S3, S12 and S24. These libraries were deep se-quenced on an Illumina Hiseq2500 at the LC-Bio Company (Hangzhou, China). The
generated image files were processed to produce digital sequence data.
2.4. Sequence analysis
Through base calling, the 36-bp nucleotide sequences originated from the Illumina platform were designated as raw data. The raw data were filtered by removing the following four types of sequence tags: (1)5-bp dimer-containing tags, (2)3 bp of ambiguous nucleotides, (3) 3’-adapter tags and (4) tags with sequence quality values<Q20. The remaining sequences were considered as clean tags (the corresponding data have been submitted to the SRA data-base of NCBI with the ID PRJNA237675).
The clean-tag sequences of each library were mapped to theB. rapatranscripts ( ftp://ftp.jgi-psf.org/pub/compgen/phytozome/v9.0/Brapa/annotation/Brapa_197_transcript.fa.gz) using Bowtie software to monitor and count the mapping events on both the sense and the comple-mentary antisense sequences from the transcript database. Only a one-nucleotide mismatch was permitted in this process.
The fragments per kilobase of transcript per million mapped reads (FPKM) method was used to map the clean data for each gene, which indicated the gene-expression level. In this ex-periment, apvalue0.05 and a |log2FPKM ratio|1 were set as the thresholds to determine the significance of gene-expression difference between samples. Notably, gene-expression com-parisons of the samples at the 3-, 12- and 24-hour time points (S3/H3, S12/H12 and S24/H24) were performed. The Mev software produced heat-maps representing the expression patterns of the Differentially Expressed Genes (DEGs) and gene transcripts at each time point.
calculated according to Wanget al. [27]. Similarly, the pathway enrichment analysis was done using the KEGG database. For each of these analyses, apvalue<0.05 was required for differ-ences to be considered statistically significant.
2.5. Quantitative real-time PCR (qPCR)
Three biological replications with two technique replications of RNA were used for qPCR anal-ysis. After being treated with RNase-free DNase, RNA samples were used as templates for re-verse transcription with the M-MLV RTase cDNA Synthesis Kit (Takara, Dalian, China). Primers were designed using PRIMER3 software and listed inS1 Table. The expression of
β-actin gene was used as a control. About 1μl of the cDNAs of each sample were used for
ordi-nary PCR to test whether the corresponding primers generated products. Real time PCR was carried out with the SYBR Green PCR Master Mix system (Takara) on an ABI 7500 Real-time PCR platform. The PCR amplification conditions were performed according to Zouet al[21]. TheΔΔCtValue for each gene was analyzed in Microsoft Excel and used to indicate the change
in expression level between two samples.
Results
3.1. Effects of salt stress on
B. napus
root development
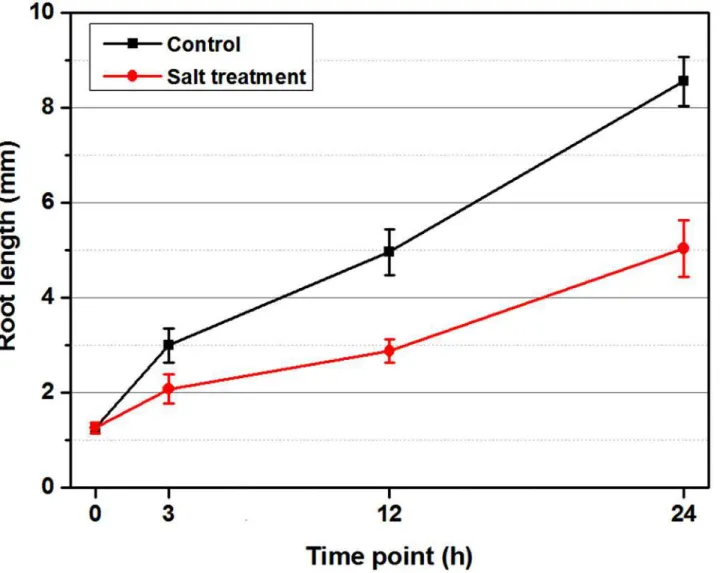
Seeds should experience a different process of water uptake under the control and salt treat-ment (ST) during imbibition. To avoid this complication, the germinated seeds were used in this study (H0 inFig. 1). Changes in root length under two treatments were shown inFig. 2. In the first 3 hours, uniform vigorous seeds developed with no obvious visible differences between the control and ST. However, the roots under the control were longer than those under ST at 12 hours, and this tendency was more evident in the following periods. The cotyledons of seeds under the control broke out of the coats completely at 12 hours, and those under ST emerged at 24 hours. In addition, roots were with root hairs under the control at 24 hours, which was not seen under ST.
3.2. Illumina sequencing and data analysis
Root samples fromB. napusline WH126 at four time points (0, 3, 12 and 24 hours) under ST and control conditions were used to construct 7 libraries for sequencing (Table 1). We obtained 8 million to 24 million raw reads from each of the seven libraries. After the process of adaptor deletion, junk filtering and low copy filtering,>99% of the sequences were confirmed as clean data. Through mapping to theB. rapagenome database, 54.85% to 65.61% of the clean data could be mapped, and 32,941 to 35,819 genes (>80% of the total 41,049 genes in theB. rapa ge-nome) were identified. Saturation analysis revealed that the mapped gene numbers appeared stable when the data reached 4 million reads (S1 Fig.). FromTable 1, for example, the raw data for the S12 library comprised 23 million clean reads, but the number of mapped genes (35,819) was almost equal to that of the S24 library, with 9 million reads. Therefore, the sequence data were sufficient to proceed with gene-expression analysis.
3.3. General gene-expression description during the time course of salt
stress
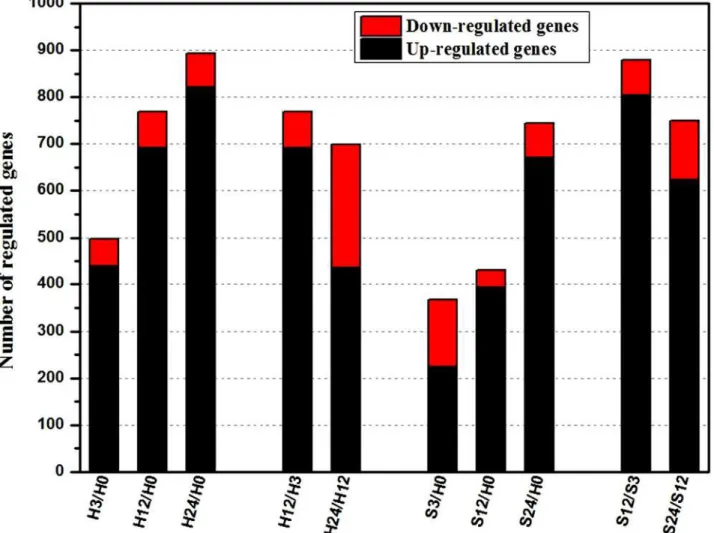
Compared with their expressions at H0, there were 497, 769 and 894 DEGs at the time points of 3-, 12- and 24-hour our during the control procedure, displaying a rising tendency in the numbers of DEGs. A similar performance was observed in the whole salt treatment procedure (Fig. 3). In addition, the gene-expression comparisons of adjacent time points of the two
Fig 1. Phenotypes of germinated seeds ofBrassica napusline WH126 at 0, 3, 12 and 24 hours after H2O (control) and salt (1.25% NaCl) treatments. The names on the figure refer to the corresponding rows of germinated seeds. H indicates H2O treatment, S indicates salt treatment and the adjacent
numbers indicate the sampling time points. The names were also used to describe the corresponding cDNA libraries.
treatments also showed the significant expression change. More than 700 genes were con-firmed as DEGs between two time points under the same treatment. Interestingly, the up-regulated genes outnumbered the down-up-regulated genes. To identify candidate genes that respond to salt stress inB. napusroots, we focused on the DEGs identified by comparing the gene expression levels under STvs. control conditions at the same time points.
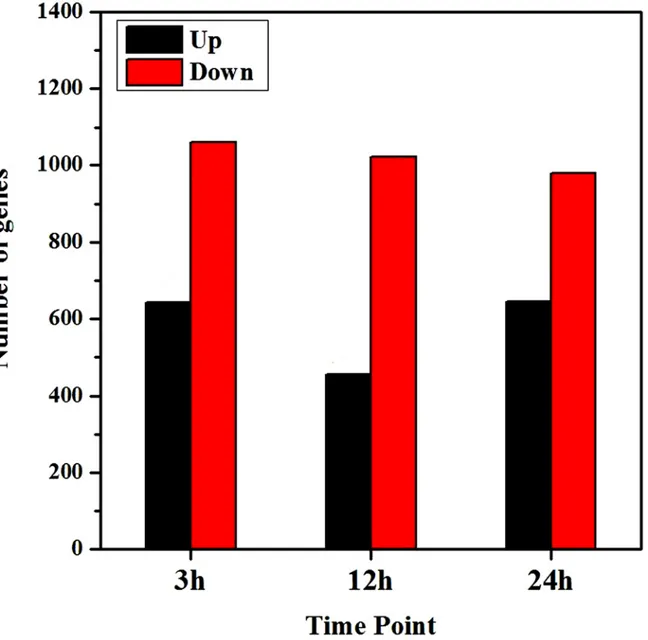
Of the mapped genes, 1,704 (4.93% of 34,536 genes), 1,477 (4.28% of 34,530 genes) and 1,626 (4.74% of 34,338 genes) genes were differentially expressed at 3-, 12- and 24-hour, re-spectively, among which 644, 455 and 646 genes were up-regulated and 1060, 1022 and 980 genes were down-regulated (Fig. 4). Down-regulated genes were much more than the numbers of up-regulated ones at each time point.
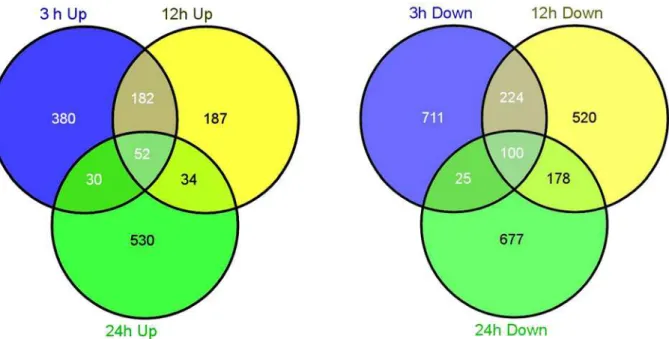
The Venn diagram demonstrates the number of unique up- and down-regulated genes at each time point (Fig. 5). Most DEGs were uniquely associated with a specific time point. For example, there were 644 up-regulated genes at the 3-hour time point, and more than a half (380/644, 59%) were identified to be increased only at the 3-hour. By analyzing the DEGs
Fig 2. Effect of salt (NaCl) onBrassica napusroots length during the 24-hour time course.Equal numbers of seeds were placed in three petri dishes under control (H2O treatment) and salt treatment (ST), separately, and placed randomly in the incubator. At each time point, the uniform germinated seeds
under both treatments were sampled from every dish to capture root-length values. The whole experiment was carried out on three replicates. The error bars represent the standard error (SE) of the mean root length.
doi:10.1371/journal.pone.0116217.g002
Table 1. DGE sequencing statistics.
Summary Illumina Tag Library
Items H0 H3 H12 H24 S3 S12 S24
Raw data total 8,432,911 15,078,553 9,384,024 8,085,785 24,347,894 23,763,501 9,541,163
Raw data unique reads 5,488,199 8,778,179 5,830,925 5,384,214 13,904,391 12,951,510 6,227,440 Clean data total 8,395,637 15,006,145 9,336,180 8,037,374 24,240,652 23,659,776 9,481,273 Clean data unique reads 5,458,027 8,721,040 5,791,613 5,342,824 13,821,175 12,873,390 6,178,792 All data mapping to gene total number 5,508,516 9,159,581 5,493,082 4,408,534 13,985,378 14,486,393 5,786,340 All data mapping to gene % of total clean reads 65.61% 61.04% 58.84% 54.85% 57.69% 61.23% 61.03% All data mapping to gene unique reads 3,599,320 5,409,508 3,468,335 3,181,089 7,974,423 7,969,495 3,789,067 All data mapping to gene % of unique clean reads 65.95% 62.03% 59.89% 59.54% 57.70% 61.91% 61.32%
All read-mapped genes number 32,941 34,536 34,530 34,338 35,189 35,819 35,036
All read-mapped genes % of ref genes 80.31% 84.20% 84.18% 83.71% 85.79% 87.32% 85.41%
doi:10.1371/journal.pone.0116217.t001
Fig 3. Summaries of differentially regulated genes during the time course.Differentially regulated genes were identified either by a comparison of adjacent stages or comparing each stage to H0.“H3/H0”indicates a comparison between the gene expression in the H3 library with that in the H0 library, and the same describes the other labels on the x-axis.
during the entire treatment course, only 163 genes were expressed differentially under salt treatment at all-time points (S2 Table).
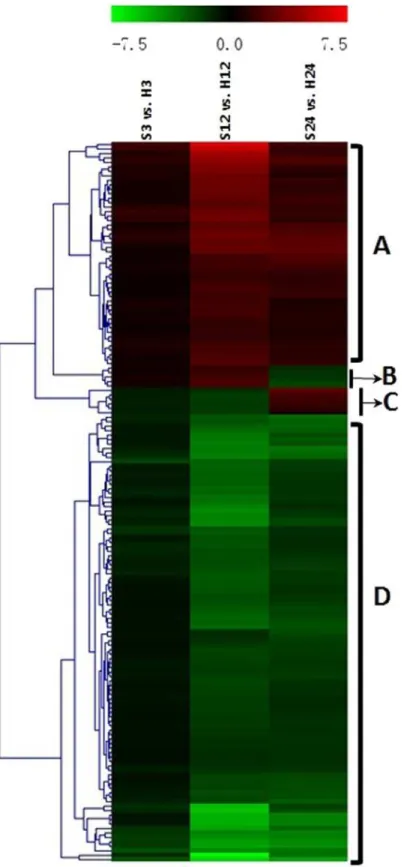
3.4. Expression patterns of 163 candidate genes
By comparing the gene expression levels between the ST and control treatments at the same time point, four dynamic expression patterns were indicated by the heat-map (Fig. 6). Cluster A (52 of 163 genes, all up-regulated) and cluster D (100 of 163 genes, all down-regulated) rep-resented the major regulation trends under ST and contained the majority genes. Meanwhile, cluster B and C had 11 genes that changed their regulation direction during the treatment course. In cluster B, 5 genes were up-regulated at 3- and 12-hour, but down-regulated at
24-Fig 4. Total regulated genes at each time point after salt treatment.Differentially expressed genes were confirmed based on whether the | log2Foldchange|1 andpvalue0.05.
doi:10.1371/journal.pone.0116217.g004
hour. In cluster C, 6 genes were down-regulated at 3-hour and 12-hour but up-regulated at 24-hour.
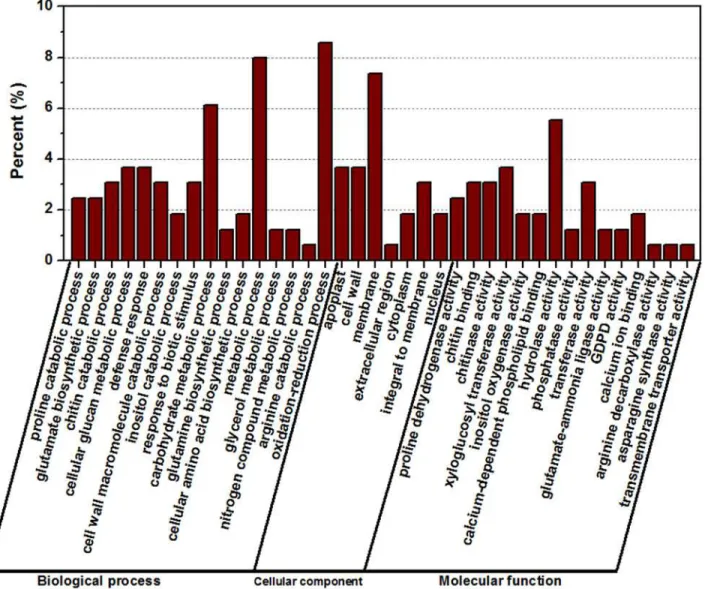
3.6. GO and KEGG analyses of salt stress-related DEGs
GO assignments were used to classify the functions of the 163 DEGs responding to salt stress (Fig. 7). Three non-mutually exclusive GO categories, biological process (BP), cellular compo-nent (CC), and molecular function (MF), were well represented. A total of 115 out of the 163 genes (70.55%) received GO function annotations. The most represented GO terms were pre-sented inFig. 7(according to theirp-values). In the BP category, the most abundant GO term were“oxidation-reduction process”and“metabolic process,”followed by“carbohydrate meta-bolic process,” “cellular glucan metabolic process,”and“defense response”. In the CC category,
“membrane”was the most abundant, followed by“cell wall”and“apoplast”. Similarly in the MF category,“hydrolase activity”was the most abundant category, followed by“xyloglucosyl transferase activity,” “chitin binding,” “chitinase activity”and“transferase activity”. Notably, some genes were assigned to more than one category.
A total of 26 genes could be aligned to the KEGG pathways (S2 Table). The pathways with more mapped genes were the ascorbate and aldarate metabolism (00053); inositol phosphate metabolism (00562); alanine, aspartate and glutamate metabolism (00250); and arginine and proline metabolism (00330).
3.6. Identification of genes responding to salt stress
Most genes (115/163) had Go annotations and only a few genes (26/163) had KEGG associa-tions; therefore, we screened the salt-responsive genes according to their GO annotations. The oxidation-reduction process, metabolic process and carbohydrate metabolic process were the most significant processes (Fig. 7andS2 Table). Therefore, these above genes were identified as the putative functional genes in related biological processes. These genes encoded enzymes
Fig 5. Venn diagram describing the exclusion and overlap of regulated genes at three time points.The left and right diagrams indicate the up- and down-regulated gene numbers, respectively.
Fig 6. Hierarchical cluster analyses of the 163 common differentially expressed genes (DEGs) at three time points.This map shows the changes of log2(foldchange) values at the indicated times (3 hours, 12
hours and 24 hours) during salt stress. The genes were assigned into four clusters.
doi:10.1371/journal.pone.0116217.g006
including the proline dehydrogenase (ProDH),Δ1-pyrroline-5-carboxylate synthase (P5CS), myo-inositol oxygenase (MIOX), cytochrome P450, 2-oxoglutarate (2OG) and Fe(II)-dependent oxygenase (2OG oxygenase), xyloglucan endotransglucosylase/hydrolase (XTH). The accumulations of the transcripts of these genes at the four time points under both treat-ments were shown inFig. 8. Moreover, some of these genes were among the top 10 differential-ly expressed genes at one or more time points under salt stress (S2 Table), indicating their important roles in salt stress resistance.
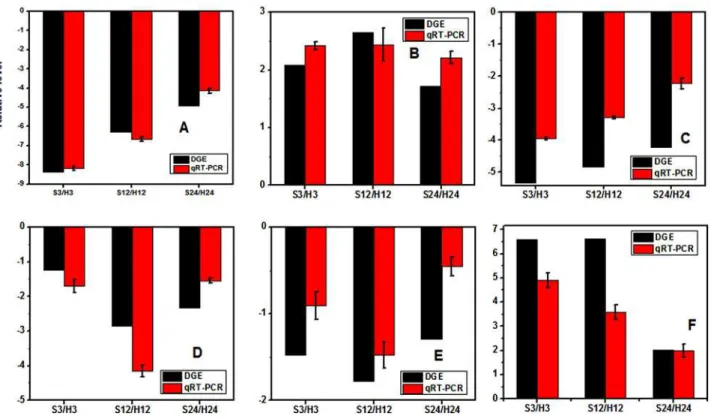
3. 7. Confirmation of DGE profiles by qPCR analysis
To validate the results of DGE, transcriptional levels of 31 genes were evaluated by qPCR. The data of qPCR were inS3 Table. The comparisons of the relative expression levels of six genes under the two treatments were shown inFig. 9. Although the change folds were not exactly the
Fig 7. Gene Ontology (GO) analyses of commonly differentially expressed genes at three time points.The differentially expressed genes were assigned into three groups, including biological process, cellular components and molecular function. The x-axis represents the most abundant categories of each group, and the y-axis represents the percentages of the total genes in each category.
same as those revealed by the transcriptome profiling data, all the validated genes showed simi-lar expression patterns that were consisted with the DGE data.
Discussion
4.1. The choice of time points for transcriptome analysis
In this study, we identified important candidate genes by comprehensive investigation of the time course (within 24 hours) of the transcriptomic response to salt stress. Before the sampling of RNA-seq, a phenotype evaluation was performed. As shown inFig. 2, root-length compari-sons between the three time points demonstrated that salt stress seriously constrained root
Fig 8. Heat-map representation for the regulation by salt stress of the focused genes.The transcript abundance of each gene at each time point under control or ST was normalized. The top color bar represents the comparative expression level. A redder color indicates more transcript accumulation, and greener indicates less.
doi:10.1371/journal.pone.0116217.g008
development ofB. napus. The root lengths under control or ST had no detectable difference within the first 3 hours, but the phenotype difference became obvious with increasing time (Fig. 1). This phenomenon showed that: (1) salt stress inhibited root growth; and (2) salt stress required some time to exert its negative function on plant development. A similar phenotype was reported in Olive,Leymus chinensisand tomato under salt stress [28–30].
According to some studies inBrassica rapa[22], tomato [30] and rice [31] under ST, changes of transcriptome occur before obvious phenotypic variation. Therefore, the 3-hour time point of salt treatment is a good choice to study responding genes at the early stage under salt stress. Furthermore,Fig. 1showed the general developmental process of germinated seeds under two treatments. The obvious phenotypic differences of germinated seeds between the control and ST were seen at 12- and 24-hour. These two time points could be the late stage to study salt-responding genes. And moreover, the time points of 0-, 3-, 12- and 24-hour were also used in previous reports [31–33]. Therefore, we chose these time points as the
sampling nodes.
4.2 The reliability of the DGE data
There was no genome sequence for the amphidiploid ofB. napus, which made an obstacle for genes annotation. Fortunately, the genome ofB. rapa, one parent ofB. napus, was released [34]. Genes ofB. napusshowed a high degree of collinearity toB. rapa[35,36]. Moreover, the majority ofB. napussequence tags derive from transcripts with the same function as theirB. Fig 9. Quantitative real-time PCR (qPCR) validations of gene expression levels from digital gene expression (DGE) analysis.The qPCR values are presented as the averages of three independent experiments. The genes were randomly selected.“S3/H3”indicates a comparison between the expressions of the corresponding genes in the S3 library with that in the H3 library. The“S12/H12”and“S24/H24”ratios indicate analogous comparisons. The y-axis indicates the fold-changes obtained by two methods. The“A-F”indicates the genes with the assay names of Bra041014, Bra000150, Bra020731, Bra011843, Bra023573 and Bra000090, respectively.
rapahomologs [37]. Therefore, annotations of genes fromB. napusbased onB. rapagenome were acceptable.
Though there were no technical replicates for the DGE sequencing in this study, we believe that the results were reliable for the following reasons: (1) the expression levels of the genes from the sequence data were verified by qPCR, indicating that the outcomes derived from DGE sequence reflected the real situation of the global gene expression profiles. (2) Only the common DEGs during the time course were taken forward for analysis. These DEGs were de-tected at all three time points. In other words, they were captured three times during the time course, proving they responded to salt stress. (3) In contrast to the experimental design used during the time course of stress in other publications [28,38,39], this study set a control at every time point. At each time point, the difference in gene expression was analyzed by com-paring the gene expression level under ST with that under the corresponding control, not with that at the start point, which excluded the interference from genes whose expression levels changed regardless of the circumstances and general genetic backgrounds.
Analysis of the root transcriptome under salt-stress and control conditions, using a high-throughput sequencing method, identified the global gene-expression profiles occurring during salt-crop interactions. We used the DGE technology onB. napusroots under ST and control conditions and mapped the clean reads ofB. napusto the genome ofB. rapa. Based on the high collinearity and relationship ofB. rapaandB. napus[36], over 30,000B. rapagenes (41,019 unique genes) were matched to each library. Although about 30% of the total reads from each library were not mapped, saturation analysis revealed that the mapped genes were saturated, which indicated that the number of mapped genes would not increase with ADDITIONAL se-quence data. More than 70% (30,000/41,019) ofB. rapagenes were mapped, which was bigger than the percentages in poplar,Reaumuria trigynaand soybean under salt stress [38–40], showing that we obtained expression information of a sufficient number of genes and estab-lished a good foundation for subsequent analysis.
4.3 Candidate genes for salt tolerance in
B. napus
Only 163 DEGs were identified as specifically responding to salt stress. The number of genes was fewer than that in other studies probably because we conducted“two-step filtering”: (1) Gene expression-levels were compared with their own time-point controls. (2) Taking intersec-tions of the DEGs at three time points identified the common DEGs. We paid more attention to the DEGs identified throughout the time course instead of those gens which were changed at a single time point. Some of the DEGs identified in our study were also found by Lianget al. [17], such as the glycine-rich protein, ERD family proteins, glycosyl transferase family and ubi-quitin-protein ligase. Many salt-responsive orthologous genes shared conserved functional roles across different plant species [41]. Similarly, some classical salt-related genes and metabo-lisms were confirmed in this study. Meanwhile, some new salt-responsive genes from our study may provide new clues to a deeper understanding of salt tolerance mechanisms in crops.
4.4 Genes related with the oxidation-reduction process respond to salt
stress
Salt stress induces reactive oxygen species (ROS), which leads to secondary oxidation stress, disturbs cellular redox homeostasis, and damages cell components and structures [42]. Thus genes involved in the oxidation-reduction process may respond to salt stress. Through expres-sion comparison, GO and KEGG enrichment analyses, some genes and related pathways were identified.
The proline metabolism pathway, an important pathway responding to oxidation stress, was represented by the most DEGs and was most significant during the stress course. The relat-ed enzyme-coding genes were in the top 10 list in our results (S2 Table). Of the genes involved in proline metabolism pathway, 4 genes were extremely down-regulated at 3 time points, and they were predicted to be encoded Pro dehydrogenase (ProDH), catalyzing proline to
Δ1-Pyrroline-5-Carboxlyate (P5C), which were related with the core proline metabolism path-way [43]. In addition, although three up-regulated genes encoding theΔ1 -pyrroline-5-carboxylate synthase (P5CS), which catalyzed the glutamate to P5C, were not in the top 10, the genes were common DEGs. Sustained down-regulation ofProDHand up-regulation of
P5CSwould make glutamate flow more towards proline, which agreed with the other studies [15–16].
Myo-inositol oxygenase (MIOX) may play an important role in alleviating over-production of ROS from salt stress. L-ascorbic acid (AsA) is an important component of the anti-oxidative system in plants, which provides crucial protection against oxidative damage induced by salt pressure [44]. In plants, there are two AsA biosynthetic pathways [45]. One is from D-gluc-tose-6-P to L-galactose, which is then oxidized by the NAD-dependent L-galactose dehydroge-nase to form L-galactono-1,4-lactone, the immediate precursor of AsA. The other pathway is from myo-inositol (Ins) to L-galactono-1,4-lactone, and then to AsA. In the second pathway, MIOX catalyzes the first step, cleaving the Ins ring to form D-Glucuronic Acid (DGlcA). DGlcA is used to synthesize L-galactonic acid, which spontaneously converts to L-galactono-1,4-lactone and is oxidized to AsA. In this study, extreme differences in expressions levels of
MIOXgenes (especially forMIOX4) were observed during the stress process. Coincidentally, Lorenceet al. [46] overexpressed theMIOX4gene in transgenicArabidopsisand observed a 2-to 3-fold increase in AsA, suggesting a direct link between Ins oxidation and AsA synthesis. Combined with the results from GO and KEGG analyses, theMIOXgenes may contribute to AsA synthesis. Although there have been some studies about the function of MIOX in AsA synthesis in recent years, none of the studies reveal the detailed function related to the response to salt stress [47–49]. Besides, expression variations ofMIOXgenes were proved to be involved in the changes of AsA in apple, pepper and strawberry [50–52], which provided some positive evidences for our hypothesis. In our results, theMIOXgenes were consistently down-regulated in response to salt stress, which was also observed in rice roots in response to salinity stress [53]. The expression change may decrease AsA content. Because of the criterion of identifying differentially genes, only those genes which were differentially expressed at all the 3 time points were selected. Genes related to an alternative AsA synthesis pathway, a pathway that might compensate for the reduction inMIOX, were not found in the list of the 163 genes. There were no clues showed that this pathway was enhanced or inhibited under salt stress. However, en-hancing the pathway from Ins to AsA by engineeringMIOXgenes may increase the antioxi-dant ability, which was probably a major step towards the development of salinity-tolerant crop plants [54].
The UDP-Glycosyltransferases (UGTs) usually transfer UDP-xylose to low-molecular-weight aglycone substrates and alter their activity, solubility, and transport in plants. The sub-strates include multiple hormones (such as auxin, ABA, cytokinin, salicylic acid, and brassinos-teroids), which alter ROS levels through regulation of ROS-scavenging related genes and hence modulate biotic and abiotic stress tolerance [61–62]. Langlois-Meurinneet al. [63] showed that expression ofUGT73B3was necessary during the hypersensitive response. The expression vari-ations inUGTexpression were also observed in legume (http://bioinformatics.cau.edu.cn/ MtED/probe_search.php?probeid=Mtr.44246.1.S1_at) and Citrus under salt stress [64]. In this study, twoUGThomologous genes showed differential expression, suggesting that theUGTs
may also participate in the salt stress response.
The 2-oxoglutarate and Fe(II)-dependent oxygenase (2OG oxygenase) couples two-electron oxidation of a substrate to the oxidative decarboxylation of 2-oxoglutarate to give succinate and carbon dioxide. ADMR6gene, encoding a 2-oxoglutarate (2OG)-Fe(II) oxygenase, medi-ates resistance to downy mildew by activating other defense genes [65]. The 2OG oxygenase modulates rice leaf rolling by affecting secondary cell wall formation in leaves, which protects plants from water stress [66]. The strong differential regulation of the 2OG oxygenase gene was also seen in the transcriptome of citrus under bacterial infection [64]. All these results sug-gested the function of the 2OG oxygenase in stress resistance. In our results, the genes encoding the 2OG oxygenase showed continuous down-regulation during the time course of salt stress, which implied a role of them in resistance to salt stress.
4.5 Genes in carbohydrate metabolic process function in salt stress
In this study, 6 genes encoding xyloglucan endotransglucosylase/hydrolases (XTHs) were found to be differentially expressed under salt stress. XTHs are proved in both the splitting and/or reconnection of xyloglucan cross-links, and are considered to play a critical role in both the construction and the disassembly of cell wall architecture, which can alter the compositions of cell walls by regulating their expression levels [67–70]. Cell wall, as a physical barrier sur-rounding the plant cell, is intimately involved in plant responses to the external environments through changes in its architecture and composition. And some studies reveal that salt stress affects cell walls severely, including the rigidity and composition [71].Overexpression ofXTHgenes fromPopulus euphratica(a salt-tolerant tress species) in to-bacco could increase salt tolerance by the development of leaf succulence via highly packed pal-isade parenchyma cells [72]. Constitutive expression of abiotic stress-inducible hot pepper
CaXTH3improves drought and salt tolerance in transgenicArabidopsisplants [73]. Many
studies suggestXTHgenes are related with plant tolerance to salt, though the molecular mecha-nisms remain unclear. The 6XTHgenes identified in our study could be important candidate genes for further study.
4.6 Possible mechanisms for the decrease of root length under salt
stress
In this study, root length under control treatment was significantly longer than that under ST, which showed that salt stress inhibited root development. This implied that salt stress inhibited cell proliferation in the roots. Our results suggested some putative mechanisms to explain the shortened roots caused by salt stress: (1) High concentrations of NaCl in the environment de-creased the water potential, which made it difficult for the plant cells to absorb external water [2]. The up-regulation ofP5CSand down-regulation ofProDHincreased proline synthesis, which could balance the water potential inside and outside the cells to some extent. This change would only inhibit the water flow from the cells to the environment and could not help
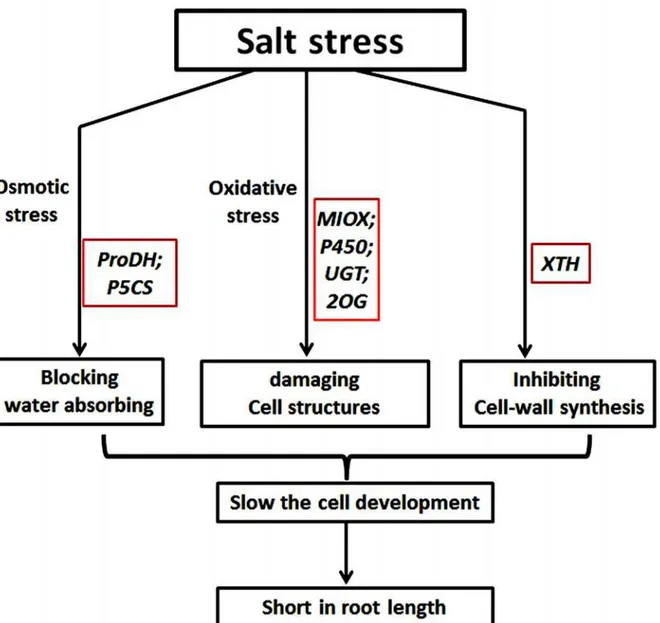
cells absorb enough water to perform related substrate synthesis for cell development. There-fore, root development slowed down. (2) Large amounts of ROS were generated in root cells under ST, which may cause oxidative damage to cells [48]. Under control conditions, the ROS scavenging system may neutralize the excess ROS. By contrast, down-regulation of related genes (such asMIOXand P450) decreased antioxidant synthesis, which weakened the resis-tance to ROS under ST. Moreover, high amount of ROS damaged the existing active cells, which had a negative effect on cell proliferation. (3) The cell wall is the outermost structure of plant cells; therefore, salt stress must have some interactions with the cell wall and its constitu-ent proteins. Cell wall loosening and extensibility, which occur during cell growth and division, are regulated by theXTHs. Down-regulation ofXTHsunder salt stress would negatively affect cell wall reconstruction and resynthesis, which would interfere with roots cell expansion and division. Taken together, salt stress inhibited root development in different ways at the germi-nation stage, including by osmotic stress, oxidative stress and damage to the cell wall (Fig. 10).
Fig 10. Proposed model for root-development inhibition under salt stress.Salt stress caused osmotic stress, oxidative stress and cell wall damage to the roots. Some salt-stress related genes (in red boxes) were regulated by, or responded to, each of these three aspects.
Conclusions
In summary, the root transcriptomes ofB. napusat four time points under control and salt-stress conditions were explored using the Illumina sequencing platform. Approximately 1,500 genes were identified as DEGs after mapping the sequence data to theB. rapagenome. By com-paring gene expression levels between salt treatment and the control at each time point, 163 genes were identified to be differentially expressed in response to salt stress throughout the time course, indicating that these genes functioned principally inB. napusunder salt stress. Some important genes were identified by GO and KEGG analyses, which may play important roles in tolerance to the osmotic stress, oxidative stress and cell wall damage caused by salt stress. Thus, this study identified salt responding genes and their related metabolic pathways, and provided a platform for discovering salt tolerance mechanisms in plants. Manipulation of the candidate genes from this experiment may enhance crop salt tolerance.
Supporting Information
S1 Fig. Saturation analyses of seven libraries.
(TIF)
S1 Table. Primers of selected genes in Qpcr.
(XLSX)
S2 Table. Expression data of the 163 DEGs at each time point and their function analyses.
(XLSX)
S3 Table. Original data of qPCR for selected genes.
(XLSX)
Author Contributions
Conceived and designed the experiments: WL XLZ XZ. Performed the experiments: WL XLZ XZ. Analyzed the data: WL XLZ XZ. Contributed reagents/materials/analysis tools: WL XLZ XZ. Wrote the paper: WL XLZ XZ.
References
1. Yamaguchi T, Blumwald E (2005) Developing salt-tolerant crop plants: challenges and opportunities. Trends Plant Sci 10: 615–620. PMID:16280254
2. Rozema J, Flowers T (2008) Crops for a salinized world. Science 322: 1478–1480. doi:10.1126/ science.1168572PMID:19056965
3. Ashraf M, Foolad MR (2013) Crop breeding for salt tolerance in the era of molecular markers and mark-er-assisted selection. Plant Breed 132: 10–20.
4. Jamil A, Riaz S, Ashraf M, Foolad MR (2011) Gene expression profiling of plants under salt stress. Crit Rev Plant Sci 30: 435–458.
5. Zhu JK (2002) Salt and drought stress signal transduction in plants. Ann Rev Plant Biol 53: 247–273. PMID:12221975
6. Ren ZH, Gao JP, Li LG, Cai XL, Huang W, et al. (2005) A rice quantitative trait locus for salt tolerance encodes a sodium transporter. Nat Genet 37: 1141–1146. PMID:16155566
7. Ali Z, Zhang da Y, Xu ZL, Xu L, Yi JX, et al. (2012) Uncovering the salt response of soybean by unravel-ing its wild and cultivated functional genomes usunravel-ing tag sequencunravel-ing. PLoS One 7: e48819. doi:10. 1371/journal.pone.0048819PMID:23209559
8. Zhu JK, Liu J, Xiong L (1998) Genetic analysis of salt tolerance inArabidopsis: evidence for a critical role of potassium nutrition. Plant Cell 10: 1181–1191. PMID:9668136
9. Zhu JK (2003) Regulation of ion homeostasis under salt stress. Curr Opin Plant Biol 6: 441–445. PMID:12972044
10. Ludwig AA, Romeis T, Jones J D (2004) CDPK-mediated signaling pathways: specificity and cross-talk. J Exp Bot 55: 181–188. PMID:14623901
11. Nakagami H, Pitzschke A, Hirt H (2005) Emerging MAP kinase pathways in plant stress signaling. Trends Plant Sci 7: 339–346. PMID:15953753
12. Ma S, Gong Q, Bohnert HJ (2006) Dissecting salt stress pathways. J Exp Bot 57: 1097–1107. PMID: 16510518
13. Fujita M, Fujita Y, Noutoshi Y, Takahashi F, Narusaka Y, et al. (2006) Crosstalk between abiotic and bi-otic stress responses: a current view from the points of convergence in the stress signaling networks. Curr Opin Plant Biol 9: 436–442. PMID:16759898
14. Xiong L, Zhu JK (2002) Molecular and genetic aspects of plant responses to osmotic stress. Plant, Cell Environ 25: 131–139. PMID:11841658
15. Xue X, Liu A, Hua X (2009) Proline accumulation and transcriptional regulation of proline biosynthesis and degradation inBrassica napus. BMB Rep 42: 28–34. PMID:19192390
16. Saadia M, Jamil A, Akram NA, Ashraf M (2012) A study of proline metabolism in canola (Brassica napusL.) seedlings under salt stress. Molecules 17: 5803–15. doi:10.3390/molecules17055803 PMID:22592086
17. Chen L, Ren F, Zhong H, Jiang W, Li X (2010) Identification and expression analysis of genes in re-sponse to high-salinity and drought stresses inBrassica napus. Acta Biochim Biophys Sin 42: 154–164. PMID:20119627
18. Susan RS, Aureliano B, Lukas AM (2012) Designing a transcriptome next-generation sequencing proj-ect for a non-model plant species. Am J Bot 99: 257–266. doi:10.3732/ajb.1100292PMID:22268224 19. Jiang J, Shao Y, Du K, Ran L, Fang X, et al. (2013) Use of digital gene expression to discriminate gene
expression differences in early generations of resynthesizedBrassica napusand its diploid progenitors. BMC Genomics 14: 72. doi:10.1186/1471-2164-14-72PMID:23369045
20. Yan X, Dong C, Yu J, Liu W, Jiang C, et al. (2013) Transcriptome profile analysis of young floral buds of fertile and sterile plants from the self-pollinated offspring of the hybrid between novel restorer line NR1 and Nsa CMS line inBrassica napus. BMC Genomics 14: 26. doi:10.1186/1471-2164-14-26PMID: 23324545
21. Zou X, Tan X, Hu C, Zeng L, Lu G, et al. (2013) The transcriptome ofBrassica napusL. roots under wa-terlogging at the seedling stage. Int J Mol Sci 14: 2637–2651. doi:10.3390/ijms14022637PMID: 23358252
22. Trick M, Long Y, Meng J, Bancroft I (2009) Single nucleotide polymorphism (SNP) discovery in the poly-ploidyBrassica napususing Solexa transcriptome sequencing. Plant Biotechnol J 7: 334–346. doi:10. 1111/j.1467-7652.2008.00396.xPMID:19207216
23. Harper AL, Trick M, Higgins J, Fraser F, Clissold L, et al. (2012) Associative transcriptomics of traits in the polyploid crop speciesBrassica napus. Nat biotechnol 30: 798–804. PMID:22820317
24. Körbes AP, Machado RD, Guzman F, Almerão MP, de Oliveira LF, et al. (2012) Identifying conserved and novel microRNAs in developing seeds ofBrassica napususing deep sequencing. PLoS One 7: e50663. doi:10.1371/journal.pone.0050663PMID:23226347
25. Hong LZ, Li J, Schmidt-Kuntzel A, Warren WC, Barsh GS (2011) Digital gene expression for non-model organisms. Genome Res 21: 1905–1915. doi:10.1101/gr.122135.111PMID:21844123
26. Long W, Pu H, Zhang J, Qi C, Zhang X (2013) Screening ofBrassica napusfor salinity tolerance at ger-mination stage. Chinese journal of oil crop sciences 35: 271–275.
27. Wang X, Xu R, Ruling W, Liu A (2012) Transcriptome analysis of Sacha Inchi (Plukenetia volubilis L.) seeds at two developmental stages. BMC Gemomics 13: 716. doi:10.1186/1471-2164-13-716PMID: 23256450
28. Bazakos C, Manioudaki ME, Therios I, Voyiatzis D, Kafetzopoulos D (2012) Comparative Transcrip-tome Analysis of Two Olive Cultivars in Response to NaCl-Stress. PLoS ONE 7: e42931. doi:10.1371/ journal.pone.0042931PMID:22952621
29. Sun Y, Wang F, Wang N, Dong Y, Liu Q, et al. (2013) Transcriptome exploration inLeymus chinensis
under saline-alkaline treatment using 454 pyrosequencing. PLoS One. 8: e53632. doi:10.1371/ journal.pone.0053632PMID:23365637
30. Sun W, Xu X, Zhu H, Liu A, Liu L, et al. (2010) Comparative transcriptomic profiling of a salt-tolerant wild tomato species and a salt-sensitive tomato cultivar. Plant Cell Physiol 51: 997–1006. doi:10.1093/ pcp/pcq056PMID:20410049
32. Lee SC, Lim MH, Ki JA, Lee SI, Kim JS, et al. (2008) Transcriptome analysis in Brassica rapa under the abiotic stresses using Brassica 24K oligo microarray. Mol Cells 26: 595–605. PMID:18797175 33. Kreps JA, Wu Y, Chang HS, Zhu T, Wang X (2002) Transcriptome Changes forArabidopsisin
Re-sponse to Salt, Osmotic, and Cold Stress. Plant Physiol 130: 2129–2141. PMID:12481097 34. Wang X, Wang H, Wang J, Sun R, Wu J, et al. (2011) The genome of the mesopolyploid crop species
Brassica rapa. Nat Genet 43: 1035–9. doi:10.1038/ng.919PMID:21873998
35. Rana D, van den Boogaart T, O’Neill CM, Hynes L, Bent E, et al. (2004) Conservation of the microstruc-ture of genome segments inBrassica napusand its diploid relatives. Plant J 40: 725–33. PMID: 15546355
36. Suwabe K, Morgan C, Bancroft I (2008) Integration of Brassica A genome genetic linkage map between
Brassica napusandB. rapa. Genome 51: 169–76. doi:10.1139/G07-113PMID:18356952
37. Bancroft I, Cheung F, Trick M, Drou N, Lim YP, et al. (2009) Comparative Analysis between Homoeolo-gous Genome Segments ofBrassica napusand Its Progenitor Species Reveals Extensive Sequence-Level Divergence. Plant Cell 21: 1912–1928. doi:10.1105/tpc.108.060376PMID:19602626 38. Chen S, Jiang J, Li H, Liu G (2012) The salt-responsive transcriptome ofPopulus simonii×Populus
nigravia DGE. Gene 504: 203–12. doi:10.1016/j.gene.2012.05.023PMID:22634611
39. Dang ZH, Zheng LL, Wang J, Gao Z, Wu SB, et al. (2013) Transcriptomic profiling of the salt-stress re-sponse in the wild recretohalophyteReaumuria trigyna. BMC Genomics 14: 29. doi: 10.1186/1471-2164-14-29PMID:23324106
40. Ge Y, Li Y, Zhu YM, Bai X, Lv DK, et al. (2010) Global transcriptome profiling of wild soybean (Glycine soja) roots under NaHCO3 treatment. BMC Plant Biol 10: 153. doi:10.1186/1471-2229-10-153PMID: 20653984
41. Agarwal PK, Shukla PS, Gupta K, Jha B (2013) Bioengineering for salinity tolerance in plants: state of the art. Mol Biotechnol 54: 102–23. doi:10.1007/s12033-012-9538-3PMID:22539206
42. Shalata A, Neumann PM (2001) Exogenous ascorbic acid (vitamin C) increases resistance to salt stress and reduces lipid peroxidation. J Exp Bot 52: 2207–2211. PMID:11604460
43. Verslues PE, Sharma S (2010) Proline metabolism and its implications for plant-environment interac-tion. TheArabidopsisbook 8: e0140. doi:10.1199/tab.0140PMID:22303265
44. Noctor G, Foyer CH (1998) Ascorbate and glutathione: keeping active oxygen under control. Annu Rev Plant Physiol Plant Mol Biol 49: 249–279. PMID:15012235
45. Wheeler GL, Jones MA, Smirnoff N (1998) The biosynthetic pathway of vitamin C in higher plants. Na-ture 393: 365–369. PMID:9620799
46. Lorence A, Chevone BI, Mendes P, Nessler CL (2004). Myo-inositol oxygenase offers a possible entry point into plant ascorbate biosynthesis. Plant Physiol 134: 1200–1205. PMID:14976233
47. Kanter U, Usadel B, Guerineau F, Li Y, Pauly M, et al. (2005) The inositol oxygenase gene family of
Arabidopsisis involved in the biosynthesis of nucleotide sugar precursors for cell-wall matrix polysac-charides. Planta 221: 243–254. PMID:15660207
48. Endres S, Tenhaken R (2009) Myo-inositol oxygenase controls the level of myo-inositol inArabidopsis, but does not increase ascorbic acid. Plant Physiol 149: 1042–1049. doi:10.1104/pp.108.130948 PMID:19091876
49. Endres S, Tenhaken R (2011) Down-regulation of the myo-inositol oxygenase gene family has no effect on cell wall composition inArabidopsis. Planta 234: 157–69. doi:10.1007/s00425-011-1394-zPMID: 21394467
50. Alós E, Rodrigo MJ, Zacarías L (2013) Transcriptomic analysis of genes involved in the biosynthesis, recycling and degradation of L-ascorbic acid in pepper fruits (Capsicum annuumL.). Plant Sci 207: 2–11. doi:10.1016/j.plantsci.2013.02.007PMID:23602093
51. Li M, Chen X, Wang P, Ma F (2011) Ascorbic Acid Accumulation and Expression of Genes Involved in Its Biosynthesis and Recycling in Developing Apple Fruit. J Am Soc Hortic Sci 136: 231–238. 52. Cruz-Rus E, Amaya I, Sánchez-Sevilla JF, Botella MA, Valpuesta V (2011) Regulation of L-ascorbic
acid content in strawberry fruits. J Exp Bot 62: 4191–201. doi:10.1093/jxb/err122PMID:21561953 53. Cotsaftis O, Plett D, Johnson AA, Walia H, Wilson C, et al. (2011) Root-specific transcript profiling of contrasting rice genotypes in response to salinity stress. Mol Plant 4: 25–41. doi:10.1093/mp/ssq056 PMID:20924028
54. Taqi K, Mohd M, Firoz M (2011) A review of ascorbic acid potentialities against oxidative stress induced in plants. J Agrobiology 28: 97–111.
55. Bak S, Beisson F, Bishop G, Hamberger B, Hofer R, et al. (2012) Cytochromes P450. TheArabidopsis
Book 9: e0144.
56. Zhao Y, Hull AK, Gupta NR, Goss KA, Alonso J, et al. (2002) Trp-dependent auxin biosynthesis in Ara-bidopsis: involvement of cytochrome P450sCYP79B2andCYP79B3. Genes Dev 16: 3100–12. PMID: 12464638
57. Park J, Kim YS, Kim SG, Jung JH, Woo JC, et al. (2011) Integration of auxin and salt signals by the NAC transcription factor NTM2 during seed germination inArabidopsis. Plant Physiol 156: 537–49. doi:10.1104/pp.111.177071PMID:21450938
58. Jung J-H, Park C-M (2011) Auxin modulation of salt stress signaling inArabidopsisseed germination. Plant signaling Behav 6: 1198–1200. doi:10.4161/psb.6.8.15792PMID:21757997
59. Yun-Xiang Z, Doo-Hwan K, Beom-Seok P, Seung-Beom H (2009) Metabolic engineering of indole glu-cosinolates in Chinese cabbage hairy roots expressingArabidopsis CYP79B2,CYP79B3, and
CYP83B1. Biotechnol Bioprocess Eng 14: 467–473.
60. Varshney RK, Hiremath PJ, Lekha P, Kashiwagi J, Balaji J, et al. (2009) A comprehensive resource of drought- and salinity- responsive ESTs for gene discovery and marker development in chickpea (Cicer arietinum L.). BMC Genomics 10: 523. doi:10.1186/1471-2164-10-523PMID:19912666
61. Ross J, Li Y, Lim E, Bowles DJ (2001) Higher plant glycosyltransferases. Genome Biol 2: RE-VIEWS3004. PMID:11182895
62. Tognetti VB, Van Aken O, Morreel K, Vandenbroucke K, van de Cotte B, et al. (2010) Perturbation of in-dole-3-butyric acid homeostasis by the UDP-glucosyltransferase UGT74E2 modulatesArabidopsis ar-chitecture and water stress tolerance. Plant Cell 22: 2660–79. doi:10.1105/tpc.109.071316PMID: 20798329
63. Langlois-Meurinne M, Gachon CM, Saindrenan P (2005) Pathogen-responsive expression of glycosyl-transferase genesUGT73B3andUGT73B5is necessary for resistance toPseudomonas syringaepv tomato inArabidopsis. Plant Physiol 139: 1890–901. PMID:16306146
64. Albrecht U, Bowman KD (2012) Transcriptional response of susceptible and tolerant citrus to infection withCandidatusLiberibacter asiaticus. Plant Sci 185–186: 118–30.
65. Van Damme M, Huibers RP, Elberse J, Van den Ackerveken G (2008)Arabidopsis DMR6encodes a putative 2OG-Fe(II) oxygenase that is defense-associated but required for susceptibility to downy mil-dew. Plant J 54: 785–93. doi:10.1111/j.1365-313X.2008.03427.xPMID:18248595
66. Fang L, Zhao F, Cong Y, Sang X, Du Q, et al. (2012) Rolling-leaf14 is a 2OG-Fe (II) oxygenase family protein that modulates rice leaf rolling by affecting secondary cell wall formation in leaves. Plant Bio-technol J 10: 524–532. doi:10.1111/j.1467-7652.2012.00679.xPMID:22329407
67. Nishitani K (1997) The role of endoxyloglucan transferase in the organization of plant cell walls. Int Rev Cytol 173: 157–206. PMID:9127953
68. Tabuchi A, Kamisaka S, Hoson T. (1997) Purification of xyloglucan hydrolase/endotransferase from cell walls of azuki bean epicotyls. Plant Cell Physiol. 38: 653–658.
69. Atkinson RG, Johnston SL, Yar-Khing Y, Sharma NN, Schroder R (2009) Analysis of xyloglucan endo-transglucosylase/hydrolase (XTH) gene families in kiwifruit and apple. Postharvest Biol Technol 51: 149–157.
70. Jan A, Yang G, Nakamura H, Ichikawa H, Kitano H, et al. (2001) Characterization of a xyloglucan endo-transglucosylase gene that is up-regulated by gibberellin in rice. Plant Physiol 136: 3670–81. PMID: 15516498
71. An P, Li X, Zheng Y, Matsuura A, Abe J, et al. (2014) Effects of NaCl on root growth and cell wall com-position of two soya bean cultivars with contrasting salt tolerance. J Agro Crop Sci 200: 212–218. 72. Han Y, Wang W, Sun J, Ding M, Zhao R, et al. (2013)Populus euphratica XTHoverexpression
en-hances salinity tolerance by the development of leaf succulence in transgenic tobacco plants. J Exp Bot 64: 4225–4238. doi:10.1093/jxb/ert229PMID:24085577