DNA Barcoding Reveals Two Distinct Groups
Bonnie L. Webster1*¤, Aiden M. Emery1, Joanne P. Webster2, Anouk Gouvras1, Amadou Garba3,
Oumar Diaw4, Mohmoudane M. Seye4, Louis Albert Tchuem Tchuente5,6, Christopher Simoonga7,
Joseph Mwanga8, Charles Lange9, Curtis Kariuki9, Khalfan A. Mohammed10, J. Russell Stothard11, David Rollinson1
1Wolfson Wellcome Biomedical Laboratories, Department of Zoology, Natural History Museum, London, United Kingdom, 2Department of Infectious Disease Epidemiology, Faculty of Medicine, Imperial College, St Mary’s Campus, London, United Kingdom,3Re´seau International Schistosomoses, Environnement, Ame´nagement et Lutte (RISEAL-Niger), Niamey, Niger,4Institut Se´ne´galais de Recherches Agricoles (ISRA), Bel Air, Dakar, Senegal,5Laboratoire de Parasitologie et Ecologie, Universite´ de Yaounde´ I, Yaounde´, Cameroon,6Center for Schistosomiasis and Parasitology, Yaounde´, Cameroon,7University of Zambia, Lusaka, Zambia,8National Institute for Medical Research, Mwanza, Tanzania,9Department of Invertebrate Zoology, National Museums of Kenya, Nairobi, Kenya,10Helminth Control Laboratory Unguja, Ministry of Health and Social Welfare, Zanzibar, Tanzania,11Disease Control Strategy Group, Liverpool School of Tropical Medicine, Liverpool, United Kingdom
Abstract
Background:Schistosomiasis in one of the most prevalent parasitic diseases, affecting millions of people and animals in developing countries. Amongst the human-infective species S. haematobium is one of the most widespread causing urogenital schistosomiasis, a major human health problem across Africa, however in terms of research this human pathogen has been severely neglected.
Methodology/Principal Findings:To elucidate the genetic diversity ofSchistosoma haematobium, a DNA ‘barcoding’ study was performed on parasite material collected from 41 localities representing 18 countries across Africa and the Indian Ocean Islands. Surprisingly low sequence variation was found within the mitochondrial cytochrome oxidase subunit I (cox1) and the NADH-dehydrogenase subunit 1 snad1). The 61 haplotypes found within 1978 individual samples split into two distinct groups; one (Group 1) that is predominately made up of parasites from the African mainland and the other (Group 2) that is made up of samples exclusively from the Indian Ocean Islands and the neighbouring African coastal regions. Within Group 1 there was a dominance of one particular haplotype (H1) representing 1574 (80%) of the samples analyzed. Population genetic diversity increased in samples collected from the East African coastal regions and the data suggest that there has been movement of parasites between these areas and the Indian Ocean Islands.
Conclusions/Significance: The high occurrence of the haplotype (H1) suggests that at some point in the recent
evolutionary history ofS. haematobiumin Africa the population may have passed through a genetic ‘bottleneck’ followed by a population expansion. This study provides novel and extremely interesting insights into the population genetics ofS. haematobium on a large geographic scale, which may have consequence for control and monitoring of urogenital schistosomiasis.
Citation:Webster BL, Emery AM, Webster JP, Gouvras A, Garba A, et al. (2012) Genetic Diversity withinSchistosoma haematobium: DNA Barcoding Reveals Two Distinct Groups. PLoS Negl Trop Dis 6(10): e1882. doi:10.1371/journal.pntd.0001882
Editor:Aaron R. Jex, University of Melbourne, Australia
ReceivedMay 11, 2012;AcceptedSeptember 12, 2012;PublishedOctober 25, 2012
Copyright:ß2012 Webster et al. This is an open-access article distributed under the terms of the Creative Commons Attribution License, which permits unrestricted use, distribution, and reproduction in any medium, provided the original author and source are credited.
Funding:This research was funded by an FP6 (European Community Framework Programme for Research, Technological Development and Demonstration) grant from the European Union. The programme was called CONTRAST (FP6 STREP contract no: 032203), http://www.eu-contrast.eu. This research was funded by the EU grant CONTRAST (FP6 STREP contract no: 032203), http://www.eu-contrast.eu. The authors were supported by The Schistosomiasis Consortium for Operational Research and Evaluation (SCORE) during the writing of the manuscript and from SCAN (http://www.nhm.ac.uk/research-curation/collections/curation-groups/scan/) for covering the publication costs, which is funded by the Wellcome Trust. The funders had no role in the study design, data collection and analysis, decision to publish, or preparation of the manuscript.
Competing Interests:The authors have declared that no competing interests exist.
* E-mail: [email protected]
¤ Current address: Department of Infectious Disease Epidemiology, Imperial College Faculty of Medicine, St Mary’s Campus, London, United Kingdom
Introduction
Schistosomiasis remains one of the world’s greatest neglected tropical diseases (NTD).Schistosoma haematobiumis one of the most widespread species ofSchistosomaand causes urogenital schistoso-miasis in humans. More people are infected with S. haematobium
than with all the other schistosome species combined. Of the.110 million cases ofS. haematobiuminfection in sub-Saharan Africa, 70
However, as the whole-genome sequence of S. haematobium has recently been published [5], further research into this most neglected of the NTDs, at least at the genomic level, may now be facilitated.
S. haematobiumhas a large geographical distribution being found throughout Africa, parts of the Middle East, Madagascar and the Indian Ocean Islands and is transmitted by various intermediate snail hosts within the genusBulinus[6]. As yet, the diversity ofS. haematobiumhas been the subject of very few molecular studies [7– 8], although one earlier study using enzyme analyses by isoelectric focusing in polyacrylamide gels to study 22 laboratory bred isolates of S. haematobium showed some regional variation and suggested mixing of parasite strains due to human population movements [9]. It remains imperative, however, that more investigations are conducted to elucidate the extent of genetic variation across the range of this parasite if we are to realistically understand its potential evolution, transmission and perhaps ultimate control.
Praziquantel (PZQ) remains the drug of choice for treatment of schistosomiasis and for the control of morbidity. It has a good safety and therapeutic record and is easy to administer (single oral dose), generally improving the health and well-being of schisto-some-infected people. National control programmes in several sub-Saharan countries aim to alleviate the burden of schistosomi-asis in highly endemic areas through large-scale administration of PZQ [10–13] and are likely to place strong and novel selective pressures on the parasites, which may be predicted to impact their population structure and genetics [14–16], [8].
In recent years, developments in molecular tools, and in particular advances in DNA sequencing, have allowed greater exploration and recording of the genetic diversity of schistosome species and their hosts thereof (e.g. [17–18], [16]). Sequence variation in the mitochondrial cytochrome oxidase sub-unit I (cox1) gene is commonly compared between sampled specimens to identify evolutionary differences, as well as, similarities. Such studies have benefited from knowledge of the complete mitochon-drial genome ofS. haematobium, as well as other schistosomes [19– 21], thereby enhancing population-focused studies [22], [17], [4]. DNA ‘barcoding’ of a large number of populations ofS. mansonito
date has revealed extensive population diversity with geographical structuring existing between populations [23–24]. A focused study on primarily laboratory passaged S. haematobium worms from Zanzibar also revealed substantial genetic diversity with the worms splitting into two distinct phylogenetic groups [25]. Taking a similar DNA ‘barcoding’ approach, the aim of this study was to document the genetic variation ofS. haematobiumfrom several areas geographically spread across Africa using historical collections of laboratory isolates but also mainly large collections of individual schistosome miracidia and cercariae sampled directly from their natural hosts, thereby avoiding the ethical and biological biases inherent within analyses of laboratory-passaged adult worms [18]. It was expected that the data would reveal any geographical structuring of the parasite populations and the extent of the genetic diversity within and between populations across Africa. Also, due to the wide geographic spread and extensive sampling of miracidia, primarily from infected school-aged children it was predicted that the same or more genetic diversity would be found within and between populations as that found in the study on Zanzibar [25]. By so doing the origin, evolution and spread ofS. haematobiumon the African mainland and the Indian Ocean Islands could be further elucidated.
Ethical statement
Ethical approval was obtained from Imperial College Research Ethics Committee (ICREC), Imperial College London in the UK, in combination with the ongoing Schistosomiasis Control Initiative (SCI) activities. In Senegal, ethical approval was obtained from the ethical committees of the Ministry of Health Dakar, Senegal. In Niger, ethical clearance was obtained from the Niger National Ethical Committee. In Cameroon, ethical approval was obtained from the Commite´ National d’Ethique´, Cameroon. In Kenya, ethical approval was obtained from the Ethical Review Board of National Museums of Kenya/Kenya Medical Research Institute. In Tanzania, ethical approval was obtained from the Ethical Review Board of National Institute of Medical Research (NIMR). In Zambia, ethical clearance was obtained from the University of Zambia ethics committee.
Before conducting the study, the MoH-approved plan of action had been presented and adopted by regional and local adminis-trative and health authorities. Meetings were held in each village to inform the village leader, heads of the families, local health authority, teachers, parents and children about the study, its purpose and to invite them to voluntarily participate. According to common practice and with approval from the Imperial College Research Ethics Committee (ICREC), due to low levels of literacy all village leaders, teachers, parents and study participants gave oral consent for the studies to take place. Informed consent for the urine examinations was obtained from each study participant and their parents or guardians. Oral consent for each participant was documented by inscription at school committees comprising of parents, teachers and community leaders. All the data were analyzed anonymously and all schistosomiasis positive participants were treated with PZQ (40 mg/kg). In schools or classes where the percentage of infections were more than 50%, mass treatment of all children was carried out at the end of the study.
The historical material stored in SCAN has been derived from UK laboratory passage of original specimens collected in collaboration with local authorities abiding by the ethical standards and collection requirements of the day and all specimens were maintained and analyzed anonymously.
Laboratory animal use was within a designated facility at the NHM regulated under the terms of the UK Animals (Scientific Procedures) Act, 1986, complying with all requirements therein,
Author Summary
including an internal ethical review process at the NHM and regular independent Home Office inspection. Work was carried out under the Home Office project license numbers 70/4687 (-2003), 70/5935 (2003–2008), 70/6834 (2008-).
Materials and Methods
Sample collections
As part of a European Commission Specific Research Project (CONTRAST) ‘A multidisciplinary alliance to optimize schisto-somiasis control and transmission surveillance in sub-Saharan Africa’, parasitological surveys were conducted at 13 localities in a total of seven countries across Africa between 2007–2010 (Table S1). Eggs were sampled directly from urine samples, either individually or pooled, of infected children. Eggs were concen-trated from each infected urine sample by sedimentation or filtration, then rinsed in saline before transfer into a clean Petri dish containing mineral water and exposed to light to facilitate hatching of miracidia. Using a binocular microscope, individual miracidia were then captured in 2–5ml of mineral water, pippetted onto Whatman FTA cards and allowed to dry for 1 hour [18].
Individual cercariae from naturally infected snails were also sampled from a few localities (Table S1). Snails collected from known transmission sites were placed individually or pooled into pots of fresh mineral water and exposed to light to stimulate cercarial shedding. On inspection, using a binocular microscope, visually identified schistosome cercariae were captured in 2–5ml of mineral water, pipetted onto Whatman FTA cards and allowed to dry for 1 hour.
Laboratory passaged adult worms from nine additional localities held in the Natural History Museum, London (NHM) liquid nitrogen schistosome repository, Schistosome Collections at the Natural History Museum (SCAN), were also utilised for molecular analysis (Table S1). A feature of the biology of schistosomes relevant to the use of laboratory passaged samples for molecular analysis is that there will be a high level of selection or genetic bottlenecks imposed on the population during the passaging process and so these samples cannot realistically be treated as individual samples nor used to represent the true within-locality variation from these particular isolates [18]. Nevertheless, we chose to include these additional archived adult worm samples to increase the geographic range and scope of the current study. Individual worms sampled from the same laboratory passaged isolate/NHM number were not treated as individuals, but the different haplotypes found were used as representative data from those localities.
DNA extraction and amplification
Whatman FTA stored samples. For genomic DNA (gDNA) extraction, a 2.0 mm disc containing the sample was removed from the card using a Harris-Micro-Punch (VWR, UK) and incubated for 5 mins in 200ml of FTA purification reagent (Whatman plc. Maidstone, Kent). The FTA purification reagent was removed and the disc was incubated for a further 5 mins in 200ml of fresh FTA purification reagent. This process was repeated for a total of 3 washes and was followed by 265 mins incubations in 200ml of TE buffer. Samples were air dried at 56uC for 10–30 mins and the disc was visually checked to make sure it was dry before being used directly in PCR reactions.
Worms held in liquid Nitrogen
Adult worms were thawed on ice and total gDNA was extracted from individual males and females Table S1, using the DNeasy
Blood and Tissue Kit (Qiagen Ltd, Crawley, UK) and eluted in 100ml of buffer giving a concentration of 3.6–31.5 ng/ml of gDNA from each worm, 2ml of which was used for PCR.
DNA amplification and sequencing
PCR of the partial region of the mitochondrial (mt) cytochrome oxidase (cox1) gene. For each individual worm,
miracidium or cercaria, 956 bp of the mtcox1 gene was amplified in separate 25ml PCR reactions using illustraTM puReTaq Ready-To-Go PCR Beads (GE Healthcare, UK) and 10 pmol of each primer (Forward primer: COX1_Schisto_59; Reverse primer; COX1_Schist_39 [26]. Thermal cycling was performed in a Perkin Elmer 9600 Thermal Cycler and the PCR conditions used were: 5 mins denaturing at 95uC: 40 cycles of 30 sec at 95uC, 30 sec at 40uC, 2 mins at 72uC; followed by final extension period of 7 mins at 72uC. Fourmls of each amplicon was visualised on a 0.8% gel-red agarose gel and positive PCR’s were purified using the QIAquick PCR purification Kit (Qiagen Ltd, UK) and then sequenced on an 3730XL 96 capillary automated sequencer (Applied Biosystems, UK) in both directions using 1.6 pmol dilutions of the original PCR primers and internal sequencing primers S.haem_cox1_F + S. haem_cox1_R [25] and an Applied Biosystems Big Dye Kit (V1.1).
PCR of the partial region of the mitochondrial (mt) NADH-dehydrogenase subunit 1 (nad1) gene. To provide
data from a different mt gene, the partial NADH-dehydrogenase subunit 1 (nad1) (756 bp) was amplified and sequenced as above using DNA available from several of the laboratory passaged samples (Table S1). The primers used were S.haem_nad1_F and
S.haem_nad1_R [25].
Data analysis
mt DNA sequence analysis. All sequences for the different (cox1 andnad1) datasets were assembled and manually edited using Sequencher V4.6 (http://genecodes.com) to remove any ambigu-ities between forward and reverse strands. For each sample consensus sequences were aligned in Sequencher and polymorphic positions observed between individuals were checked and confirmed by visualisation of the original sequence chromato-grams. The identity (species and gene) of the sequence was also confirmed using the Basic Local Alignment Search Tool (NCBI-Blast). Within each individual locality (see locality codes Table S1) consensus sequences from each individual sample were grouped and aligned in MacClade 4.05 and then collapsed together using Collapse V1.2 (http://darwin.uvigo.es/software/collapse.html) to identify individual samples with identical sequences. Each group of identical sequences and also any unique sequences became unique haplotypes for that site and consensus sequences were created and given a unique haplotype identifier code, consisting of the site code and a letter representing the different haplotypes within each locality. The numbers of individuals that presented each haplotype in each locality were also recorded.
Published mitochondrial data from other isolates of S. haematobium. Included in our analysis wasS. haematobium cox1 andnad1data available on the NCBI database (http://www.ncbi. nlm.nih.gov), which was downloaded and incorporated into the datasets from our collections (Table S1). The Zanzibar S. haematobiumdata from Webster et al. [25], was also included in the analysis.
collapse.html) to identify any identical haplotypes from different localities.
Haplotypes that were identical to the most common haplotype found across Africa (H1, Table S1) were noted. The sequence of this main (cox1 ornad1) haplotype (H1) was used in the analyses to represent all the individuals that it corresponded to, unless stated otherwise. Haplotype sequences were submitted to EMBL/ Genbank (Table S1).
To estimate genealogical relationships between haplotypes, the individual haplotype sequences were aligned in MacClade V4.05 and then a minimum spanning network was created in the programme TCS (http://darwin.uvigo.es/software/tcs.html).
cox1 phylogenetic analysis. All thecox1 haplotype
sequenc-es were aligned in MacClade V4.05 and exported into Mega V5 [27]. Evolutionary relationships between the haplotypes were inferred using the Neighbour-Joining, Maximum Parsimony and Minimum Evolution methods using the Kimura’s 2-parameter model (K2P) for pair-wise distance calculations. Analyses were subjected to 1000 bootstraps to test the reliability of branches of the trees. The topologies were rooted by the sister species
Schistosoma bovisfor which sequence data was obtained, using the methods described above, from a Senegal isolate that had been preserved in the NHM liquid nitrogen schistosome repository, SCAN. To test the topology of the tree further a Maximum Likelihood (ML) analysis with 500 replicates was also instigated in Mega V5 using the best fit ML model (HKY+G) which was calculated in Mega V5 and also by using the Akaike criterion in jModeltest V0.1.1 [28].
The net nucleotide divergence (Da) between the two main groups found in this analysis was calculated with the Juke-Cantor correction model in DnaSP V5.
cox1 population genetic analysis. To analyze the popula-tioncox1 diversity the sequences from each individual sample were aligned in MacClade 4.05 and exported into DnaSP V5 [29]. These were then used to calculate haplotype diversity (h) and nucleotide diversity (P), the latter of which was calculated with Juke-Cantor corrections, which was the most complex substitution model available. Overall diversity was measured together with the diversity within different geographic regions and also each locality (Tables 1 & 2). All individual miracidia and cercariae were treated as independent samples and their individual sequences were incorporated into the analysis. In contrast, for samples obtained from laboratory passage, and therefore probably highly clonal as discussed above, only individual worms with different sequences were used in the analyses. No laboratory passaged samples were included in the within-locality analysis (Table 2).
Tests of selection. In DnaSP V5 the McDonald_Kreitman test for selection and Tajima’s test of neutrality were conducted on our cox1 data to investigate if there was significant selection occurring.
nad1 phylogentic analysis. Nad1 data was only available from a subset of the samples from 18 different localities and only from laboratory passaged worms or previously published data. Therefore, these data were only analyzed at a basic phylogenetic level and not the population level. The nad1 haplotypes were aligned in MacClade V4.05 and exported into Mega V5 [25]. Evolutionary relationships between the haplotypes were inferred using the Neighbour-Joining method and 1000 bootstraps to test the reliability of branches of the trees. The topologies were rooted by the sister speciesS. bovisas described for thecox1 data.
Analysis of a nuclear marker
To compare variation found within the mtDNA with nuclear DNA, the complete ITS (1+2) rDNA (927 bp) was amplified from
a single male and a single female worm from all localities that had representative adult worms available (Table S1). This marker was amplified and sequenced with the forward and reverse primers ITS1+ ITS2 [30] using the PCR and sequencing conditions as used forcox1. In the analysis, publishedS. haematobium ITS data were also included from Senegal (FJ588861), Mali (Z21716) and Zanzibar (GU257398). Sequences were aligned and any nucleo-tide differences recorded.
Results
Sequence data
There were no differences between the ITS1+2 sequences from any of the samples. This nuclear marker therefore proved uninformative as a population genetic marker forS. haematobium.
In total 1978cox1 sequences were analyzed: 46 from cercariae, 241 from laboratory passaged adult worms (35 published haplotype sequences from previous studies of which 27 were from
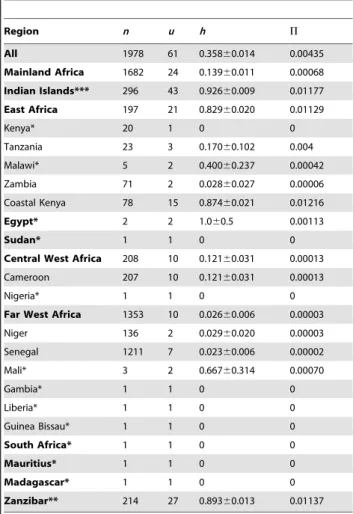
Table 1.Overall and regionalcox1 diversity.
Region n u h P
All 1978 61 0.35860.014 0.00435
Mainland Africa 1682 24 0.13960.011 0.00068
Indian Islands*** 296 43 0.92660.009 0.01177
East Africa 197 21 0.82960.020 0.01129
Kenya* 20 1 0 0
Tanzania 23 3 0.17060.102 0.004
Malawi* 5 2 0.40060.237 0.00042
Zambia 71 2 0.02860.027 0.00006
Coastal Kenya 78 15 0.87460.021 0.01216
Egypt* 2 2 1.060.5 0.00113
Sudan* 1 1 0 0
Central West Africa 208 10 0.12160.031 0.00013
Cameroon 207 10 0.12160.031 0.00013
Nigeria* 1 1 0 0
Far West Africa 1353 10 0.02660.006 0.00003
Niger 136 2 0.02960.020 0.00003
Senegal 1211 7 0.02360.006 0.00002
Mali* 3 2 0.66760.314 0.00070
Gambia* 1 1 0 0
Liberia* 1 1 0 0
Guinea Bissau* 1 1 0 0
South Africa* 1 1 0 0
Mauritius* 1 1 0 0
Madagascar* 1 1 0 0
Zanzibar** 214 27 0.89360.013 0.01137
n= number of samples sequenced;u= number of unique haplotypes found within the region;h= haplotype diversity6standard deviation;P= nucleotide diversity.
*samples form laboratory passaged or pooled larval stages. For these samples individual worms were not treated as individual samples but instead each different haplotype found was treated as an individual sample.
**For Zanzibar the whole data set of Webster et al. [25], was used and due to the high number of worms sampled and high diversity found, individual worms were treated as individual samples. This was also used in the analysis of the diversity overall and in the Indian Island region.
214 individual worms isolated from Zanzibar [25] and 1869 from miracidia collected directly from their human hosts. The cox1 region (956 bp) analyzed contained 70 variable sites (53 parsimony informative), and the diversity found within the S. haematobium
populations sampled was low with the sequences resolving into just 61 unique haplotypes. The percentage occurrence of each haplotype varied but there was a main common haplotype (H1) that was found across most of the localities and appeared frequently on mainland Africa, representing 1574 (80%) out of the 1978 overall sequences analyzed.
The minimum spanning TCS network (Figure 1) clearly shows the dominance of H1 and splits the haplotypes into two groups, one that is made up of 28 haplotypes from Zanzibar, Coastal Kenya, Tanzania, Mafia Island, Madagascar and Mauritius and one that is made up of 46 haplotypes from all localities sampled excluding Madagascar and Mauritius. The two groups could not be linked due to too many missing steps: the network for Group 1 is more basic with H1 being a dominant central point from which, many of the other haplotypes branch off by 1 single step (1 bp change). This closely linked network, linked by single bp changes,
is made of haplotypes predominantly found in mainland Africa (except Zambia) and a few haplotypes from Zanzibar. The majority of these single mutations do not form links with other haplotypes suggesting that they are random mutations that come and go but do not persist within the populations. Exceptions to this are the Egyptian haplotypes, which again branch off from the main haplotype H1 by one mutation and forms two haplotypes separated by a single bp change. The other more significant exceptions are longer branches forming more complicated networks with haplotypes from Zanzibar and its neighbouring regions Coastal Kenya and Mafia Island and also samples from Zambia. Both branches are again closely linked to H1 by single mutations with one branch also forming links with a Malawi haplotype and the other incorporates the haplotypes from Zambia. Group 2 forms a more complicated network between haplotypes and is more exclusive containing haplotypes from only the Indian Ocean Islands and the neighbouring East African regions of coastal Kenya and Tanzania.
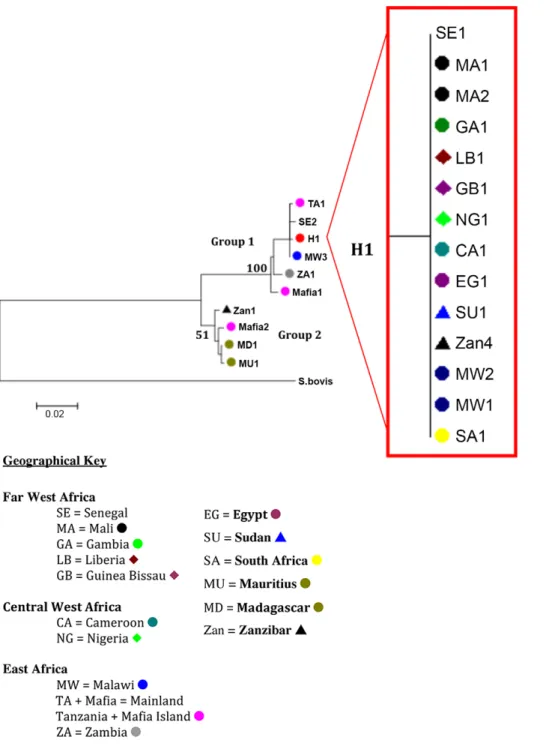
Phylogenetic structuring
As with the TCS analysis the same general splitting of the haplotypes was found with all phylogenetic methods separating the 61 haplotypes into two distinct well-supported groups (Figure 2) with H1 being central to the majority of the mainland African haplotypes. The details of all the samples that represent H1 can be seen in the sub tree in Figure 2. The tree topologies show the separation of samples from Coastal Kenya, Zanzibar, Mafia Island and Zambia from the main cluster in Group 1 and also the clear separation of Group 2 containing samples from the Indian Ocean Islands and its neighbouring African coastal regions.
The net divergence between the groups (0.0214560.00102) shows a relatively short time between the genetic separation of these two S. haematobium groups compared to that of the much larger divergence from their sister taxa S. bovis (Group 1: 0.1164460.01978, Group 2: 0.1093260.02365)
Population genetics
Measures of overall haplotype and nucleotide diversity, together with within region and locality diversity, are presented in Tables 1 and 2. Sample numbers will affect the diversity especially when very low levels of samples are used, however the data do show a clear difference in diversity between those localities where large numbers of individual larvae were sampled. The number of unique haplotypes found in the western regions of Africa compared to the east is extremely small even though sampling was biased towards the west and the diversity seen in the east comes mainly from the coastal Kenyan samples. There is also a vast contrast, with an extremely high diversity found within the populations sampled from the Indian Ocean Islands and the neighbouring coastal regions compared to the rest of Africa, where one dominant haplotype appears to persist throughout the mainland. We also tested for strong selection in our data and found no deviation from neutral expectations (pvalues were all. than 0.05).
nad1 S. haematobiumdata
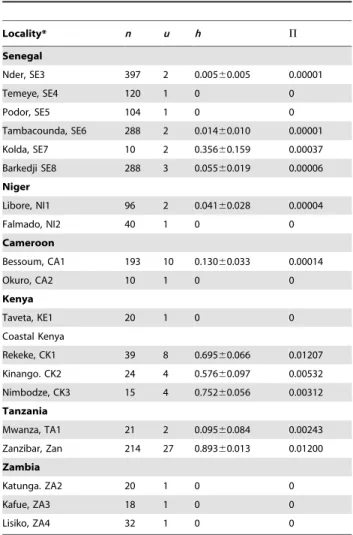
The nad1 haplotypes sequenced from several of the samples (Table S1) also supported the findings from thecox1 data (Figure 3). The haplotypes again split into two distinct groups; 1) dominated by a central haplotype found throughout mainland Africa and Zanzibar with a few closely linked haplotypes forming short branches and a longer branch to the Zambian haplotype and 2) containing haplotypes from Zanzibar, Madagascar and Mauritius. Table 2.Within localitycox1 diversity.
Locality* n u h P
Senegal
Nder, SE3 397 2 0.00560.005 0.00001
Temeye, SE4 120 1 0 0
Podor, SE5 104 1 0 0
Tambacounda, SE6 288 2 0.01460.010 0.00001
Kolda, SE7 10 2 0.35660.159 0.00037
Barkedji SE8 288 3 0.05560.019 0.00006
Niger
Libore, NI1 96 2 0.04160.028 0.00004
Falmado, NI2 40 1 0 0
Cameroon
Bessoum, CA1 193 10 0.13060.033 0.00014
Okuro, CA2 10 1 0 0
Kenya
Taveta, KE1 20 1 0 0
Coastal Kenya
Rekeke, CK1 39 8 0.69560.066 0.01207
Kinango. CK2 24 4 0.57660.097 0.00532
Nimbodze, CK3 15 4 0.75260.056 0.00312
Tanzania
Mwanza, TA1 21 2 0.09560.084 0.00243
Zanzibar, Zan 214 27 0.89360.013 0.01200
Zambia
Katunga. ZA2 20 1 0 0
Kafue, ZA3 18 1 0 0
Lisiko, ZA4 32 1 0 0
n= number of samples sequenced;u= number of unique haplotypes found within the region;h= haplotype diversity6standard deviation;P= nucleotide diversity.
*Only localities where miracidial populations were collected and the data from Zanzibar [25] were included.
The Genbank Accession numbers for thecox1 data are JQ397330–JQ397399 and for thenad1 data are JQ595387–595404 (see Table S1).
Discussion
DNA ‘barcoding’ approaches are now commonly used to provide insights into population structure and diversity within species including schistosomes. Studies onS. mansoni have shown high levels of mtDNA diversity within and between populations from endemic areas with haplotypes segregating by geography [23–24].
This study is the first time that DNAcox1‘barcoding’ has been used to elucidate the genetic diversity ofS. haematobiumpopulations across Africa and also from several of the Indian Ocean Islands (Zanzibar, Madagascar, Mauritius, Mafia). Ninety seven percent of the data generated came from larval stages sampled directly from their human hosts from across 20 localities, with the remainder of the data coming from historical collections based on laboratory-passaged worms. The study has revealed that the genetic diversity of S. haematobium across Africa is unexpectedly low. There were only 61 unique haplotypes found in the 1978 samples collected from 41 locations and 18 countries. The haplotypes split into two distinct groups; one that contains haplotypes predominately from mainland Africa with a few haplotypes from Zanzibar (Group 1) and the other that is made up of samples exclusively from the Indian Ocean islands and the neighbouring African coastal regions (Group 2). The net divergence between the two groups was considerable and was strongly supported by both the cox1 and the nad1 data. This is equivalent to the net divergence seen between some S. mansoni
groups spread across Africa, separated by thousands of miles [24]. The lack of the diversity found within and between the S. haematobiumsamples can clearly be seen in the TCS network and phylogenetic analyses with a single haplotype (H1 from 1574
samples) being dominant across Africa with greater diversity found within the samples from the Indian Ocean Islands and the neighbouring African coastal regions. The nuclear ITS data showed no diversity from any sample proving that this can not be used as a population genetic marker for this parasite [24] although such a nuclear marker is vital for the detection of interactions with closely related species and for confirming species identity [31].
The longer branches stemming from the main H1 haplotype in Group 1 on the TCS analysis show that the populations from coastal Kenya, Zambia and Mafia are quite separated from the main haplotype group. The highest diversity was found in theS. haematobiumpopulations from coastal Kenya and Zanzibar with complicated networks linking these haplotypes and several nodes not being represented by a haplotype. This suggests that haplotypes may have become extinct or that they have not been sampled indicating there may be more diversity still to be discovered in these areas. However, the basic network of single links around H1 suggests that further sampling in the other areas, reported on in this study, is unlikely to reveal further discrete groupings. With exceptions of haplotypes from the Indian Ocean Islands, Coastal Kenya and Zambia, the network clearly shows a lack of geographic structuring with the samecox1 haplotypes being found in Far West, Central West, East, South of Africa and also in Sudan, Egypt and Zanzibar.
The distribution of the haplotypes must reflect in part past movements of people. Group I and 2 parasites have been isolated from the same geographical regions and from the same host. For example, the haplotypes from Mwanza, Tanzania (TA1a + b), resolve into both network groups, one haplotype (TA1a) being identical to the H1 haplotype (Group 1) and one (TA1b) being identical to a haplotype found on Mafia Island and sitting at the
Figure 1. Minimum spanning TCS networks incorporating all thecox1 haplotypes analyzed in this study.Each line between haplotypes represents a single bp change and small circles between lines represent unsampled or extinct haplotypes. The network forms 2 distinct groups of haplotypes that cannot be linked. Group 1 is a simple network containing the main land African samples and a few of the Indian Ocean Island samples. The majority of the samples are closely clustered around the main haplotype (H1) by separate single links representing a single polymorphic position. There are 2 longer branches, ‘‘blue star’’, leading off from the main cluster to form networks between Zanzibar, Coastal Kenya, Tanzania (+Mafia) and Zambian samples. H1 represents samples from 29 out of the 43 separate localities and represents 1574 out of the 1978 sequences analyzed (see figure 2 for the list of haplotype codes that represent H1). Group 2 forms a more complicated network containing the majority of the samples from the Indian Ocean Islands and samples from the closely located areas of Coastal Kenya and Tanzania. Identical haplotypes are grouped in the same oval.
end of a long branch within Group 2. This suggests that in this geographic region as well as the main dominant S. haematobium
genotype there has also been transfer of Group 2 schistosomes from the Indian Ocean Islands and the neighbouring coastal regions probably associated with the movements of people [32]. Similarly, the positioning of the Mafia haplotypes (Mafia1+2) in the two groups shows the close affinity of this population withS.
haematobiumfrom Zanzibar. This is not unexpected due to infected children from Mafia having a travel history to the Zanzibar mainland and that urogenital schistosomiasis is suggested to be imported and not endemic on Mafia.
The higher diversity found in the coastal Kenyan populations (15 haplotypes), the close clustering with the Zanzibar haplotypes and the separation of these populations into the two groups also
Figure 2. Neighbour-joiningcox1 tree topology.Nodal supports for the 2 groups are marked and details of the samples representing H1, ‘‘red dot’’, are shown in the sub tree. Each terminal branch is labelled with the individual haplotype codes as detailed in Table S1.
doi:10.1371/journal.pntd.0001882.g002
Figure 3. Neighbour-joiningnad1 tree topology supporting the topology of thecox1 tree.Nodal supports for the 2 groups are marked and details of the samples representing H1, ‘‘red dot’’, are shown in the sub tree. Each terminal branch is labelled with the individual haplotype codes as detailed in Table S1.
suggests a close association between parasites from coastal Kenya and Zanzibar. There is probably mixing and movements of the populations between coastal Kenya and Zanzibar and vice versa with the movements of people between these areas due to the trade routes between the Indian Ocean islands and the neighbouring East African coastal regions [32]. The positioning of the haplotypes from Madagascar and Mauritius in Group 2 further supports the uniqueness of the haplotypes from the Indian Ocean Islands and neighbouring East African coastal regions compared to those from mainland Africa. The recognition and distribution of Group 2 schistosomes suggests movement of S. haematobium
populations from endemic adjacent regions such as Madagascar and the Arabian Peninsula. There is a history of prolific trade links between the Arabian Peninsula, India, the Indian Ocean Islands and the East coast of Africa aided by the Monsoon trade winds, which probably would have facilitated the movements of people and their parasites between these areas.
In consideration of general population genetic theories, the extremely low levels of genetic diversity between theS. haematobium
populations separated by 1000’s of miles across continental Africa compared to the high diversity found within the populations from the more isolated Indian Ocean Islands and their closely neighbouring African coastal regions is unexpected. It is partic-ularly striking that the dominant haplotype H1 occurs across Africa with 1574 samples analyzed not showing a single nucleotide mutation in the mtDNA analyzed. The success of this haplotype might be attributed to a founder effect following a population ‘bottleneck’ with only a few individual parasites surviving and participating in a later population expansion. The lack of diversity found across Africa and the restriction of the Group 2 haplotypes to coastal regions of East Africa and the Indian Ocean Islands suggests that this may have happened relatively recently in terms of the evolutionary history of these parasites. Given the close phylogenetic relationship of the Indian/Asian and African
Schistosoma species [33–34] it is possible that the lack of genetic diversity found within and between theS. haematobiumpopulations across mainland Africa is attributed to a re-invasion by a small number of individuals ofS. haematobiuminto Africa from a larger population in Asia across the Arabian peninsula, with a subsequent rapid spread and population expansion across Africa from East to West. The new small re-established population in Africa would be more sensitive to genetic drift and increased inbreeding resulting in low genetic variation. Due to the lack of fossil records it is extremely difficult to accurately define the evolutionary history and phylogeography of theSchistosomagenus [24], [34–35] however, data such as that reported here do provide new insights into how these parasites evolved and spread and c learly it will be of interest to barcode samples from the Arabian Peninsula.
One factor that could have influenced the divergence of our populations into the two groups relates to compatibility with intermediate snails hosts. Intermediate host use ofS. haematobiumis very specific and varies in different geographical locations [6]. However, based on current day snail distributions there is no obvious correlation between intermediate host use and the observed parasite diversity.S. haematobiumin East Africa and the Indian Ocean Islands is mainly transmitted byBulinus africanusand
B. forskaliigroup species while elsewhere the same species groups can be involved but snails of theB. truncatus tropicuscomplex may also play an important role in transmission. However, the study by [36] did show that the intermediate snail host,B. globosus, separates into distinct West and East African clades on a molecular phylogenetic tree, possibly suggesting that the distribution of East AfricanB. globosuscould be a limiting factor in the spread of Group
2 type parasites. It is clear that more studies are needed to investigate the role of the different snail species and geographical populations ofBulinusin the transmission of Group 1 and Group 2 type parasites. As well as intermediate snail host compatibility it will be important to determine whether the different groups give rise to infections which result in different pathologies or which respond differently to treatments as genetic diversity has been noted to possibly have an effect on such characteristics [37].
Though the small regions of nuclear DNA analyzed in this study proved highly conserved, it is likely that there could be more diversity found in other regions of the nuclear genome, which may or may not correlate to that found in the mt DNA. A recent study [8], using a small number of microsatellite markers did find diversity in S. haematobium miracidial populations from Mali conflicting the data presented here, however only laboratory maintained material from Mali was analysed in the present study and so a direct comparison cannot be made. Due to the difficulties in directly sampling natural schistosome populations there exists a strong sampling bias within this study with the majority of the data obtained from large larval schistosome populations collected from 6 countries. The other countries are represented by far fewer or laboratory maintained samples and whilst providing useful genetic data it cannot be concluded that they are representative of the true genetic diversity in these countries. More samples need to be analyzed from more areas and with more genetic markers to further elucidate the genetic diversity ofS. haematobiumpopulations from all it’s endemic areas. It would also be beneficial to analyze both nuclear and mt DNA simultaneously from the same individual sample in future population genetic studies and the recent publication of whole-genome sequence of an Egyptian isolate ofS. haematobium[5] will facilitate the development of many more nuclear markers for population genetic analyses at the genomic level.
The genetic diversity of schistosome populations can be influenced by a variety of factors such as; host water-contact patterns, host immunity and susceptibility and moreover, mass chemotherapy has a great potential to promote selection. [15], [8]. The impact of the large-scale administration of PZQ, through national control programmes [11–12] on the genetic selection of bothS. mansoniandS. haematobiumis an area of high interest with respect to the development of drug resistance [38–40], [14–15], [41]. A high population diversity would be expected to provide a wide genetic base for selection to act upon possibly increasing the rate of resistance to treatment developing, ultimately resulting in a decline in diversity over time to a few, non susceptible genotypes [42]. The relatively low level of diversity within S. haematobium
across most of mainland Africa, as defined by the current genetic markers, may indicate that these parasites may be less likely to change under drug pressure, however the high genetic diversity found on Zanzibar and the neighbouring African coastal region could offer a genetic base for the development of PZQ resistance and hence changes in parasite diversity in relation to chemother-apy needs to be monitored in these highly diverse areas.
mtDNA diversity described here, together with other molecular markers, will be of value to monitor the impact of control interventions on differentS. haematobiumgenotypes and may assist in understanding the introduction or re-introduction of parasites associated with human population movements.
Supporting Information
Table S1 Sample and haplotype information (Support-ing Table).
(DOC)
Acknowledgments
The authors would like to thank everyone that was involved in any of the field and NHM SCAN collections and the people that provided samples. Mike Anderson and Jayne King for maintaining the laboratory passages and to Claire Griffiths and Julia Llewellyn-Hughes in the NHM sequencing facility. Fiona Allen for information about the isolates from SCAN (http:// www.nhm.ac.uk/research-curation/collections/curation-groups/scan/).
Author Contributions
Conceived and designed the experiments: BLW DR. Performed the experiments: BLW. Analyzed the data: BLW. Contributed reagents/ materials/analysis tools: BLW AME JPW A. Gouvras A. Garba OD MMS LATT CS JM CL CK KAM JRS DR. Wrote the paper: BLW JPW DR.
References
1. King CH, Dickman K, Tisch DJ (2005) Reassessment of the cost of chronic helmintic infection: A meta-analysis of disability-related outcomes in endemic schistosomiasis. Lancet 365: 1561–1569.
2. van der Werf M J, Bosompem KM, de Vlas SJ (2003) Schistosomiasis control in Ghana: Case management and means for diagnosis and treatment within the health system. Trans R Soc Trop Med Hyg 97: 146–152.
3. Shiff C, Veltri R, Naples J, Quartey J, Otchere J, et al. (2006) Ultrasound verification of bladder damage is associated with known biomarkers of bladder cancer in adults chronically infected withSchistosoma haematobiumin Ghana. Trans R Soc Trop Med Hyg 100: 847–854.
4. Rollinson D (2009) A wake up call for urinary schistosomiasis: reconciling research effort and public health importance. Parasitology 136: 1593–1610. 5. Young ND, Jex AR, Li B, Liu S, Yang L, et al. (2012) Whole-genome sequence
ofSchistosoma haematobium. Nature Gen 44: 221–225.
6. Rollinson D, Stothard JR, Southgate VR (2001) Interactions between intermediate snail hosts of the genusBulinusand schistosomes of theSchistosoma haematobiumgroup. Parasitology 123: 245–260.
7. Brouwer KC, Ndhlovu PD, Wagatsuma Y, Munatsi A, Shiff CJ (2003) Urinary tract pathology attributed toSchistosoma haematobium: does parasite genetics play a role? Am J Trop Med Hyg 68: 456–462.
8. Gower CM, Gabrielli AF. Sacko M, Dembele´ R, Golan R, et al. (2011) Population genetics ofSchistosoma haematobium: development of novel microsat-ellite markers and their application to schistosomiasis control in Mali. Parasitology 138: 978–994.
9. Wright CA, Ross GC (1983) Enzymes inSchistosoma haematobium. Bull WHO 61: 307–316.
10. WHO Geneva, 1–45 WHO (2002) Prevention and control of schistosomiasis and soil-transmitted helminthiasis: report of a WHO expert committee. WHO Tech Rep Ser 912: 1–57.
11. Fenwick A, Webster JP, Bosque-Oliva E, Blair L, Fleming FM, et al. (2009) The Schistosomiasis Control Initiative (SCI): rationale, development and implemen-tation from 2002–2008. Parasitology 136: 1719–1730.
12. Stothard JR, French MD, Khamis IS, Basanez MG, Rollinson D (2009) The epidemiology and control of urinary schistosomiasis and soil-transmitted helminthiasis in schoolchildren on Unguja Island, Zanzibar. Trans R Soc Trop Med Hyg 103: 1031–1044.
13. Savioli L, Gabrielli AF, Montresor A, Chitsulo L, Engels D (2009) Schistosomiasis control in Africa: 8 years after World Health Assembly Resolution 54.19. Parasitology 136: 1677–1681.
14. Webster JP, Gower CM, Norton AJ (2008) Evolutionary concepts in predicting and evaluating the impact of mass-chemotherapy schistosomiasis control programmes on parasites and their hosts. Evol Apps 1: 66–83.
15. Norton AJ, Gower CM, Lamberton PHL, Webster BL, Lwambo NJS, et al. (2010) Genetic consequences of mass human chemotherapy for Schistosoma mansoni: population structure pre- and post-praziquantel treatment in Tanzania. Am J Trop Med Hyg 83: 951–957.
16. Rollinson D, Webster JP, Webster BL, Nyakaana S, Jørgensen A, et al. (2009) Genetic diversity of schistosomes and snails: implications for control. Parasitology 136: 1801–11.
17. Morgan JAT, DeJong RJ, Kazibwe F, Mkoji GM, Loker ES, et al. (2003) A newly-identified lineage ofSchistosoma. Int J Parasitol 33: 977–985.
18. Gower CM, Shrivastava J, Lamberton PHL, Rollinson D, Webster BL, et al. (2007) Development and application of an ethically and epidemiologically advantageous assay for the muti-locus microsatellite analysis of Schistosoma mansoni. Parasitology 134: 523–536.
19. Le TH, Blair D, McManus DP (2000) Mitochondrial genomes of human helminths and their use as markers in population genetics and phylogeny. Acta Trop 77: 243–256.
20. Littlewood DTJ, Lockyer AE, Webster BL, Johnston DA, Le TH, et al. (2006) The complete mitochondrial genomes ofSchistosoma haematobiumandSchistosoma spindaleand the evolutionary history of mitochondrial genome changes among parasitic flatworms. Mol Phylogenet Evol 39: 452–467.
21. Zarowiecki M, Huyse T, Littlewood DT (2007) Making the most of mitochondrial genomes - markers for phylogeny, molecular ecology and barcodes inSchistosoma (Platyhelminthes: Digenea). Int J Parasitol 37: 1401–1418.
22. Blair D, Le TH, Despre´s L, McManus DP (1999) Mitochondrial genes of Schistosoma mansoni. Parasitology 119: 303–313.
23. Standley CJ, Kabatereine NB, Lange CN, Lwambo NJS, Stothard JR (2010) Molecular epidemiology and phylogeography ofSchistosoma mansoniaround Lake Victoria. Parasitology 137: 1937–49.
24. Morgan JA, Dejong RJ, Adeoye GO, Ansa ED, Barbosa CS, et al. (2005) Origin and diversification of the human parasiteSchistosoma mansoni. Mol Ecol 14: 3889– 3902.
25. Webster BL, Culverwell CL, Khamis IS, Mohammed KA, Rollinson D, et al. (2012) DNA barcoding ofSchistosoma haematobiumon Zanzibar reveals substantial genetic diversity and two major phylogenetic groups. Acta Trop. http://dx.doi. org/10.1016/j.actatropica.2012.06.002.
26. Lockyer AE, Olson PD, Ostergaard P, Rollinson D, Johnston DA, et al. (2003) The phylogeny of the Schistosomatidae based on three genes with emphasis on the interrelationships of Schistosoma Weinland, 1858. Parasitology 126: 203–224. 27. Tamura K, Peterson D, Peterson N, Stecher G, Nei M, Kumar S (2011)
MEGA5: Molecular Evolutionary Genetics Analysis using maximum likelihood, evolutionary distance, and maximum parsimony methods. Mol Biol Evol 28: 2731–2739.
28. Posada D (2008) jModelTest: Phylogenetic Model Averaging. Mol Biol Evol 25: 1253–1256.
29. Librado P, Rozas J (2009) DnaSP v5: A software for comprehensive analysis of DNA polymorphism data. Bioinformatics 25: 1451–1452.
30. Kane RA, Rollinson D (1994) Repetitive sequences in the ribosomal DNA internal transcribed spacer ofSchistosoma haematobium,Schistosoma intercalatumand Schistosoma mattheii. Mol Biochem Parasitol 63: 153–156.
31. Webster BL (2009) Isolation and preservation of schistosome eggs and larvae in RNAlaterHfacilitates genetic profiling of individuals. Parasites and Vectors 2: 50.
32. Gilbert E (2002) Coastal East Africa and the Western Indian Ocean: Long-Distance Trade, Empire, Migration, and Regional Unity, 1750–1970. The History Teacher 36.1. Available: http://www.historycooperative.org/journals/ ht/36.1/gilbert.html. Accessed 2012 May 9.
33. Webster BL, Southgate VR, Littlewood DTL (2006) A revision of the interrelationships of Schistosoma including the recently described Schistosoma guineensis. Int J Parasitol 36: 947–955.
34. Webster BL, Littlewood DTL (2012) Mitochondrial gene order inSchistosoma (Platyhelminthes: Digenea: Schistosomatidae). Int J Parasitol 42: 313–321. 35. Lawton SP, Hirai H, Ironside JE, Johnston DA, Rollinson D (2011) Genomes
and geography: genomic insights into the evolution and phylogeography of the genusSchistosoma. Parasites and Vectors 4: 131.
36. Kane RA, Stothard JR, Emery AM, Rollinson D (2008) Molecular characterization of freshwater snails in the genusBulinus: a role for barcodes? Parasites and Vectors 1: 15.
37. Karvonen A, Rellstab C, Louhi KR, Jokela J (2011) Synchronous attack is advantageous: mixed genotype infections lead to higher infection success in trematode parasites. Proc R Soc B 279: 171–176.
38. Fallon PG, Doenhoff MJ (1994) Drug-resistant schistosomiasis: resistance to praziquantel and oxamniquine induced inSchistosoma mansoniin mice is drug specific. Am J Trop Med Hyg 51: 83–88.
39. Ismail M, Botros S, Metwally A, William S, Farghally A, et al. (1999) Resistance to praziquantel: direct evidence fromSchistosoma mansoniisolated from Egyptian villagers. Am J Trop Med Hy 60: 932–935.
40. Fenwick A, Webster JP (2006) Schistosomiasis: challenges for control, treatment and drug resistance. Curr Opin Infect Dis 19: 577–582.
41. Lamberton PHL, Hogan SC, Katbatereine NB, Fenwick A, Webster JP (2010) In vitro praziquantel test capable of detecting reduced in vivo efficacy in Schistosoma mansonihuman infections. Am J Trop Med Hyg 83: 1340–1347. 42. Feng Z, Curtis J, Minchella DJ (2001) The influence of drug treatment on the