DOI: http://dx.doi.org/10.5007/1980-0037.2014v16n6p680
original article
Licence Creative Commom
CC
RBCDH
¹State University of Paraíba. Graduate Program in Public Health. Campina Grande, PB. Brazil.
Received: 25 October 2013 Accepted: 02 January 2014
Prevalence of pain and its association
with transportation of school supplies in
university students
Prevalência de dor associada ao transporte de material
escolar
Windsor Ramos da Silva Júnior1 Alessandro Leite Cavalcanti1
Abstract – he aim of this study was to determine the prevalence of pain and its asso-ciation with the transportation of school supplies among university students. It was a cross-sectional study with 373 university students between February and September 2012 in which sociodemographic and academic data, as well as those regarding the transporta-tion of school supplies and the presence of pain were collected through a semi-structured interview. Further analysis of anthropometric data was conducted and the volumes trans-ported were weighted. Data were analyzed using the SPSS 17.0®sotware using the model of Hierarchical Binary Logistic Regression, Backward LR method, in which the power of inluence of predictor variables was tested in the presence of musculoskeletal pain. Prevalence of pain of 82.8%, with overall average of 5.21 points on the Visual Analogue Scale (VAS) for pain assessment was found. Among women, the inluence of the relative weight of volumes on the presence of pain was 45.1% higher than among men (PR = 0.689, CI 95% = 0.503 to 0.942) for each 1% increment. he transport time, in turn, increased by 22.9% the likelihood of occurrence of pain, every 15 minutes (PR = 1.229, CI 95% = 1.090 to 1.386). A high prevalence of pain related to the transportation of school supplies was observed, as well as the inluence of predictor variables such as relative weight and transport time, especially in females.
Key words: Low Back Pain; Musculoskeletal Pain; Public Health; Weight-Bearing.
he scientiic literature shows that the occurrence of pain and postural
problems is highly prevalent among the adult population1–3, with a high
frequency also in childhood and adolescence4–6. he existence of
muscu-loskeletal pain in two or more anatomical areas is very common in young students7.
Low back pain is the second most frequent cause of visits to doctors,
preceded only by issues related to respiratory distress8. However, the
etiology of the majority of these backaches (85% to 88%) in adults has
never been identiied8. Moreover, much of studies related to idiopathic
low back pain are focused on the adult population, which leads to a lack of understanding about the causes and beginning of this condition among adolescents and children9, although the incidence rates of low back pain in
adults are similar to those in adolescents and children10.
he incidence of low back pain in adolescents tends to increase during
high school and may be associated with work or transporting loads10–12.
According to the U.S. National College Health Assessment, the incidence of low back pain in young adults increased from 44.2% to 47.7% between
2003 and 200713. Furthermore, there was an increased incidence of low
back pain among adults who had had back pain during adolescence14,15.
Low back pain and postural problems among young people can have many causes, among them the use of heavy backpacks and their
asym-metrical transportation16.Over 92% of children in the United States carry
backpacks that represent 10% to 22% of their body weight17,18previous
studies have suggested that it may be an important and increasing problem in this age-group. he aim of this study was to determine the prevalence and important symptom characteristics of low back pain such as duration, periodicity, intensity, disability and health seeking behaviour at young ages. A population-based cross-sectional study was conducted including 1446 children aged 11-14 years in the North-West of England. A self-complete questionnaire was used to assess low back pain prevalence, symptom characteristics, associated disability and health seeking behaviour. An additional self-complete questionnaire amongst parents sought to validate pain reporting. he 1-month period prevalence of low back pain was 24%. It was higher in girls than boys (29 vs. 19%; 2=14.7, P<0.001. About 37% of children aged 11-14 years reported pain, with most attributing their occurrence to the use of backpack19. Another study in children20,21 with
incremental loads of 10%, 20% and 30% of their body weight revealed that these loads generate very high contact pressure under backpack straps and signiicant back pain.
Prevalence of pain in university students Silva & Cavalcanti
METHODOLOGICAL PROCEDURES
Cross-sectional study conducted with university students duly enrolled in courses at the Center of Biological and Health Sciences at campus I, State University of Paraíba.
From a universe of 2,465 students, 399 individuals comprised the sample, which were randomly selected by stratified sampling with proportional size to each stratum, adopting conidence level of 95% (Z = 1.96); margin of error of 5% and pain prevalence of 50.0%. Sample size calculation was performed using the Epi Info sotware 7.1.2 and individuals were randomly selected in each stratum. Twenty-six students were excluded from the study for refusing to participate or were not located ater three attempts or because they would bear any kind of disability.
Semi-structured interviews to collect sociodemographic data and those on the transportation of school supplies and presence of pain, measured
by the Visual Analogue Scale (VAS) for pain measurement, were applied22.
Anthropometric data (height and weight) were collected and all volumes transported by the individual were weighted using WISO stadiometer (Sports Technology®, Criciúma, SC, Brazil) and Tanita digital scale® HD313
(Corporation of America, Inc., Illinois, USA) with a 150kg capacity and accuracy of 100g.
Data were tabulated and descriptively and inferentially analyzed using
SPSS sotware 17.0®. Descriptive analysis was used to calculate means and
standard deviations. A model of Hierarchical Binary Logistic Regression through Backward LR method for inferential analysis was used, in which the power of inluence of predictor variables – divided into blocks – was tested according to the occurrence of the response variable: presence of musculoskeletal pain. he signiicance level was set at 5%.
Predicting aspects related to individuals (sex, age, weight, BMI and presence of diagnosed orthopedic condition) composed block 1. Aspects related to the load (amount of transported volumes, total load mass, relative load mass and carrying time) composed block 2. Interactions between carrier and load (sex x total load mass; sex x relative load mass and sex x carrying time) composed block 3, with the predictive power of each variable expressed by the odds ratio.
his study was registered at the National Information System on Ethics in Research Involving Humans (SISNEP) and approved by the Ethics Committee of the State University of Paraíba (CAAE No. 0402.0.133.000-11).
RESULTS
volume of school supplies, but only 1.6% carried up to three volumes, with a ratio of 1.44 volumes of material per student. he average total load mass per individual was 3.04 kg (± 1.62 kg) corresponding to 4.9% (± 2.9%) of the student’s weight. he most frequent carrying time was 30 minutes (20.1%) and the most used type of material was the two-strap backpack (52.2%); however, students carried their backpacks mainly over the right shoulder (26, 4%). Another aspect is the percentage of transportation on the let shoulder (13.8%), totaling 40.2% of unilateral transport carried over one shoulder (Table 1).
Table 1. Data related to the presence of pain during the transportation of school supplies, amount of tender points and if there is an attempt to ease the pain by decreasing the volume or even not transporting it.
Biology EducationPhysical Nursing Pharmacy Physical Therapy Odontology Psycology TOTAL
n (%) n (%) n (%) n (%) n (%) n (%) n (%) n (%)
Sample stratiied by course
92 (24.7) 59 (15.8) 55 (14.7) 42 (11.3) 44 (11.8) 38 (10.2) 43 (11.5) 373 (100.0)
Presence of pain related to the transportation of school supplies
Yes 77 (83.7) 44 (74.6) 49 (89.1) 34 (81.0) 36 (81.8) 28 (73.7) 41 (95.3) 309 (82.8)
No 15 (16.3) 15 (25.4) 6 (10.9) 8 (19.0) 8 (18.2) 10 (26.3) 2 (4.7) 64 (17.2)
Average number of tender points (± SD)
3.23 (± 2.5) 2.14 (± 1.8) 3.02 (± 2.1) 3.12 (± 2.7) 2.55 (± 2.3) 3.16 (± 3.6) 3.77 (± 2.6) 3.00 (± 0.5)
Maximum number of tender points
13 7 9 9 11 18 11
Decrease in material weight due to pain
Yes 50 (27.3) 19 (10.4) 27 (14.7) 24 (13.1) 20 (10.9) 12 (6.6) 31 (16.9) 183 (49.0)
No 27 (21.4) 25 (19.8) 22 (17.5) 10 (7.9) 16 (12.7) 16 (12.7) 10 (7.9) 126 (33.8)
No material transport due to pain
Yes 20 (20.8) 10 (10.4) 15 (15.6) 15 (15.6) 12 (12.5) 14 (14.6) 10 (10.4) 96 (25.7)
No 57 (26.8) 34 (16.0) 34 (16.0) 19 (8.9) 24 (11.3) 14 (6.6) 31 (14.5) 213 (57.1)
SD - Standard Deviation
Regarding the presence of pain, 82.8% of individuals reported pain at some point during the transportation of school supplies. he most frequently reported painful points were right (37.5%) and let shoulder (33.5%) and lower back (29.7%). In addition, 49% of individuals reported that they had tried to reduce the weight of their school supplies due to pain with the intention to minimize it, and 25.7% decided not to carry the school supplies for the same reason (Tables 1 and 2).
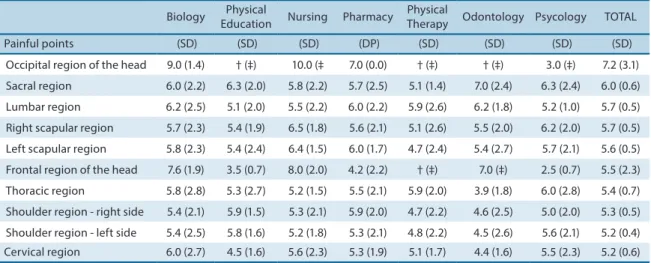
By Visual Analogue Scale (VAS) overall pain, on average, was 5.21 points on a 0-10 point scale, showing pain in lumbar (5.73); sacral (6:02) and cervical regions (5.20) (Table 3).
When testing the predictive power of variables on the occurrence
of pain, it was observed that individuals on block 1 had χ2value =16.337;
p<0.001, indicating that the set of input variables had a predictive power on the response variable, which was signiicantly greater than mere chance.
Prevalence of pain in university students Silva & Cavalcanti
Table 2. Sample distribution according to the location of tender points and to the course.
Biology EducationPhysical Nursing Pharmacy TherapyPhysical Odontology Psycology TOTAL
Most mentioned painful points n (%) n (%) n (%) n (%) n (%) n (%) n (%) n (%)
Shoulder region - right side 33 (23.6) 15 (10.7) 22 (15.7) 18 (12.9) 13 (9.3) 18 (12.9) 21 (15.0) 140(37.5)
Shoulder region - left side 29 (23.2) 17 (13.6) 23 (18.4) 14 (11.2) 14 (11.2) 14 (11.2) 14 (11.2) 125(33.5)
Lumbar region 32 (28.8) 17 (15.3) 15 (13.5) 13 (11.7) 11 (9.9) 11 (9.9) 12 (10.8) 111(29.8)
Right scapular region 28 (26.4) 13 (12.3) 13 (12.3) 14 (13.2) 13 (12.3) 11 (10.4) 14 (13.2) 106(28.4)
Cervical region 26 (26.8) 10 (10.3) 12 (12.4) 9 (9.3) 14 (14.4) 8 (8.2) 18 (18.6) 97 (26.0)
Left scapular region 21 (25.3) 11 (13.2) 14 (16.9) 9 (10.8) 11 (13.2) 8 (9.6) 9 (10.8) 83(22.2)
Thoracic region 21 (26.6) 6 (7.6) 16 (20.2) 10 (12.7) 7 (8.9) 7 (8.9) 12 (15.2) 79(21.2)
Sacral region 19 (24.7) 11 (14.3) 9 (11.7) 9 (11.7) 8 (10.3) 7 (9.1) 14 (18.2) 77 (20.6)
Right wrist region 9 (25.7) 5 (14.3) 4 (11.4) 3 (8.6) 4 (11.4) 2 (5.7) 8 (22.9) 35(9.4)
Right elbow region 5 (14.7) 0 (0.0) 10 (29.4) 8 (23.5) 2 (5.9) 5 (14.7) 4 (11.8) 34(9.1)
Table 3. Average pain measured by the Visual Analogue Scale (VAS) for painful points according to university course.
Biology EducationPhysical Nursing Pharmacy Physical Therapy Odontology Psycology TOTAL
Painful points (SD) (SD) (SD) (DP) (SD) (SD) (SD) (SD)
Occipital region of the head 9.0 (1.4) † (‡) 10.0 (‡ 7.0 (0.0) † (‡) † (‡) 3.0 (‡) 7.2 (3.1)
Sacral region 6.0 (2.2) 6.3 (2.0) 5.8 (2.2) 5.7 (2.5) 5.1 (1.4) 7.0 (2.4) 6.3 (2.4) 6.0 (0.6)
Lumbar region 6.2 (2.5) 5.1 (2.0) 5.5 (2.2) 6.0 (2.2) 5.9 (2.6) 6.2 (1.8) 5.2 (1.0) 5.7 (0.5)
Right scapular region 5.7 (2.3) 5.4 (1.9) 6.5 (1.8) 5.6 (2.1) 5.1 (2.6) 5.5 (2.0) 6.2 (2.0) 5.7 (0.5)
Left scapular region 5.8 (2.3) 5.4 (2.4) 6.4 (1.5) 6.0 (1.7) 4.7 (2.4) 5.4 (2.7) 5.7 (2.1) 5.6 (0.5)
Frontal region of the head 7.6 (1.9) 3.5 (0.7) 8.0 (2.0) 4.2 (2.2) † (‡) 7.0 (‡) 2.5 (0.7) 5.5 (2.3)
Thoracic region 5.8 (2.8) 5.3 (2.7) 5.2 (1.5) 5.5 (2.1) 5.9 (2.0) 3.9 (1.8) 6.0 (2.8) 5.4 (0.7)
Shoulder region - right side 5.4 (2.1) 5.9 (1.5) 5.3 (2.1) 5.9 (2.0) 4.7 (2.2) 4.6 (2.5) 5.0 (2.0) 5.3 (0.5)
Shoulder region - left side 5.4 (2.5) 5.8 (1.6) 5.2 (1.8) 5.3 (2.1) 4.8 (2.2) 4.5 (2.6) 5.6 (2.1) 5.2 (0.4)
Cervical region 6.0 (2.7) 4.5 (1.6) 5.6 (2.3) 5.3 (1.9) 5.1 (1.7) 4.4 (1.6) 5.5 (2.3) 5.2 (0.6)
SD - Standard Deviation, † mean not calculated, ‡ standard deviation not calculated
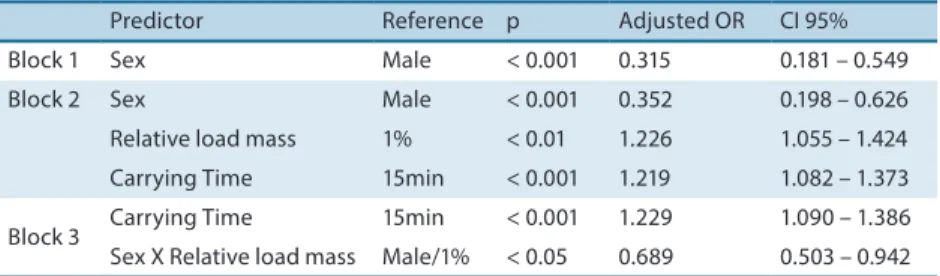
Regarding variables of block 2, a substantial increase in the predic-tive ability of the model with χ2 value = 39.069; p<0.001 was observed, retaining the relative mass of the volume (p<0.01) and the carrying time (p<0.001); gender remained a signiicant predictor in association with the two variables included (p<0.001), in which females were 2.84 times
more likely to experience pain (OR= 0.352; CI95%=0.198 – 0.626). he 1%
increase in the relative mass of volumes increased by 22.6% (OR= 1.226;
CI95%=1.055 – 1.424) the probability of having pain. Moreover every 15
minutes of transportation increases the likelihood of having pain by 21.9%. (OR= 1.219; CI95%=1.082 – 1.373).
Block 3 had a χ2 value =44.735; p<0.001, suggesting that the
15 minutes (OR=1.229; CI95%=1.090 – 1.386) (Table 4).
Table 4.Variables predictive of pain.
Predictor Reference p Adjusted OR CI 95%
Block 1 Sex Male < 0.001 0.315 0.181 – 0.549
Block 2 Sex Male < 0.001 0.352 0.198 – 0.626
Relative load mass 1% < 0.01 1.226 1.055 – 1.424
Carrying Time 15min < 0.001 1.219 1.082 – 1.373
Block 3 Carrying Time 15min < 0.001 1.229 1.090 – 1.386
Sex X Relative load mass Male/1% < 0.05 0.689 0.503 – 0.942
DISCUSSION
he aim of this study was to determine the prevalence of pain and its association with the transportation of school supplies among university students. Results indicated that students carried school supplies with average weight of 3.04 kg, corresponding to 4.95% of student’s weight. his result puts them in a safe range, according to Brackley and Stevenson23,who stated that, based on
epidemiological, physiological and biomechanical data, there is a tolerance for the transportation of school supplies of 10%-15% of students’ body weight.
Previous survey conducted among 238 college students revealed an average weight of 5.2 kg of school supplies10. Other authors, more cautiously
demonstrated that the load volume should not exceed 10% the subject’s weight24,25. In this sense, the mean values for university students, in the
present study, are within normal limits stipulated by literature. he load weight increases signiicantly with increasing age, ranging from 5 to 29%
the body weight , which exceeds the advisable limit of 10%26.
Regardless of university course, the most frequent type of material was the two-strap backpack (52.2%). However, the transportation occurred mainly over one shoulder (40.2%), thus becoming a practice that entails adapting modiication in all anatomical planes, causing larger musculo-skeletal imbalance and greater efort in order to correct deviations arising
from asymmetric transportation27.
In Spain, Aparicio et al.28 showed similar results regarding the material
chosen by students. When assessing the mode of transportation of school backpack among 203 school children from the city of Salamanca (Spain), the use of the two-strap backpack was predominant. However, among American students, 81% carried their backpack with both straps on the back, while only 14% carried on only one strap19.
he most appropriate way to transport school supplies is carrying the backpack at the back line with one strap over each shoulder24. Some authors
recommend that the backpack should be symmetrically carried over both shoulders, distributing its load evenly, otherwise, it could result in a tilting torque, hurting the spine, which over the years can lead to the development
Prevalence of pain in university students Silva & Cavalcanti
About 82.84% of individuals surveyed reported feeling pain some-where in the body when transporting their school supplies. he prevalence reported in literature varies from 37%19 to 50%29,however, when analyzed
according to sex, there is a prevalence of 36.5% for males and 38.8% for female university students aged 19-20 years10.Several authors have suggested
that a substantial prevalence of low back pain in adolescents is related to the weight of their school supplies29.
he average overall pain by visual analog scale found in this study was 21.5 points, conirming literature data, which shows average of 5.2 points19.
he model proposed to test the predictive power of variables on the occur-rence of pain demonstrated that, among women, the efect of the relative load mass on the presence of pain is 45.1% higher than among men. he carrying time also increased the likelihood of having pain by 22.9%, for every 15 minutes, conirming previous indings that showed that females had higher prevalence of pain10,19.
Some authors reported that there is a positive correlation between increase of the relative load of school supplies and prevalence of
muscu-loskeletal pain19. Such indings conirm the results of this study, which
identiied higher prevalence of pain of 45.1% for each 1% increase in the relative weight of school supplies, as well as a 22.9% increase for every 15 minutes of transporting school supplies.
Some limitations should be highlighted, like the fact that it is a cross-sectional survey, in which only a single measurement of the weight of school supplies was performed. However, it is known that the weight of school supplies may vary with the day of the week27,thus indicating the
need for the development of further studies that follow up a longitudinal measuring of the weight of school supplies, in addition to the association between labor activities and the presence of pain among university students.
It is also necessary to consider the gap in literature on information about the mode of transportation of school supplies in diferent regions of Brazil, a fact that underlines the importance of data obtained in this study, as the initial step for the development of further studies in diferent regions of Brazil.
CONCLUSION
his study showed a high prevalence of pain related to the transportation of school supplies and the predictor inluence of variables such as relative load mass and carrying time of this material. However, although these results are important to promote greater awareness, they may not be transferred to other groups of students due to many genetic, social, cultural diferences among the various states of Brazil.
REFERENCES
2004;41(1):67-5.
3. Alperovitch-Najenson D, Santo Y, Masharawi Y, Katz-Leurer M, Ushvaev D, Kalichman L. Low back pain among professional bus drivers: ergonomic and occupational-psychosocial risk factors. Isr Med Assoc J 2010;12(1):26-31.
4. Skofer B. Low back pain in 15- to 16-year-old children in relation to school furniture and carrying of the school bag. Spine 2007;32(24):713-7.
5. Sato T, Ito T, Hirano T, Morita O, Kikuchi R, Endo N, et al. Low back pain in childhood and adolescence: a cross-sectional study in Niigata City. Eur Spine J 2008;17(11):1441-7.
6. Gunzburg R, Balagué F, Nordin M, Szpalski M, Duyck D, Bull D, et al. Low back pain in a population of school children. Eur Spine J 1999;8(6):439-43.
7. Paananen MV, Auvinen JP, Taimela SP, Tammelin TH, Kantomaa MT, Ebeling HE, et al. Psychosocial, mechanical, and metabolic factors in adolescents’ musculoskeletal pain in multiple locations: a cross-sectional study. Eur J Pain 2010;14(4):395-401.
8. Guyer RL. Faces of Public Health. Editor’s note. Backpack = Back Pain. Am J Public Health 2001;91(1):16-9.
9. Kennedy C, Kassab O, Gilkey D, Linnel S, Morris D. Psychosocial factors and low back pain among college students. J Am Coll Health 2008;57(2):191-5.
10. Heuscher Z, Gilkey DP, Peel JL, Kennedy C. he association of self-reported backpack use and backpack weight with low back pain among college students. J Manipulative Physiol her 2010;33(6):432-7.
11. López SA, García IP, Alonso IC, Garcinuño AC, Llano JMA. Mochilas escolares y dolor de espalda en la población infantil. Rev Pediatr Aten Primaria 2010;12(47):385-97. 12. Bauer DH, Freivalds A. Backpack load limit recommendation for middle school
students based on physiological and psychophysical measurements. Work 2009;32(3):339-50.
13. American College Health Association - National College Health Assessment spring 2007 reference group data report (abridged). J Am Coll Health 2008;56(5):469-79. 14. Brattberg G. Do pain problems in young school children persist into early
adulthood? A 13-year follow-up. Eur J Pain 2004;8(3):187-99.
15. Hestbaek L, Leboeuf-Yde C, Kyvik KO, Manniche C. he course of low back pain from adolescence to adulthood: eight-year follow-up of 9600 twins. Spine 2006;31(4):468-72.
16. Siivola SM, Levoska S, Latvala K, Hoskio E, Vanharanta H, Keinänen-Kiukaanniemi S. Predictive factors for neck and shoulder pain: a longitudinal study in young adults. Spine 2004;29(15):1662-9.
17. Watson KD, Papageorgiou AC, Jones GT, Taylor S, Symmons DPM, Silman AJ, et al. Low back pain in schoolchildren: occurrence and characteristics. Pain 2002;97(1-2):87-92.
18. Negrini S, Carabalona R, Sibilla P. Backpack as a daily load for schoolchildren. Lancet 1999;354(9194):1974.
19. Skaggs DL, Early SD, D’Ambra P, Tolo VT, Kay RM. Back pain and backpacks in school children. J Pediatr Orthop 2006;26(3):358-63.
20. Macias BR, Murthy G, Chambers H, Hargens AR. High contact pressure beneath backpack straps of children contributes to pain. Arch Pediatr Adolesc Med 2005;159(12):1186-7.
21. Neuschwander TB, Cutrone J, Macias BR, Cutrone S, Murthy G, Chambers H, et al. he efect of backpacks on the lumbar spine in children: a standing magnetic resonance imaging study. Spine 2010;35(1):83-8.
Prevalence of pain in university students Silva & Cavalcanti
Corresponding author
Windsor Ramos da Silva Júnior 122, Francisco de Lima Neto street – Bairro Universitário
Campina Grande/PB, CEP: 58429-060 E-mail: [email protected]
23. Brackley HM, Stevenson JM. Are children’s backpack weight limits enough? A critical review of the relevant literature. Spine 2004;29(19):2184-90.
24. Whittfield J, Legg SJ, Hedderley DI. Schoolbag weight and musculoskeletal symptoms in New Zealand secondary schools. Appl Ergon 2005;36(2):193-8. 25. Sheir-Neiss GI, Kruse RW, Rahman T, Jacobson LP, Pelli J a. he association of
backpack use and back pain in adolescents. Spine 2003;28(9):922-30.
26. Candotti C, Noll M, Roth E. Avaliação do peso e do modo de transporte do material escolar em alunos do ensino fundamental. Rev Paul Pediatr 2012;30(1):100-6. 27. Negrini S, Negrini A. Postural efects of symmetrical and asymmetrical loads on
the spines of schoolchildren. Scoliosis 2007;2:8.
28. Aparicio Q, Nogueras M, Sedín L, Alonso R, Pedraz S, Arenillas C. Inluence of the kind daily school stage in the weight pupils rucksacks. Fisioterapia 2005;27(1):6-15. 29. Reneman MF, Poels BJJ, Geertzen JHB, Dijkstra PU. Back pain and backpacks in