DOI: http://dx.doi.org/10.5007/1980-0037.2013v15n6p646
original article
RBCDH
Licence Creative Commom CC
1 Universidade Federal de Santa Catarina. Laboratório de Biome-cânica. Centro de Desportos. Florianópolis, SC. Brasil.
Received: 01 June 2012 Accepted: 17 March 2013
Comparison of body composition and
aerobic and anaerobic performance
between competitive cyclists and
triathletes
Comparação da composição corporal, desempenho
aeróbio e anaeróbio entre ciclistas e triatletas
competitivos
Vanderson Luis Moro1 Rodrigo Ghedini Gheller1 Joscelito de Oliveira Berneira1 Camila Peter Hoefelmann1 Fabio Colussi Karasiak1 Antônio Renato Pereira Moro1 Fernando Diefenthaeler1
Abstract – he aim of this study was to compare anthropometric characteristics and
aerobic and anaerobic itness between competitive cyclists and triathletes. he sample consisted of 11 cyclists and 12 triathletes with experience in competitions. he tests were performed on two diferent days, with an interval of 48 h between sessions. On the irst day, the athletes were submitted to anthropometric assessment (body mass, height, and skinfold thickness) and a maximal incremental test to determine maximal oxygen uptake, maximum power, maximum heart rate, maximum lactate, and the irst (LL1) and second lactate threshold (LL2). he Wingate test was conducted on the second day to determine peak power, average power, and fatigue index. here were signiicant diference (p < 0.05), with medium efect size (0.80 - 1.5), in mid-thigh skinfold thickness (15.2 ± 6.3 and 10.5 ± 4.8 mm), power at LL1 (195.0 ± 30.9 and 162.7 ± 28.3 W), power at LL2 (247.6 ± 25.0 and 219.7 ± 37.9 W), and fatigue index (47.2 ± 13.0 and 60.1 ± 16.4%) between cyclists and triathletes, respectively. he other variables did not difer between groups. Anthro-pometric characteristics are similar in triathletes and cyclists. However, cyclists present higher power outputs at the lactate thresholds (LL1 and LL2) and lower fatigue indexes.
Key words: Aerobic performance; Anaerobic performance; Anthropometry; Cycling;
Triathlon.
Cycling is one of the most traditional sports in the world, especially in Eu-rope where the Tour de France is the classic competition of this discipline. his sport has been part of the Olympic Games since the irst games of the modern era that started in Athens in 1896. Road cycling (~ 250 km) and time trail (~ 45 km) are two of the Olympic disciplines. Triathlon is a more recent sport and the irst oicial competition occurred in
Hono-lulu, Hawaii, in 19781. In addition to cycling, this discipline also involves
swimming and running. Triathlon competitions are classiied according to distance and the most important competitions are: 1) Olympic distance (1500 m swimming, 40 km cycling, and 10 km running), 2) Ironman (3.8 km swimming, 180 km cycling, and 42.2 km running), and 3) Ultraman
(10 km swimming, 421 km cycling, and 84 km running)2.
Regardless of the sport discipline, it is important that athletes have favorable anthropometric and physiological characteristics to improve performance. With respect to anthropometric characteristics, Knechtle et
al.3 showed that low body fat percentage, greater body segment length and
higher lean body mass are associated with higher performance in cycling and triathlon competitions. Some studies have compared anthropometric
characteristics between cyclists and triathletes4,5. Rust et al.4 investigated
anthropometric variables of cyclists and triathletes and found diferences in muscle mass and arm, thigh and calf circumference. Furthermore, O’Toole et
al.5, analyzing anthropometric variables (height, body bass and fat percentage)
in triathletes, swimmers, runners and cyclists, observed that the anthro-pometric characteristics of triathletes are more similar to those of cyclists.
With respect to physiological variables, triathletes and cyclists need
to have high maximal oxygen uptake (VO2MAX) and anaerobic threshold
to achieve best performance in their respective competitions6. According
to Caputo et al.7 and Diefenthaeler et al.8, cyclists have higher VO
2MAX,
maximum heart rate (HRMAX) and anaerobic threshold than triathletes.
However, Laursen et al.9 observed no diferences in aerobic performance
between these groups.
Other physiological variables that play an important role in cycling per-formance are anaerobic power and anaerobic capacity, which are required
during sprints and particularly at the end of the competition10. Anaerobic
performance has been evaluated in cyclists11 and triathletes12, but there are no
studies comparing this parameter between the two groups. Comparison of cycling performance between triathletes and cyclists is a valid approach since cycling corresponds to approximately 50% of total race time in triathlon
competitions13. In addition, it is important to determine whether diferences
exist in the anthropometric characteristics and physiological capacity of
triathletes considering the speciicity of training in the three disciplines14.
Performance of cyclists and triathletes Moro et al.
METHODOLOGICAL PROCEDURES
Subjects
he sample consisted of male competitive cyclists (n=11) and triathletes (n=12). All athletes had participated for more than one year in regional and national competitions. he mean weekly volume of cycling training during the 2 months prior to the tests was 284.0 ± 123.4 km for cyclists and 170.0 ± 55.1 km for triathletes.
he athletes were classiied as competitive level according to Ansley
and Cangley15 based on VO
2MAX of 50 to 60 ml∙kg
-1∙min-1 and maximum
aerobic power of 275 to 375 W during the incremental test.
The study was conducted in accordance with the Declaration of Helsinki and the guidelines of Resolution 196/96 of the National Health Council, and was approved by the Ethics Committee on Human Research (CEPSH) of Universidade Federal de Santa Catarina (Permit No. 065/06).
Experimental procedures
he tests were conducted on 2 days at an interval of 48 h between sessions. On the irst day, the athletes were submitted to anthropometric assessment and a maximal incremental test to determine aerobic variables. On the second day, the Wingate test was performed to evaluate anaerobic itness. he maximal incremental test and Wingate test were completed on an
electromagnetically braked cycle ergometer (Lode Excalibur Sport®, he
Netherlands). he cycle ergometer was adjusted individually to reproduce the coniguration of the cyclist’s bicycle in terms of horizontal position
and saddle and handlebar height16. he subjects were asked not to exercise
exhaustively on the day prior to assessment and to have eaten and be hy-drated on the day of the test. he temperature (20.3 ± 2.4ºC) and relative air humidity (55.5 ± 7.1%) of the room were controlled with an air-conditioning system throughout all steps of the study.
Anthropometry
he anthropometric measurements were made by certiied anthropo-metrists according to the protocols of the International Society for the
Advancement of Kinanthropometry17. Body mass and height were measured
with an electronic scale (Toledo, Brazil) to the nearest 100 g and with a wall stadiometer (Seca, Hamburg, Germany) to the nearest 1 mm, respectively.
Triceps, biceps, subscapular, iliac crest, supraspinal, abdominal, mid-thigh and medial calf skinfold thicknesses were measured with a scientiic skinfold caliper (Cescorf, Brasil) to the nearest 0.1 mm. Body density was estimated using the equation developed by Petroski in 1995, which was
validated for Brazilian men aged 18 to 66 years18: body density = 1.10726863
– 0.00081201 (Σ4SF) + 0.00000212 (Σ4SF)2 – 0.0004176, where Σ4SF is the
determined by the fractionation of body mass into two components: lean body mass = body mass – fat mass).
Maximal incremental test
he incremental test was started at a load of 100 W, followed by increments
of 30 W at intervals of 3 min until exhaustion19. At the irst two stages
(loads of 100 and 130 W), the athletes pedaled at their preferred cadence to determine the pedaling cadence that would be maintained throughout the test. he criteria for interruption of the maximal incremental test were the inability to maintain the required cadence, heart rate reaching the
maximum value predicted for age, or voluntary exhaution19. he subjects
were verbally encouraged to give maximal efort during the test.
Oxygen uptake and carbon dioxide production were monitored at each respiration throughout the test with a Quark PFT Ergo gas analyzer (Cosmed, Italy). he apparatus was calibrated according to manufacturer recommendations, including the calibration of ambient air for comparison
of atmospheric oxygen uptake (VO2) and production of atmospheric carbon
dioxide (CO2) (20.93% and 0.03%, respectively), calibration of the cylinder
gas (VO2 = 16%, CO2 = 5%), calibration of the turbine to determine air low,
and delay calibration which consists of measuring the time the gas sample requires to pass the air line before being analyzed. he data from the gas analyzer were smoothed (mean of 15 s). In the last minute of each 3-min
stage of the test, a mean value was calculated to determine VO2
correspond-ing to each stage and the highest value obtained was deined as VO2MAX.
he following criteria were adopted to guarantee that the subjects reached
VO2MAX during the test: blood lactate concentration [La] > 7.5 mmol∙l-1,
respiratory exchange ratio ≥ 1.1, and VO2 reaching a plateau (increase in
VO2 of less than 2.1 ml∙kg-1∙min-1 with increasing load) or VO
2 starting to
decline with increasing load20.
When the last stage was not completed, maximum power (WMAX) was
determined according to the method of Kuipers as follows:
WMAX = WF + [(t / 180) x 30]
where W
MAX is the maximum power produced, WF is the power (in watts) during the last completed stage, and
t is the time (in seconds) of the incomplete stage.
Heart rate was monitored continuously throughout the test with
a Polar S610 heart rate monitor (Polar, Finland). he heart rate data
were smoothed (average of 5 s). In the last minute of each 3-min
stage of the maximal incremental test, a mean value was calculated
to determine the heart rate corresponding to each stage and the
highest value was deined as the maximum heart rate (HR
MAX).
At the end of each stage, blood samples were collected from the earlobe
Performance of cyclists and triathletes Moro et al.
(LL2) lactate threshold. he earlobe was disinfected with 70% alcohol and
punctured with a disposable lancet. For the analysis of [La], 25-µl blood samples were collected into heparinized capillary tubes and analyzed in an YSI 2700 biochemical analyzer (Stat Select, USA), with a precision of 2%. he [La] values of each stage were plotted as a function of power output
at the respective stage. LL1 was determined by the second increase of 0.5
mmol∙l-1 or higher in relation to lactatemia of the previous stage21. Two
specialists analyzed the graphs in a double-blind fashion. LL2 was obtained
by adding the ixed value of 1.5 mmol∙l-1 to the lowest equivalent22.
Wingate test
he subjects were familiarized with the Wingate test by performing a 10-s trial ater the incremental test on the irst day of data collection. At the beginning of the test, the athletes performed a warm-up for 5 min by cycling at a load of 50 W, with a sprint of 3 to 5 s at the end of each minute,
as proposed by Inbar et al.23. Ater the warm-up period, the subjects were
asked to remain seated and to perform maximal efort over the 30 s of the test. he load (resistance) used in the Wingate test was 7.5% of the subject’s
body mass23. he athletes were asked to maintain a pedaling cadence of
120 rpm at the beginning of the test to reduce the initial inertia of the cycle ergometer11.
During the test, the athletes were verbally encouraged to give the maximum efort possible. At the end of the test, the subjects underwent active recovery of 3 min at a load of 50 W. Peak power (highest mechani-cal power that can be generated by the muscle group involved in the test), average power (average power produced over the period of 30 s), and the fatigue index (diference between initial and inal power) were calculated during the Wingate test using the Lode Ergometry Manager sotware (Lode
Excalibur Sport®, he Netherlands).
Statistical analysis
he Shapiro-Wilk test was used to determine whether the data showed a normal distribution. Diferences in the anthropometric and physiological
variables between cyclists and triathletes were evaluated by the Student t
-test for independent samples. A level of signiicance of p < 0.05 was adopted. Efect size was used to evaluate the magnitude of the diferences between cyclists and triathletes and was classiied as nonsigniicant (< 0.35), small
(0.35 – 0.80), medium (0.80 – 1.5), and large (> 1.5)24. he results were
analyzed using the SPSS 15.0 for Windows (SPSS, Inc., USA) and G Power 3 (Heinrich-Heine-Universität, Düsseldorf, Germany) sotwares.
RESULTS
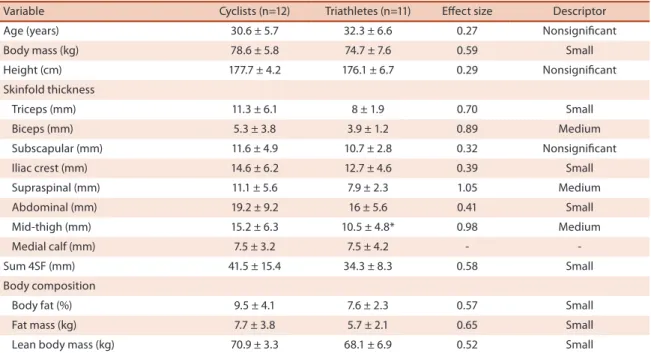
Age (years) 30.6 ± 5.7 32.3 ± 6.6 0.27 Nonsigniicant Body mass (kg) 78.6 ± 5.8 74.7 ± 7.6 0.59 Small Height (cm) 177.7 ± 4.2 176.1 ± 6.7 0.29 Nonsigniicant Skinfold thickness
Triceps (mm) 11.3 ± 6.1 8 ± 1.9 0.70 Small Biceps (mm) 5.3 ± 3.8 3.9 ± 1.2 0.89 Medium Subscapular (mm) 11.6 ± 4.9 10.7 ± 2.8 0.32 Nonsigniicant Iliac crest (mm) 14.6 ± 6.2 12.7 ± 4.6 0.39 Small Supraspinal (mm) 11.1 ± 5.6 7.9 ± 2.3 1.05 Medium Abdominal (mm) 19.2 ± 9.2 16 ± 5.6 0.41 Small Mid-thigh (mm) 15.2 ± 6.3 10.5 ± 4.8* 0.98 Medium Medial calf (mm) 7.5 ± 3.2 7.5 ± 4.2 - -Sum 4SF (mm) 41.5 ± 15.4 34.3 ± 8.3 0.58 Small Body composition
Body fat (%) 9.5 ± 4.1 7.6 ± 2.3 0.57 Small Fat mass (kg) 7.7 ± 3.8 5.7 ± 2.1 0.65 Small Lean body mass (kg) 70.9 ± 3.3 68.1 ± 6.9 0.52 Small
Results are reported as the mean ± standard deviation. Sum 4SF: Sum of subscapular, triceps, supraspinal and medial calf skinfold thickness. *p < 0.05 (Student t-test for independent samples).
he results in Table 1 show similar values of triceps, biceps, sub-scapular, iliac crest, supraspinal, abdominal and medial calf skinfold thicknesses, Σ4SF, body fat percentage, fat mass, and lean body mass in cyclists and triathletes. Only medial calf skinfold thickness difered between the two groups.
he aerobic performance (mean, standard deviation and efect size) of the cyclists and triathletes studied is shown in Table 2.
Table 2. Aerobic performance of cyclists and triathletes.
Variable Cyclists (n=12) Triathletes (n=11) Efect size Descriptor VO2MAX (ml∙kg-1∙min-1) 55.8 ± 5.1 56.8 ± 3.8 0.24 Nonsigniicant
HRMAX (bpm) 186.6 ± 6.8 182.6 ± 8.7 0.57 Small LL1 (mmol∙l-1) 1.26 ± 0.3 1.49 ± 0.4 0.48 Small
LL2 (mmol∙l-1) 2.71 ± 0.3 2.93 ± 0.5 0.53 Small
Maximum [La] (mmol∙l-1) 10.6 ± 1.7 10.5 ± 1.9 -
-Power at LL1 (W) 195 ± 30.9 162.7 ± 28.3* 1.09 Medium Power at LL2 (W) 247.6 ± 25 219.7 ± 37.9* 0.87 Medium Maximum power (W) 333.6 ± 27.5 316.4 ± 35.6 0.54 Small Maximum power (W∙kg-1) 4.3 ± 0.6 4.4 ± 0.5 -
-Cadence (rpm) 85.1 ± 6.5 86.8 ± 7.2 0.15 Nonsigniicant
Results are reported as the mean ± standard deviation. VO2MAX: maximal oxygen uptake; HRMAX: maximum heart rate; LL1: irst lactate threshold; LL2: second lactate threshold; [La]: lactate concentration. *p < 0.05 (Student t-test for independent samples).
he results of the maximal incremental test (Table 2) show that cyclists presented signiicantly higher power outputs at the blood lactate transition
thresholds (LL1 and LL2) than triathletes. he other variables did not difer
Performance of cyclists and triathletes Moro et al.
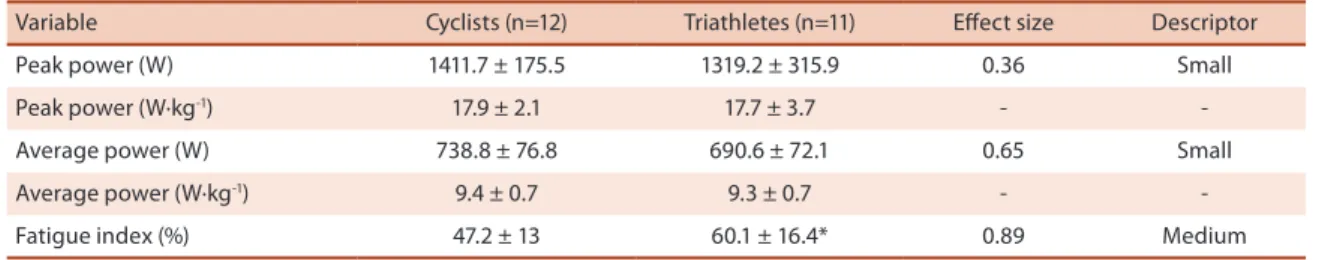
Table 3 shows the anaerobic performance (mean, standard deviation and efect size) of the cyclists and triathletes studied.
Table 3. Anaerobic performance of cyclists and triathletes.
Variable Cyclists (n=12) Triathletes (n=11) Efect size Descriptor Peak power (W) 1411.7 ± 175.5 1319.2 ± 315.9 0.36 Small Peak power (W∙kg-1) 17.9 ± 2.1 17.7 ± 3.7 -
-Average power (W) 738.8 ± 76.8 690.6 ± 72.1 0.65 Small Average power (W∙kg-1) 9.4 ± 0.7 9.3 ± 0.7 -
-Fatigue index (%) 47.2 ± 13 60.1 ± 16.4* 0.89 Medium
Results are reported as the mean ± standard deviation. *p < 0.05 (Student t-test for independent samples).
he results of the Wingate test revealed no signiicant diferences in peak or average power (absolute and relative values) between cyclists and triathletes. In contrast, the fatigue index was signiicant lower in cyclists.
DISCUSSION
he objective of the present study was to compare anthropometric charac-teristics and aerobic and anaerobic itness between competitive cyclists and triathletes. We observed no signiicant diferences in height, body mass, sum of skinfolds, body fat percentage, fat mass or lean body mass between
the two groups. In a recent study, Rust et al.4 also found no diferences in
body mass, height, fat percentage or pectoral, axillary, triceps, subscapular, abdominal, iliac crest and calf skinfold thicknesses between triathletes and
cyclists. Similarly, Laursen et al.9 observed no signiicant diferences in body
mass or sum of ive skinfolds (biceps, triceps, subscapular, supraspinal, and abdominal) between cyclists and triathletes. hese indings agree with the present study and indicate that anthropometric characteristics are similar in cyclists and triathletes.
Knechtle et al.25 suggested that the anthropometry of triathletes is
associated with total race time rather than training volume (hours per week). It is therefore believed that training volume does not cause changes in the body composition of cyclists or triathletes with low levels of body fat. However, mid-thigh skinfold thickness was signiicantly lower (medium efect size) in triathletes when compared to cyclists (Table 1). his inding can be explained by the speciicity of triathlon training, with the run
training causing a reduction in skinfold thicknesses of the lower limbs26.
Arrese and Ostariz27 demonstrated an association between reduced thigh
skinfold thickness and increased running performance. However, Knechtle
et al.26 found no such association in ultra-endurance cyclists. hese authors
suggested that athletes of the two disciplines (running and cycling) use the same lower limb muscle group, but that the intensity and muscle demand during cycling races are lower.
With respect to aerobic performance (Table 2), the present results
triathletes have physiological values similar to those of athletes of speciic sport disciplines, particularly running and cycling, although they divide
their training time among three disciplines. However, other studies7,8
reported higher VO2MAX values for cyclists when compared to triathletes.
According to the authors, training speciicity may be a determinant factor for the diference in the levels of aerobic conditioning between cyclists and triathletes. On the other hand, since the training volume of triathletes is higher than that of cyclists due to the fact that the former spent time on three disciplines (swimming, cycling and running), we suggest that, even without a direct speciicity, the swimming and running training performed
by the triathletes studied may have inluenced the VO2MAX and maximum
power results.
Although VO2MAX is an important physiological index for endurance
athletes, it is limited in predicting the aerobic performance of athletes of
homogenous competitive level28. herefore, lactate thresholds (LL
1 and LL2)
have been considered better predictors of aerobic performance since they are more sensitive to peripheral adaptations that continue to occur during
training28. his fact may explain the results of the present study in which
VO2MAX was similar in cyclists and triathletes, but higher power outputs at
LL1 and LL2 were observed in cyclists, with a medium size efect.
he present results regarding the blood lactate transition thresholds
agree with the indings of other studies7-9, which suggested that cyclists
and triathletes difer in terms of aerobic conditioning due to the fact that the irst and second thresholds are higher in cyclists, causing distinct
physiological adaptations. According to Caputo et al.7, the speciicity of
the discipline can inluence aerobic performance, with cyclists presenting a higher performance than triathletes in cycling tests, whereas the opposite is observed in running tests.
Peak power or average power obtained in the Wingate test (Table 3) did not difer signiicantly between cyclists and triathletes. In contrast, the fatigue index was signiicantly lower in cyclists than in triathletes. Similar values of peak power and average power have been reported in the literature
for cyclists11 and triathletes12. However, none of these studies compared
anaerobic performance between these two groups of athletes.
According to Faria et al.29, the capacity of a cyclist to produce power
through anaerobic metabolism is important in view of the sprints per-formed during a race. A cycling race is characterized by a power of 300 W maintained for prolonged periods of time and high peak power (> 800 W)
for short periods of time10. In contrast, triathletes perform fewer sprints
during the cycling race than cyclists, since higher demand of the anaerobic energy system during cycling may accelerate the process of muscle fatigue,
reducing the performance of the triathlete during running30. However,
Performance of cyclists and triathletes Moro et al.
athletes to eventually perform sprints when they overtake, break away or follow with the group and when they pick up speed again.
One limitation of the present study is the fact that body circumferences, segment lengths and bone diameters were not measured. hese parameters could provide further information about the anthropometric proile of cyclists and triathletes. Further studies including elite athletes are needed to compare and standardize these results.
Based on the results of this study, it can be concluded that body com-position and anthropometric characteristics are similar in triathletes and cyclists. Cyclists present higher power outputs at the lactate thresholds
(LL1 and LL2) and lower fatigue indexes, suggesting that the speciicity of
cycling training causes diferent physiological adaptations.
REFERENCES
1. Lepers R. Analysis of Hawaii ironman performances in elite triathletes from 1981 to 2007. Med Sci Sports Exerc 2008;40(10):1828-34.
2. Bentley DJ, Millet GP, Vleck VE, McNaughton LR. Speciic aspects of contemporary triathlon: implications for physiological analysis and performance. Sports Med 2002;32(6):345-59.
3. Knechtle B, Knechtle P, Rosemann T. Upper body skinfold thickness is related to race performance in male Ironman triathletes. Int J Sports Med 2011;32(1):20-7. 4. Rust CA, Knechtle B, Knechtle P, Wirth A, Rosemann T. A comparison of
anthro-pometric and training characteristics among recreational male ironman triathletes and ultra-endurance cyclists. Chin J Physiol 2012;55(2):114-24.
5. O’Toole ML, Hiller DB, Crosby LO, Douglas PS. he ultraendurance triathlete: a physiological proile. Med Sci Sports Exerc 1987;19(1):45-50.
6. Menaspa P, Rampinini E, Bosio A, Carlomagno D, Riggio M, Sassi A. Physiological and anthropometric characteristics of junior cyclists of diferent specialties and performance levels. Scand J Med Sci Sports 2012; 22(3):392-8 27.
7. Caputo F, Stella SG, Mello MT, Denadai BS. Indexes of power and aerobic capacity obtained in cycle ergometry and treadmill running: comparisons between sed-entary, runners, cyclists and triathletes. Rev Bras Med Esporte 2003;9(4):223-30. 8. Diefenthaeler F, Candotti CT, Ribeiro J, Oliveira AR. Comparison of absolute and
relative phisiological responses of cyclists and triathletes. Rev Bras Med Esporte 2007;13(3):205-8.
9. Laursen PB, Shing CM, Tennant SC, Prentice CM, Jenkins DG. A comparison of the cycling performance of cyclists and triathletes. J Sports Sci 2003;21(5):411-8. 10. Vogt S, Schumacher YO, Roecker K, Dickhuth HH, Schoberer U, Schmid A, et
al. Power output during the Tour de France. Int J Sports Med 2007;28(9):756-61. 11. Peveler WW, Green JM. Efects of saddle height on economy and anaerobic power
in well-trained cyclists. J Strength Cond Res 2011;25(3):629-33.
12. Ricard MD, Hills-Meyer P, Miller MG, Michael TJ. he efects of bicycle frame geometry on muscle activation and power during a Wingate anaerobic test. J Sports Sci Med 2006;5:25-32.
13. Galy O, Manetta J, Coste O, Maimoun L, Chamari K, Hue O. Maximal oxygen uptake and power of lower limbs during a competitive season in triathletes. Scand J Med Sci Sports 2003;13(3):185-93.
14. Suriano R, Bishop D. Physiological attributes of triathletes. J Sci Med Sport 2010;13(3):340-7.
Corresponding author
Fernando Diefenthaeler Universidade Federal de Santa Catarina, Centro de Desportos – Laboratório de Biomecânica, Campus Universitário Trindade
88040-970 – Florianópolis, SC. Brasil E-mail: [email protected]
2012;14(3):244-53.
17. Marfell-Jones M, Olds T, Stewart A, Carter JEL. International standards for an-thropometric assessment. Sydney: UNSW Press; 2006.
18. Silva DA, Benedetti TR, Ferrari EP, Meurer ST, Antes DL, Silva AM, et al. Anthropo-metric proiles of elite older triathletes in the Ironman Brazil compared with those of young Portuguese triathletes and older Brazilians. J Sports Sci 2012;30(5):479-84. 19. Rossato M, Bini RR, Carpes FP, Diefenthaeler F, Moro AR. Cadence and work-load efects on pedaling technique of well-trained cyclists. Int J Sports Med 2008;29(9):746-52.
20. Leirdal S, Ettema G. he relationship between cadence, pedalling technique and gross eiciency in cycling. Eur J Appl Physiol 2011;111(12):2885-93.
21. Baldari C, Guidetti L. A simple method for individual anaerobic threshold as predictor of max lactate steady state. Med Sci Sports Exerc 2000;32(10):1798-802. 22. Berg A, Jakob E, Lehmann M, Dickhuth HH, Huber G, Keul L. Aktuelle Aspekte
der modernen Ergometrie. Pneumologie 1990;44:2-13.
23. Inbar O, Bar-Or O, Skinner JS. he Wingate anaerobic test. Champaign IL: Hu-man Kinetics; 1996.
24. Rhea MR. Determining the magnitude of treatment efects in strength training research through the use of the efect size. J Strength Cond Res 2004;18(4):918-20. 25. Knechtle B, Wirth A, Baumann B, Knechtle P, Rosemann T, Oliver S. Diferential
correlations between anthropometry, training volume, and performance in male and female Ironman triathletes. J Strength Cond Res 2010;24(10):2785-93. 26. Knechtle B, Knechtle P, Rosemann T. No association between skinfold thicknesses
and race performance in male ultra-endurance cyclists in a 600 km ultra-cycling marathon. Hum Mov 2009;10(2):91-5.
27. Arrese AL, Ostariz ES. Skinfold thicknesses associated with distance running performance in highly trained runners. J Sports Sci 2006;24(1):69-76.
28. Denadai BS. Índices isiológicos de avaliação aeróbia: conceitos e aplicações. 1st ed. São Paulo: B.S.D; 1999.
29. Faria EW, Parker DL, Faria IE. he science of cycling: physiology and training - part 1. Sports Med 2005;35(4):285-312.