172 Radiol Bras. 2011 Mai/Jun;44(3):172–176
Evaluation of diverse methods for measuring compression
force in three different mammographic systems
*
Avaliação dos diferentes métodos de medida de força de compressão em três equipamentos mamográficos diferentes
Rochelle Lykawka1, Patrícia Biasi2, Clauzi Rodrigo Guerini3, Marcelo Schneider Bemvenuti4, Gabriela Hoff5
Objective: To evaluate the intermethod agreement in the measurement of compression force as well as variations in the testing of different mammography systems. Materials and Methods: Ten compression force measurements were performed for each proposed method on each mammography apparatus (Mammomat 3000-Siemens, Mammo Diagnostic UC-Philips and Alpha ST-GE), with an evaluation of the differences among the mammographic equipments as far as the application of such measurement methods is concerned, as well as the differences among the applied methods. Results: Significant differences were observed among the results for the different systems and methods, and the values measured with the aid of a bathroom-scale-type dynamometer resulted in compression force underestimation. Each compression system presented different responses for the proposed methods. Conclusion:
Differences were observed among compression systems and among proposed methods. Thus the choice of the way the compression test is performed is critical for the acceptance of the mammography equipment, the technical lead being the most competent to define the most appropriate and realistic testing method. It is suggested that the compression force measurement should be performed with an extension dynamometer, rather than with a compression dynamometer, in cases where the mammography compression system functioning is not known.
Keywords: Mammography; Compression force; Quality control.
Objetivo: Verificar a concordância dos resultados apresentados por diferentes métodos de medida e as variações apresentadas na aplicação deles em diferentes equipamentos mamográficos. Materiais e Métodos: Foram realiza-das 10 medirealiza-das de força de compressão para cada método proposto em cada equipamento avaliado (Mammomat 3000-Siemens, Mammo Diagnostic UC-Philips e Alpha ST-GE), sendo avaliadas as diferenças entre esses equipamentos mamográficos para aplicação dos mesmos métodos de medida e as diferenças entre os métodos aplicados. Resulta-dos: Diferenças significativas foram observadas entre os resultados para os diferentes métodos propostos, sendo o valor medido com auxílio de “balança tipo de banheiro”, o que subestimou o valor da força de compressão. Cada sis-tema de compressão mostrou diferentes respostas para os métodos propostos. Conclusão: Diferenças foram verifi-cadas para os sistemas de compressão e métodos utilizados. Dessa forma, a escolha do modo de realização do teste de compressão torna-se importante para aceitação de equipamentos mamográficos, e a competência para a defini-ção do método mais adequado e realista é do responsável técnico. Sugere-se que a medida de força de compressão seja realizada com auxílio de dinamômetro de extensão e não de compressão se não se conhece o funcionamento do sistema de compressão do mamógrafo.
Unitermos: Mamografia; Força de compressão; Controle da qualidade.
Abstract
Resumo
* Study developed at AFIM Assessoria em Física Médica Ltda and by the Group of Experimentation and Simulation in Medical Physics of Pontifícia Universidade Católica do Rio Grande do Sul (PUCRS), Porto Alegre, RS, Brazil.
1. Specialist in Radiodiagnostic Physics – Associação Brasi-leira de Física Médica (ABFM), Managing Partner of AFIM Asses-soria em Física Médica Ltda, Porto Alegre, RS, Brazil.
2. Graduate Student of Medical Physics, Trainee at AFIM As-sessoria em Física Médica Ltda, Porto Alegre, RS, Brazil.
3. Supervisor of Radiological Protection in Nuclear Medicine – Comissão Nacional de Energia Nuclear (CNEN), Managing Partner of AFIM Assessoria em Física Médica Ltda, Porto Alegre, RS, Brazil.
4. Post-graduate of Projects Management, Managing Partner of AFIM Assessoria em Física Médica Ltda, Porto Alegre, RS, Brazil.
5. PhD, Professor TI 40, School of Physics – Pontifícia
Univer-Lykawka R, Biasi P, Guerini CR, Bemvenuti MS, Hoff G. Evaluation of diverse methods for measuring compression force in three differ-ent mammographic systems. Radiol Bras. 2011 Mai/Jun;44(3):172–176.
vents the patient motion during exposure and aids in the breast tissues distribution, reducing tissues overlapping and facilitat-ing the visualization of breast structures on images(1–3).
Currently, different methods are sug-gested to perform tests for evaluating the mammographic compression force(4–6), in
addition to the development of specific dy-namometers for such testing(3). The present
study was developed to evaluate the inter-method agreement in the measurement of sidade Católica do Rio Grande do Sul (PUCRS), Porto Alegre, RS,
Brazil.
Mailing Address: Dra. Gabriela Hoff. Avenida Ipiranga, 6681, P10/sala 207, Partenon. Porto Alegre, RS, Brazil, 90619-900. E-mail: [email protected]
Received September 4, 2010. Accepted after revision April 27, 2011.
INTRODUCTION
pre-compression force as well as variations in the testing of different mammography ap-paratuses.
MATERIALS AND METHODS
The present study involved the under-taking of tests suggested by the Radio-diagnosis Guidelines mentioned on the Resolution RE 1016 of Agência Nacional de Vigilância Sanitária (Anvisa) (the Bra-zilian Health Surveillance Agency)(4). Fur-thermore, the methodologies proposed by the European Guidelines for Quality Assur-ance in breast cAssur-ancer screening and diag-nosis(5) and American Association of Physi-cists in Medicine(6) were employed.
Differ-ent force measuremDiffer-ent devices (dynamom-eters) were utilized, namely, one Keithley
dynamometer, one Sunrise standard model, and one RMI 163 model specific for mam-mography, besides one KRATOS extension dynamometer (testing range up to 100 kgf), always attached to the compression paddle at 2–5 cm from the chest wall. Additionally, different materials were utilized to offer resistance to compression: tennis balls (as recommended by the European Protocol), plastic balls (Killp Plásticos Ltda) and hos-pital gauze cloths.
The tests were accomplished on the fol-lowing mammography units: Siemens Mammomat 3000, Philips Mammo Diag-nostic UC and GE Alpha ST.
In the testing with the RMI instrument, the data collection was made in different ways, as follows: with the compression paddle over the dynamometer support
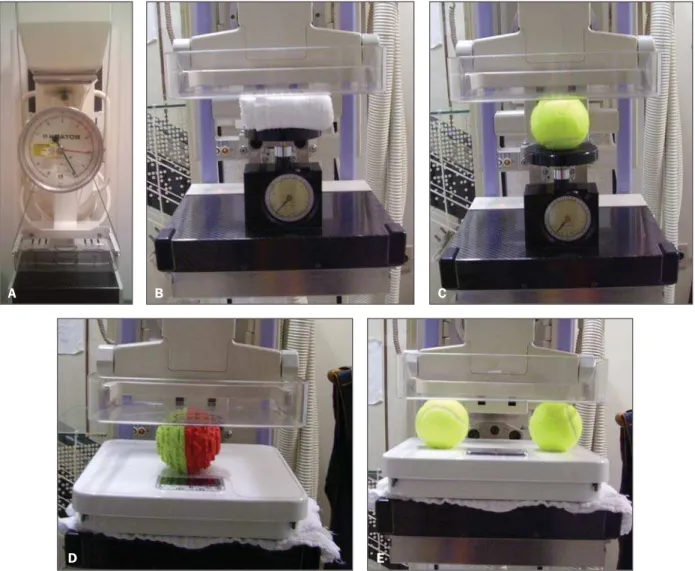
plate; with one tennis ball or plastic ball placed between the compression paddle and the support plate; and the hospital gauze cloth folded in 2, 4 and 16 parts, placed between the compression paddle and the support plate. On the other hand, with the bathroom-scale-type dynamom-eter, the data collection was made as fol-lows: either with one or with two tennis/ plastic ball(s) placed between the compres-sion paddle and the surface of the scale support plate; and with the hospital gauze cloth folded in 2, 4 and 16 parts and placed between the surface of the scale support plate and the compression paddle. The ex-tension dynamometer was utilized between the X ray tube and the compression paddle. Figure 1 illustrates the geometry of some of such tests.
Figure 1. Photos demonstrating the data collection with a KRATOS dynamometer (A), RMI dynamometer with the hospital gauze cloth folded in 16 parts (B), placed between the instrument support plate and the compression paddle and one tennis ball (C), and Keithley dynamometer with a plastic ball (D) and with two tennis balls (E) between the scale support plate and the compression paddle.
A B C
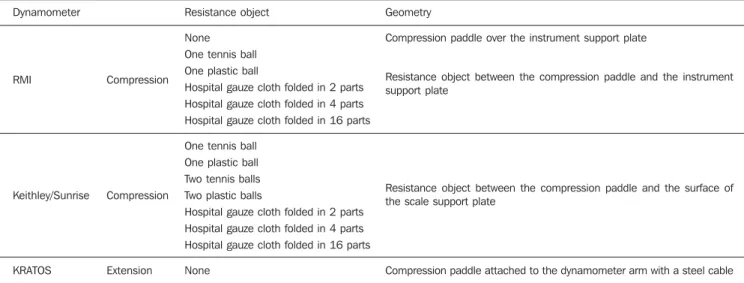
The measurements performed with the extension dynamometer and according to the European Protocol, were established as a comparative reference among the differ-ent testing methods. Thus, the differdiffer-ent measurement methods were evaluated and the respective results were compared for the different mammography units, mea-surement devices and resistance objects. Table 1 reflects an overview of the data col-lection.
Ten measurements were performed for each data collection geometry. Besides the mean value of maximum compression force of the unit, the existence of more than one compression stage was evaluated. A 18 cm × 24 cm bucky device was considered for the purpose of the mammography units comparison. Additional measurements were performed with the Mammomat 3000 unit utilizing a 24 cm × 30 cm bucky, and no significant difference was observed with the change in the size of the compression paddle. The Keithley and Sunrise dyna-mometers did not present any significant difference (variations < 5% in the mean values) among measurements and in the presence of a second compression stage. For this reason, the authors have opted to report the results achieved with the Keith-ley instrument.
With this methodological proposal, the European(5), American(6) and Brazilian(4)
protocols recommendations could be com-pared. Also, it was possible to evaluate the differences between the results with the different resistance objects utilized to
simu-Table 1 Overview of the data collection geometry. Dynamometer RMI Keithley/Sunrise KRATOS Resistance object None One tennis ball One plastic ball
Hospital gauze cloth folded in 2 parts Hospital gauze cloth folded in 4 parts Hospital gauze cloth folded in 16 parts
One tennis ball One plastic ball Two tennis balls Two plastic balls
Hospital gauze cloth folded in 2 parts Hospital gauze cloth folded in 4 parts Hospital gauze cloth folded in 16 parts
None Compression
Compression
Extension
Geometry
Compression paddle over the instrument support plate
Resistance object between the compression paddle and the instrument support plate
Resistance object between the compression paddle and the surface of the scale support plate
Compression paddle attached to the dynamometer arm with a steel cable late the breast under compression.
Addi-tionally, the dependence of the resulting compression force over the resistance ob-ject material was evaluated.
RESULTS
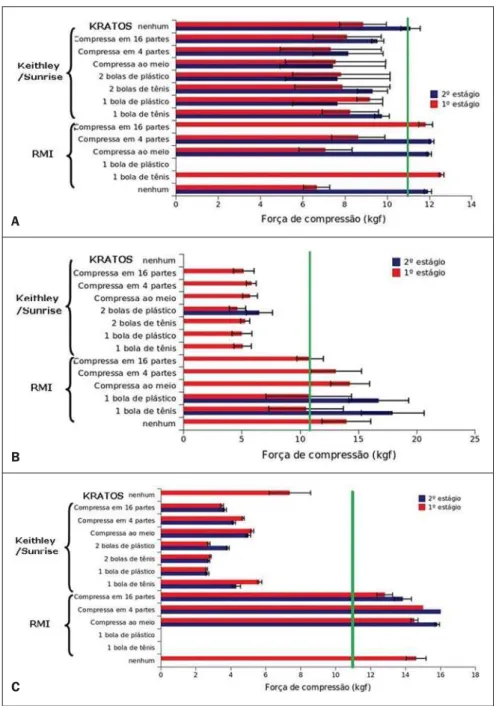
The results of the present study are pre-sented on a sequence of graphics with mean value and standard deviation for measure-ments of compression force performed at the first and second stages of compression. Figure 2 shows graphics with the results observed for each equipment and method evaluated.
The absence of compression force data regarding any equipment (i.e., no informa-tion on the respective column on the graph-ics included in Figure 2), corresponds to a test that has not performed because of any technical limitation of the method or the equipment itself, as discussed below.
All the tested units had their respective reports forwarded to the partner institutions for the necessary corrections.
DISCUSSION
Amongst the tested mammography units, the Mammomat 3000 apparatus pre-sented the highest number of secondary compression stages (85%). Because of technical limitations regarding positioning of the compression paddle and height of the RMI instrument, the test with the plastic ball could not be performed in this equip-ment whose compression force values have
always remained below the maximum nor-mative threshold of 18 kgf.
The measurements with the Keithley (with no resistance object), RMI and KRATOS instruments presented mean val-ues between 11 and 13 kgf. The Keithley dynamometer presented the smallest varia-tion in results as the measurement methods evaluated in the present study are com-pared.
On the other hand, the Mammo Diag-nostic UC apparatus presented compres-sion stability, with the smallest number of second compression stages (23%). Such equipment did not allow the utilization of the extension dynamometer. Also, it was the only one that presented compression force values close to the maximum Brazil-ian normative threshold (18 kgf) in the test-ing with a second compression stage, with and without resistance objects, utilizing the RMI dynamometer. However, the standard deviations calculated for each of the mea-surements demonstrated values above such threshold. The Mammo Diagnostic UC equipment was the only one that did not present secondary stages as resistance ob-jects were added. In the measurement method with the Keithley dynamometer, the values were always below the minimum normative threshold. The testing with the extension dynamometer could not be per-formed because of the equipment limita-tion but at the technical lead request.
the unit limitations. All the compression force measurements resulted in values be-low the maximum threshold established by the Brazilian standards. On the other hand, the measurements performed with the RMI and KRATOS dynamometers remained between 11 kgf and 17 kgf, i.e., within the compression force threshold established by the Brazilian standards.
As regards the methods comparison, it may be said that the smallest variations in
the measurements with the extension dyna-mometer were observed amongst the mea-surements performed with the RMI instru-ment. On the other hand, the greatest varia-tions were observed in the measurements with the bathroom scale-type dynamom-eter, probably because the surface of such instrument is larger than the area covered by the breast and many times forces the support plate, leading the compression sys-tem to “perceive” the resistance object in
a different way and, consequently, result-ing in underestimation of the compression force value.
It is known that the utilization of com-pression force greater than the Brazilian normative threshold may result in damages to the breast tissue. On the other hand, com-pression force smaller than the one estab-lished by the Brazilian standards may im-pair the visualization of relevant structures in the breast cancer diagnosis.
The dynamometers utilized in the present study were calibrated and presented constancy in a standard measurement en-vironment. Thus, the variations observed amongst the ten measurements with a same dynamometer must be due to instability in the compression system of each mammog-raphy unit. The differences observed amongst the mean compression force val-ues for a same equipment may be caused by the proposed method (particularly by the inclusion of a resistance object to simulate the breast) and by the compression system of the equipment. Overall, the apparatuses presented smaller percentage variations in the measurements at second compression stages, as applicable.
It is important to observe that resistance objects such as tennis balls and plastic balls may present variable features over time, which may change the test response as such objects are utilized.
The intermethod differences reinforce the importance of utilizing a method that results in more accurate and precise mea-surement of breast compression force, con-sidering that this is essential to generate mammographic images with diagnostic quality.
CONCLUSIONS
Based on the results of the present study, it may be observed that there are significant differences among the applied methods, probably because of differences in the com-pression systems of each mammography unit.
The compression test result depends on both the testing method and the compres-sion system of the mammographic equip-ment. The smallest variations were ob-served with the extension dynamometer, and the greatest ones, with the bathroom Figure 2. Graphics demonstrating mean compression force values for each method and its respective
standard deviations, at the presented compression stages, considering the Siemens Mammomat 3000 (A), Philips Mammo Diagnostic UC (B) and GE Alpha ST (C) apparatuses. The green solid line represents the minimum compression force threshold (11 kgf).
A
B
scale-type dynamometer (underestimated compression force values).
Resistance objects allow a better simu-lation of breast compression and, for this reason, should be utilized in cases where compression dynamometers are utilized as measurement instruments. However, it is recommended that the resistance objects (tennis and plastic balls) use time is ob-served, considering that their resistance force decreases with use.
Considering the present results, it is suggested that compression force measure-ments are performed with extension dyna-mometers, provided they are fixed to the compression paddle, in the region at 2-5 cm from the chest wall. Such location is the best to simulate the breast reaction to com-pression, presenting smaller variation in data (good results reproducibility). Among
the proposed methods, this is the one that is less influenced the mammography equip-ment compression system.
It is important to observe that significant differences were observed among compres-sion systems and among proposed meth-ods. Thus the choice of the way the com-pression test is performed is critical for the acceptance of the mammography equip-ment, the technical lead being the respon-sible who will determine the most appro-priate and realistic testing method.
REFERENCES
1. Hoff G. Cálculo da dose em glândula mamária, uti-lizando o código de transporte de Monte Carlo MCNP, para as energias utilizadas em mamogra-fia [dissertação]. Rio de Janeiro, RJ: Universi-dade do Estado do Rio de Janeiro; 2005. 2. Rothenberg LN. Exposures and doses in
mam-mography. In: Haus AG, Yaffe MJ, editors. Sylla-bus: a categorical course in physics – technical
as-pects of breast imaging. 3rd ed. Chicago, IL: Ra-diological Society of North America; 1994. p. 113–20.
3. Godinho ER, Koch HA. Rastreamento do câncer de mama: aspectos relacionados ao médico. Ra-diol Bras. 2004;37:91–9.
4. Brasil. Ministério da Saúde. Agência Nacional de Vigilância Sanitária. Radiodiagnóstico médico: desempenho de equipamentos e segurança. Série A. Normas e manuais técnicos. Brasília, DF: Ministério da Saúde; 2005.
5. Perry N, Broeders M, de Wolf C, et al. European guidelines for quality assurance in breast cancer screening and diagnosis. 4th ed. Luxembourg: Office for Official Publications of the European Communities; 2006.