Welfare Analysis of Regulating Mobile Termination
Rates in the UK with an Application to the
Orange/T-Mobile Merger
David Harbord
yMarket Analysis Ltd
Steffen Hoernig
zNOVA School of Business and Economics
16 October 2012
Abstract
We present a calibrated model of the UK mobile telephony market with four mobile networks; calls to and from the …xed network; network-based price discrim-ination; and call externalities. Our results show that reducing mobile termination
rates broadly in line with the recent European Commission Recommendation to
either “pure long-run incremental cost”; reciprocal termination charges with …xed networks; or “Bill & Keep” (i.e. zero termination rates), increases social welfare, consumer surplus and networks’ pro…ts. Depending on the strength of call exter-nalities, social welfare may increase by as much as £990 million to £4.5 billion per year, with Bill & Keep leading to the highest increase in welfare. We also apply the model to estimate the welfare e¤ects of the 2010 merger between Orange and T-Mobile under di¤erent scenarios concerning MTRs, and predict that consumer surplus decreases strongly.
Keywords: telecommunications, regulation, mobile termination rates, network e¤ects, welfare, calibration
JEL Codes: D43, L13, L51, L96
We thank Lars Wiethaus, Sjaak Hurkens and seminar audiences at EARIE (Istanbul), the University of Évora, ZEW (Mannheim), and the Portuguese Competition Authority for extremely helpful comments and suggestions which have greatly improved the paper. The authors are solely responsible for its contents and for the views expressed, however.
yMarket Analysis Ltd., 34 Great Clarendon Street, Oxford OX2 6AT, UK (e-mail:
zNOVA School of Business and Economics, Universidade Nova de Lisboa, Campus de Campolide,
1
Introduction
Mobile termination rates (MTRs) are the charges that mobile …rms levy on …xed networks and other mobile operators for completing, or “terminating”, calls on their networks. In the UK, the regulation of MTRs has been the subject of intense controversy for more than a decade now. According to the prevailing theory (see Armstrong and Wright 2009a; Arm-strong 2002, Section 3.1; and Wright 2002), while competition between mobile networks to attract new customers may be …erce, in the absence of regulation they will still charge monopoly-level prices to other networks for terminating calls to their subscribers. Once a consumer subscribes to a particular mobile …rm, callers on …xed telephone and other mobile networks must send their calls to that subscriber’s chosen network. No matter how competitive the market for mobile subscribers may be, a mobile network holds a monopoly over, and can charge high prices for, delivering calls to its own subscribers.1
Concerns about mobile call termination being a bottleneck service, and a history of high termination charges, led to MTRs being regulated for the …rst time in the UK in 1999, and they have since been subject to price controls in every country in the European Union, and in numerous other countries around the world.
In contrast, in the United States and Canada, as well as in Singapore, Hong Kong and China, something close to Bill & Keep (B&K) has been adopted for mobile termination, under which MTRs are set at (or near) zero at the wholesale level.2 In the United States
mobile termination charges are set to the same rate as a local …xed-line call termination at US 0.07 cents per minute, and are reciprocal.3 Singapore, Hong Kong and China all
have adopted Bill & Keep for wholesale interconnection charging, while in Canada mobile networks pay for interconnecting tra¢c to and from their networks. Thus, while in the UK average mobile termination charges as of January 2011 exceeded US 6.5 cents per minute, and remained highly controversial, in so-called "Bill & Keep" countries they have been of little or no concern.
Until recently, the approach to regulating MTRs adopted by European regulatory au-thorities, including the telecoms regulator Ofcom in the UK, had been to allow for total
1The characterization of mobile call termination as a monopoly or “bottleneck” service implicitly
assumes that mobile operators can make take-it-or-leave-it o¤ers to …xed-line operators and to each other, which is typically justi…ed by reference to various interconnectivity obligations. Binmore and Harbord (2005) question this assumption, and provide an analysis of mobile call termination instead as a bilateral-monopoly bargaining problem. See also Armstrong and Wright (2007, Section 3.5).
2In these countries mobile subscribers are also often charged for receiving calls, although this is not a
necessary outcome.
3Some mobile networks have negotiated B&K arrangements. These agreements are con…dential, so
cost recovery based on fully-allocated network cost models.4 This approach has been
in-creasingly called into question, however, by a new body of economic literature highlighting the two-sided nature of mobile interconnection markets and the signi…cant role that call externalities play in the analysis of competition, equilibrium pricing, and entry in these markets.5 Impetus for change also came from the entry of new mobile network operators
in many European countries, which argued that their growth and pro…tability was being hampered by high MTRs and the signi…cant levels of on-net/o¤-net price discrimination adopted by the incumbent mobile network operators.
In May 2009, the European Commission (EC, 2009a) issued aRecommendation on the Regulatory Treatment of Fixed and Mobile Termination Rates in the EU which embodied
much of this new economic thinking, and proposed dramatic reductions in MTRs to re‡ect the actual incremental costs of providing voice call termination services to third parties.6
Ofcom subsequently published a consultation document (Ofcom, 2009a) which considered the pros and cons of a number of alternative approaches to regulating MTRs discussed in the ECRecommendation. These were: (i) pricing at “pure long-run incremental cost” (“pure LRIC”), broadly the approach recommended by the EC; (ii) imposing reciprocity with …xed networks, i.e. setting mobile termination charges to match the regulated rates of …xed-line network operators, as practiced in the USA; and (iii) adopting Bill & Keep, which would e¤ectively abolish mobile termination charges by setting them equal to zero. While the …rst option is in line with the EC’s Recommendation, reciprocity with …xed networks would also signi…cantly reduce MTRs. Bill & Keep would entail the most dra-matic change in policy, but variants of it have already been adopted in a number of countries, as noted above, and it was recently recommended by the European Regulators’ Group (ERG, 2009). In March 2011 Ofcom published a decision (in Ofcom 2011a) re-quiring UK mobile operators to reduce MTRs from values which then exceeded 4.15 ppm to 0.72 ppm (its estimate of “pure LRIC”) by 2014/15.7 While these reductions will still
result in MTRs in the UK an order of magnitude above those in the United States, they
4This led to regulated MTRs in the UK ranging from 11.7 pence per minute (ppm) in 1999 to over
4 ppm in 2010/11, with corresponding implications for the prices of o¤-net calls which far exceeded the marginal costs of routing calls between networks. See Section 2
5See, for example, DeGraba (2003); Jeonet al. (2004); Berger (2004) (2005); Hoernig (2007)(2009);
Calzada and Valletti (2008); Hermalin and Katz (2011); Armstrong and Wright (2009b); and Cabral (2011). Harbord and Pagnozzi (2010) provide a survey of much of this literature.
6While not binding on member states, national regulatory authorities such as Ofcom are required to
take "utmost account" of the EC recommendation. See also the accompanying documents (EC, 2009b; 2009c).
7Following an appeal by the companies, in February 2012 the UK´s Competition Commission
represent a signi…cant shift in regulatory policy and a progressive convergence with B&K or near B&K countries.
The debate in the UK and Europe over the EC’sRecommendation, while being …erce,
has su¤ered from a lack of any serious quantitative assessment of the likely e¤ects of the proposed reductions in MTRs on prices, welfare, and consumer and producer surplus in telecommunications markets. Both Ofcom and the European Commission discussed the pros and cons of the various approaches to regulating MTRs in a purely qualitative and largely informal way. What has been lacking is a rigorous quantitative framework that allows us to capture the welfare consequences of adopting one or another of the alternatives being discussed. The principal purpose of this paper is to provide such a framework and assessment for the UK mobile market.
The main obstacle to applying models of telecommunications competition to real-world markets to date has been the need to assume either a duopoly market, or symmetric …rms, since models with several asymmetric networks were considered intractable.8 Few
real-world mobile markets in Europe or elsewhere satisfy either of these assumptions, however. In this paper, we present an analytically tractable model of competition between multiple mobile networks with asymmetries in market shares and costs which allows us to estimate the impact on total welfare, consumer surplus and producer surplus of a decrease in MTRs in the UK mobile market from their 2010 levels to one or another of the alternatives described above. Our model (which builds on Hoernig 2010) thus overcomes the limitations of earlier models, and allows for a more realistic quantitative assessment of changes in regulatory policy towards interconnection pricing than had previously been possible.
We calibrate this model to the UK mobile telephony market allowing for four mobile networks, calls to and from the …xed network, network-based price discrimination, and call externalities, and solve for the equilibrium multi-part tari¤s under alternative as-sumptions concerning the level of MTRs and the ratio of receiver to sender bene…ts (the call externality parameter in our model). Our results in Section 5.1 show that although consumer surplus and economic welfare may decrease in the mobile market considered in isolation as we reduce the level of MTRs, aggregate welfare and consumer surplus
increase in the telecommunications market as a whole for all reasonable values of the call externality parameter. Depending on the strength of call externalities, our model predicts market-wide welfare improvements of £900 million to £4.5 billion per annum, with Bill
8Armstrong and Wright (2009a) and Sauer (2011) are examples of recent papers which assume
& Keep resulting in the greatest increase in overall welfare.
A number of recent papers have argued that reducing MTRs will necessarily reduce consumer surplus, and possibly welfare, in the mobile market (Gans and King, 2001; Hoernig, 2008; Armstrong and Wright, 2009a). Indeed, the Royal Economic Society’s media brie…ng (“European Decision on Mobile Charges May Not Bene…t Customers”) recently emphasized this aspect of the Armstrong and Wright (2009a) analysis, suggest-ing that, “reducing termination charges to very low levels — such as those in the EU’s guidance — may come at a cost to mobile subscribers since ultimately mobile operators may end up competing less aggressively for their customers”. Speci…cally, the argument
is that high …xed-to-mobile termination charges create pro…ts for mobile …rms, some or
all of which is passed on to mobile subscribers via the "waterbed e¤ect".9 Hence
mo-bile subscribers should prefer …xed-to-momo-bile termination rates set at the monopoly (i.e. pro…t-maximizing) level. In addition, mobile subscribers may bene…t from high mobile-to-mobile termination rates, since these make o¤-net calls more expensive than on-net
calls, creating network e¤ects which favour larger networks. This intensi…es competition between networks to attract subscribers, which reduces their equilibrium subscription charges. The much-cited result is that equilibrium consumer surplus on mobile networks is increasing in the level of the mobile-to-mobile termination rate (Gans and King, 2001; Armstrong and Wright, 2009a).
As we discuss in more detail in Section 5.2, however, these arguments are incomplete and do not necessarily survive the inclusion of call externalities and a more realistic number of competing networks in the analysis. The argument with respect to …xed-to-mobile termination rates loses much of its force when call externalities, or receiver bene…ts, matter. With a high ratio of receiver to sender bene…ts (i.e. the call externality parameter in our model), welfare on mobile networks becomes a decreasing function of the level of MTRs. The argument that above-cost, mobile-to-mobile termination rates bene…t mobile consumers, is only necessarily true in models with at most two mobile networks, as …rst demonstrated by Hoernig (2010). With n > 2 networks, although a reduction in the mobile-to-mobile termination rate still mitigates network e¤ects, and hence relaxes competition between mobile networks for market share, the reduction in competition may or may not be su¢cient to reduce consumer surplus in equilibrium, and it is less likely to do so the more signi…cant are call externalities.
9The waterbed e¤ect refers to the phenomenon whereby a reduction (or increase) in MTRs leads to
It is thus an empirical question whether a reduction in MTRs will result in an increase or a decrease in welfare and consumer surplus on mobile networksconsidered in isolation.
In our simulations we …nd that welfare increases in both the mobile and …xed markets when MTRs are reduced, and consumer surplus in the mobile market increases for reasonable values of the call externality parameter. Hence, the trade-o¤ between increasing welfare and maintaining consumer surplus in the mobile market disappears once these factors are taken into account.
Our model thus provides a rigorous and quanti…able approach to assessing the likely consequences of changes in policy towards regulating MTRs, in the UK and elsewhere.10
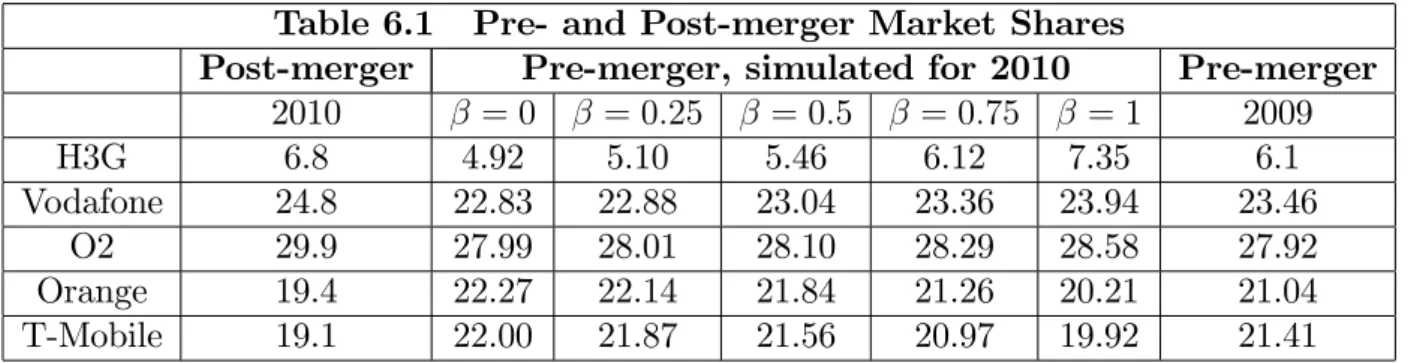
Another natural application is to analyze the recent merger between Orange and T-Mobile, which has created a single …rm with about 40% of all UK mobile subscribers. Doing so allows us to predict the merger’s e¤ects on economic e¢ciency, consumer welfare and mobile …rms’ pro…ts.
We show in Section 6 that with MTRs set at their regulated levels for 2010/11, the overall e¤ect of the merger depends on the strength of call externalities. For low receiver bene…ts the merger may be welfare-improving (if we allow for the cost savings posited by the merged …rms), by moving more subscribers on to a single large network, thus avoiding the ine¢ciencies associated with high o¤-net call prices, themselves partially a product of MTRs which exceed marginal cost. In other words, the merger may help to “ameliorate” the negative e¤ects of above-cost MTRs, allowed until recently by the UK regulatory authorities.
When call externalities are signi…cant, this result is reversed by the strategic incentive of the newly-merged …rm to increase its o¤-net call prices.11 Hence there is a critical
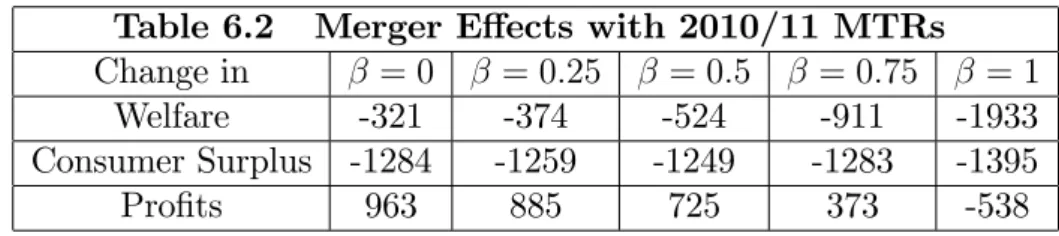
level of the call externality parameter for which the merger becomes harmful to allocative e¢ciency and welfare. When call externalities are large, we predict that overall welfare losses from the merger exceeding £900 million per year, more than double the cost savings of £390 - £420 million per year predicted by the companies themselves. With much lower MTRs, such as "pure LRIC" or Bill & Keep, the e¤ects of the merger on aggregate welfare are much reduced, however.
Since the merger reduces the number of competitors in the mobile market, it reduces the intensity of competition between mobile networks. This induces mobile …rms to raise the level of their …xed charges, increasing pro…ts at the expense of consumer surplus.
10The model has also been calibrated to predict the e¤ects of changes in regulatory policy towards
MTRs in Mexico, Colombia and New Zealand.
11It is a standard result of the literature that, in the presence of call externalities, a network’s o¤-net
The resulting losses in consumer surplus under current MTRs exceed £1.2 billion per annum for all values of the ratio of receiver/sender bene…ts. If MTRs were signi…cantly reduced prior to the merger (to Bill & Keep), the consumer surplus losses are about £900 million per annum, almost all of which translates into higher pro…ts for the mobile …rms. Although the European Commission approved the merger, subject to certain undertakings agreed by the companies (see EC, 2010), it is di¢cult to see how these conditions could have allayed the competition-related concerns illustrated by our calibrated model.12
Section 2 of the paper provides a brief overview of the UK telecoms market in 2010/11. Section 3 describes the market model. Section 4 details our calibration to UK market data and Section 5.1 the results derived using the calibrated model. Section 5.2 discusses these results and considers longer-run implications of reducing MTRs. Section 6 reports on the e¤ects of the Orange/T-Mobile merger, and Section 7 concludes.
2
The UK Telecoms Market
The mobile industry in the UK currently has around 81 million subscribers and consists of four networks, Vodafone, O2, Everything Everywhere (EE - the recently merged Orange and T-Mobile) and the smaller 3G network, Hutchison 3G (H3G). Network subscriber numbers and market shares as of the end of 2010 are shown in Table 2.1 below. Orange and T-Mobile merged their networks in the second quarter of 2010. Prior to the merger each company had about a 21% market share.
Table 2.1 Subscribers and Market Shares, 2010
H3G Vodafone O213 EE14
Subscribers (m) 5.55 20.08 24.28 31.20 Market Shares (%) 6.84 24.76 29.93 38.47
Source: Ofcom (2011b)
Total annual retail revenue for mobile networks in 2010 was about £15 billion and mobile call termination generated revenue of approximately £2.95 billion (Ofcom 2011c). As of 2003, Ofcom has consistently determined that the mobile retail market in the UK is e¤ectively competitive, and since the merger of Orange and T-Mobile has found no indication that competitive pressures have signi…cantly reduced (Ofcom 2011d). On the other hand, as noted by Armstrong and Wright (2009a), Ofcom has equally consistently
12These conditions were a revised network-sharing agreement with H3G UK and an o¤er to divest 15
MHz of spectrum at the 1800 MHz level.
ruled that each mobile network is a monopolist with respect to call termination on its own network, given that a call to someone’s mobile phone necessarily involves the call being terminated by the mobile network to which the person has subscribed.
The …xed-line sector had 33.3 million subscribers at the end of 2010, slightly less than a year previously. British Telecom’s (BT’s) share of …xed-line subscribers was 48.2%, followed by the cable operator Virgin Media with 14.7%, and others with 37%.15 Annual
revenues from …xed-line call and access services was about £9.2 billion. Fixed-to-mobile (FTM) calls accounted for 35% of total call revenues in 2010, while accounting for less than 10% of overall …xed call minutes. BT’s margin, or "retention" on FTM calls, i.e. the di¤erence between its FTM retail price and the mobile termination charge, was subject to regulation in 1999, but has been unregulated since 2003.
2.1
Mobile Call Termination Regulation
The regulation of mobile termination rates in the UK has generated huge amounts of reg-ulatory controversy, and been the subject of …ve competition commission enquiries and numerous court cases since its inception in 1998. In that year the then UK telecommuni-cations regulator, Oftel, proposed reductions in the …xed-to-mobile termination rates of the two largest mobile networks, BT’s Cellnet (the precursor to the current O2) and Voda-fone. These reductions were challenged by the mobile companies (with BT’s support), leading to an enquiry by the Monopolies and Mergers Commission (see MMC 1999), the precursor of the current Competition Commission.16 The MMC concluded that Cellnet’s
and Vodafone’s FTM termination rates were too high in relation to overall costs, and they were subsequently regulated with a price cap, reducing these charges in 1999 by approximately 33% to 11.7 ppm.
The expiry of this price cap in March 2002 led to an enquiry by the Competition Commission (see Competition Commission 2003) which upheld Oftel’s new price cap cov-ering all four mobile networks and both FTM and mobile-to-mobile (MTM) termination charges. Shortly before the 2002 enquiry, a …fth network, H3G, had entered the market, although this incipient network was excluded from the investigation. Subsequent decisions by Ofcom (the current UK telecommunications regulator) in 2004 and 2007 extended these regulations, progressively reducing both FTM and MTM termination rates, and by 2007 subjecting all …ve networks (including H3G) to MTR price cap regulation.
15The majority of these are "indirect access" providers which use BT´s …xed line network to o¤er
services via wholesale line rental and local loop unbundling.
16The enquiry did not include mobile-to-mobile (MTM) termination charges, nor the FTM termination
Table 2.2 shows the history of average mobile termination charges from 2001 to 2006 for all UK networks: termination charges approximately halved over this period due to tightened regulation.
Table 2.2. Average Mobile Termination Charges to 2006
2001 2002 2003 2004 2005 2006 All UK Networks (ppm, nominal) 11.1 10.7 9.9 7.9 5.9 5.5
Source: Ofcom (2007b), Figure 4.40
The regulated termination charges in Table 2.2 include two kinds of markup over es-timates of marginal or incremental termination costs. The …rst markup was designed to tax …xed-line callers to subsidize mobile network subscriptions in order to stimulate mobile network expansion. The second markup re‡ected an intended contribution to a mobile network’s …xed and common costs. The …rst markup was referred to as the “net-work externality surcharge", and was introduced after the Competition Commission’s 2002 enquiry (see Competition Commission 2003, pp. 225-252).17 In its 2008/09 enquiry,
following appeals of Ofcom’s 2007 MTR decision by BT and H3G, the Competition Com-mission revisited the issue and decided that a network externality surcharge was no longer justi…ed (see Competition Commission, 2009, Section 4).
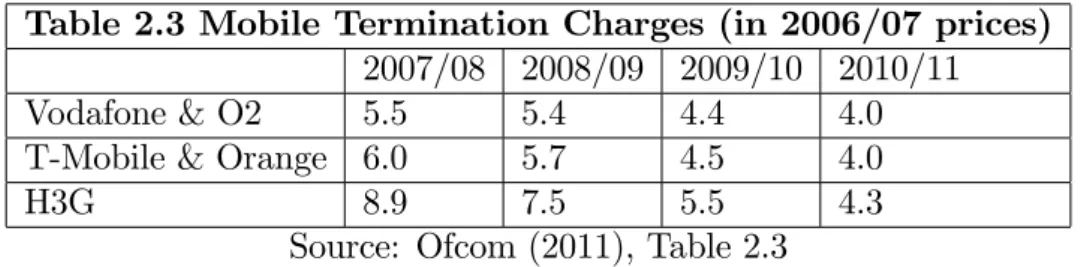
Table 2.3 shows the regulated MTRs of the …ve mobile networks from 2007/08-2010/11. These charges re‡ect di¤erences in the underlying costs for di¤erent mobile technologies using di¤erent spectrum bands. As a result, by 2010/11 the same charge was set for the 2G/3G companies (Vodafone, O2, T-Mobile and Orange), based on the average costs of a hypothetical e¢cient operator. H3G continued to receive a higher charge, recognizing the higher …xed costs it faced as a 3G-only entrant (Ofcom 2011, para 2.15).
Table 2.3 Mobile Termination Charges (in 2006/07 prices)
2007/08 2008/09 2009/10 2010/11 Vodafone & O2 5.5 5.4 4.4 4.0 T-Mobile & Orange 6.0 5.7 4.5 4.0
H3G 8.9 7.5 5.5 4.3
Source: Ofcom (2011), Table 2.3
As noted in the Introduction, until 2010/11 Ofcom regulated the mobile …rms’ MTRs using a fully-allocated network cost model to estimate "LRIC+". Following the European Commission’s 2009Recommendation, Ofcom changed its methodology with a proposal to
17Network externality surcharges have also been applied in Belgium, Greece, Italy and Sweden (Cullen
reduce MTRs to re‡ect its estimates of "pure LRIC". Table 2.4 shows the resulting price caps from 2010/11 to 2014/15. It also shows the recalculated charges and faster glide path proposed by the Competition Commission in February 2012 (see Competition Commission 2012), following appeals of Ofcom’s new pure LRIC-based charges by all four mobile networks and BT.
Table 2.4. Mobile Termination Charges (in 2008/09 prices)
2010/11 2011/12 2012/13 2013/14 2014/15 Ofcom 2011 4.18 (4.48) 2.69 1.74 1.12 0.72 CC 2012 4.18 (4.48) 2.29 1.25 0.67 0.65 Source: CC (2012) (charges in parentheses for 2010/11 refer to H3G)
As noted above, since 2002 the price caps for FTM and MTM termination rates have been set equal to each other, although there has been no regulatory constraint preventing the networks from setting di¤erent MTM and FTM termination charges. The actual FTM and MTM termination charges set by networks have always been equal to the maximum allowed charge, however.18
2.2
Prices and Call Volumes
Table 2.5 below shows the average pence per-minute retail prices for on-net and o¤-net MTM calls, as well as mobile-to-…xed (MTF) calls, from 2005 (see Armstrong and Wright 2009a and Harbord and Pagnozzi 2010 for further discussions of the evidence on this score). From 2007-2009, Ofcom stopped reporting separate …gures for o¤-net versus on-net call revenues and volumes, hence these …gures are absent.19
The decline in o¤-net MTM retail call prices over the period is no doubt partly, or largely, due to the reductions in termination charges documented in Tables 2.1 to 2.4 above. Despite the narrowing of the di¤erentials between o¤-net and on-net calls prices, the di¤erences remain signi…cant in percentage terms. Note that average on-net call prices have been consistently much lower than the corresponding MTRs, illustrating the oft-observed fact that mobile networks do not treat regulatory estimates of “LRIC+”as costs that need to be recovered from calls made on their own networks. In the absence
18Armstrong and Wright (2009a) provide theoretical arguments both for why and why not mobile
networks should want to set MTM charges lower than FTM charges, absent any regulatory constraints.
19It is a complicated and somewhat arbitrary task to give precise estimates for the prices of the various
of call externalities, theory predicts that the on-net/o¤-net price di¤erential will be equal to the di¤erence between marginal termination costs and the termination rate. Unless marginal termination costs are literally zero, this was never true in the UK according to Ofcom’s data.20
Table 2.5 Average price of mobile calls (ppm)
2005 2006 2009 2010 2011 (3rd quarter) Mobile to …xed calls 2.2 2.0 1.8
On-net MTM calls 4.1 3.5 1.5 1.4 1.3 O¤-net MTM calls 11.2 8.9 3.8 3.2 2.6 Price di¤erential, o¤-net minus on-net 7.1 5.4 2.3 1.7 1.3 Percent price di¤erential, o¤-net/on-net 63.4% 60.7% 60.3% 57.7% 50.3%
Source: Authors’ calculations from Ofcom (2007b) and Ofcom (2011c)
Table 2.6 shows that the relative volumes of o¤-net and on-net calls have been con-sistently unbalanced. On-net calls have concon-sistently accounted for more than 30% of all mobile-originated call minutes, while o¤-net call volumes have typically been only slightly below or above 30%. As noted by Armstrong and Wright (2009a, p. F275), with equal o¤-net and on-net charges and four roughly symmetric networks (i.e. prior to the merger of Orange and T-Mobile), we would expect o¤-net tra¢c to be approximately three times greater than on-net tra¢c, rather than the much lower volumes of o¤-net tra¢c observed in the data. The high prices for o¤-net calls relative to on-net calls shown in Table 2.5 is likely responsible for much of this imbalance in calling patterns.21
Table 2.6. Shares of types of mobile call minutes
2007 2008 2009 2010 2011 (3rd quarter) Mobile to …xed calls 27.93% 25.52% 26.21% 25.61% 25.41%
On-net MTM calls 32.03% 34.45% 34.75% 35.64% 32.73% O¤-net MTM calls 27.43% 27.14% 31.51% 30.47% 33.81% Ratio: On-net/o¤-net 1.17 1.27 1.10 1.17 0.97
Source: Authors’ calculations from Ofcom (2008) and Ofcom (2011c)
As found by our welfare analysis in Section 5.1 below, a major bene…t of reducing MTRs is to reduce (or eliminate) the allocative ine¢ciency caused by o¤-net charges which signi…cantly exceed marginal costs, and which constitute a barrier to calling subscribers on other networks.
20See Harbord and Pagnozzi (2010) for further discussion of this point.
21Armstrong and Wright (2009a) suggest that “closed user groups,” i.e. groups of subscribers who
Finally, Table 2.7 compares average FTM call prices versus average FTF call prices since 2005.
Table 2.7 Average prices of …xed-to-mobile calls (ppm)
2005 2006 2007 2008 2009 2010 FTM calls 11.49 10.98 11.55 12.51 13.26 13.35 FTF calls 1.51 1.48 1.51 1.49 1.54 1.55 Price di¤erential, FTM-FTF 9.98 9.50 10.04 11.02 11.72 11.80
Source: Authors’ calculations from Ofcom (2008) and Ofcom (2011c)
Observe that the average price di¤erential exceeds the FTM termination rate in every year, and by increasing amounts. Indeed, the price di¤erential has been increasing slowly as MTRs have been reduced, with only very small changes in the price of FTF calls. This has led to complaints by the mobile …rms that reductions in the FTM termination charge do not bene…t consumers, but merely transfer pro…ts from mobile companies to …xed-line operators (see Competition Commission 2012, Section 2). The lack of responsiveness of FTM prices to reductions in MTRs is di¢cult to explain, even if one assumes (as we do in our simulations reported in Section 5.1 below) that there is a single monopoly …xed-line operator.
3
A Model of the UK Mobile Communications
Mar-ket
Our model of the UK mobile communications market is a generalization of the network competition models of La¤ontet al. (1998) and Carter and Wright (1999)(2003) to include many asymmetric networks and calls to and from a …xed network. For more details on the theory see Hoernig (2010).22 We extend the Hoernig (2010) model by explicitly including
a …xed network and by determining the market equilibrium following the merger of two networks which retain their separate “brands”, or identities, as described below in Section 3.3.23
22Several papers have analysed network competition with more than two networks. Symmetric networks
are assumed by Calzada and Valletti (2008) and Armstrong and Wright (2009b). Dewenter and Haucap (2005) consider more than two asymmetric networks, but can only solve for the resulting per-minute call prices. Closest to Hoernig (2010) is Thompson, Renard and Wright (2007), which uses a similar demand speci…cation and considers an arbitrary number of networks. However, networks in their model do not price discriminate between on-net and o¤-net calls, which signi…cantly reduces the complexity of the modeling. Even so, no closed-form solution for the equilibrium is derived.
23This is the relevant case as Orange and T-Mobile have maintained their individual brands following
3.1
Model Setup
Networks: We assumen 2mobile networks of di¤erent sizes and one …xed network.24
Networks face a given …xed cost per subscriber and constant marginal costs for originating and terminating calls. All networks are interconnected and terminate incoming calls at prices given by their respective termination rates. We consider imperfect competition in the mobile market, with consumers perceiving mobile networks as providing substitutable, horizontally di¤erentiated services in a generalized Hotelling fashion, as described below. Consumers perceive …xed and mobile networks as providing non-substitutable services, however, so there is no strategic competition between …xed and mobile networks.
Each mobile network’s subscriber market share is denoted by i >0, i= 1; :::; n;with
Pn
i=1 i = 1. Mobile networkiincurs a yearly …xed cost per customer offi, and has on-net
costs of cii =coi+cti per call minute, where the indices o and t stand for origination and termination, respectively. The mobile termination rate (MTR) on networkiis denotedai, so the per-minute cost of an o¤-net call from network ito networkj 6=i is cij =coi+aj. The …xed network’s termination rate (FTR) af is slightly above ctf, the cost of call
termination on the …xed network. Hence the cost of a call from mobile network i to
the …xed network is cif = coi +af. The average cost of a call from the …xed to the
mobile networks is cf m = cof +a, where a = Pni=1 iai is the market-share weighted
average MTR. On the …xed network, we only consider calls between the …xed and mobile networks and neglect other services , including on-net …xed calls.
Tari¤s: Mobile networks o¤er their retail customers a ‘bundle’ of mobile access, on-net
calls, and o¤-net calls to other mobile networks and to the …xed network. Each mobile network i charges its subscribers an annual subscription fee Fi,25 and per-minute call
prices of pii for on-net calls and pij for o¤-net calls to network j 6= i. We assume that mobile networks charge uniform o¤-net prices to other mobile networks, i.e. pij =pik for
j; k 6=i. The price of calls to the …xed network is denoted pif. We do not consider other
services o¤ered by mobile networks, such as international calls, SMS and data services, as their interaction with mobile voice calls is not clear and is likely to evolve over time.26
The …xed network charges a per-minute pricepf m, which we assume to be the monopoly
price over a total marginal cost of cf o+a. This assumption is conservative for our
pur-24There are a number of …xed-line networks in the UK, including BT, Virgin Media and Cable and
Wireless. BT’s share of subscribers in 2008 exceeded 60% (Ofcom 2009b, Table 2). We assume a single …xed-line network here, which sets FTM prices as described immediately below.
25Yearly subscription fees are used without loss of generality in order to simplify notation and because
the time frame under consideration is one calendar year.
poses because it implies that only half of any decrease in MTRs is passed through to the FTM call price.27
Consumers: We assume a …xed number ofM subscribers in the mobile market, andN
subscribers on the …xed network. Each consumer makes calls to all potential recipients on the …xed and mobile networks with equal probability, so in the absence of price di¤erentials we would have a balanced calling pattern. The demand for calls di¤ers between subscribers on mobile networks and on the …xed network, however.
Subscribers receive a …xed utilityAi from being connected to network i;28 utility from
making calls, as a function of call length and the number of calls made; and utility from receiving calls independently of their origin (so there is a call externality). Speci…cally, the utility derived from making or receiving a call of lengthqisu(q)or u(q), respectively,
where0 1measures the strength of the call externality. Given a per-minute pricep,
consumers demand calls of lengthq(p), with the resulting surplus ofv(p) = u(q(p)) pq(p)
and q(p) = v0(p). In the following we will simplify notation by denoting qij = q(pij),
uij =u(qij), vij =v(pij) etc.
A single consumer’s surplus from a given tari¤ is the sum of the net utility from making and receiving calls minus the subscription fee. Consumers make their choice of network based the net surplus resulting from their own personal preferences for speci…c networks and the tari¤s on o¤er. A client of networki obtains the following surplus, before taking network preferences into account:
wi = M n
X
j=1
j(vij + uji) +N(vif + uf i) Fi
= M
n
X
j=1
jhij +N hif Fi;
wherehij = (vij+ uji)andhif = (vif+ uf i). In matrix notation, this can be written as
w=M h +N hf F;
where we have introduced the matrix h = (hij)n n and the vectors w = (wi)n 1, =
( i)n 1,hf = (hif)n 1 and F = (Fi)n 1.
27Ofcom (2007, A19.26) assumes that the FTM price involves a …xed retention above cost. This would
imply a larger pass-through of 1 and larger increases in welfare due to lower MTRs.
28Only the pairwise di¤erencesAi Ajcount and can be calibrated, therefore we normalizemin
iAi= 0.
Network preferences, market shares and consumer surplus: We assume that
consumers consider mobile networks as o¤ering di¤erentiated products in Hotelling (1929) fashion, generalized to n …rms as in Hoernig (2010), and allowing for asymmetric customer valuations as in Carter and Wright (1999). Each network is located at one of n nodes,
each of which is connected by a Hotelling line to all other nodes. Consumers are uniformly distributed over thesen(n 1)=2lines. This model of preferences was chosen so that each network competes directly with every other network for consumers (because there is a line of consumers connecting every two networks), in contrast to the well-known Salop model where each …rms competes directly only with two other …rms.
Assuming a line length of2=[n(n 1)]and …rmsiandj at the endpoints, the consumer
at locationxij will be indi¤erent between networksi and j if
wi+Ai txij =wj +Aj t 2
n(n 1) xij ;
wheret >0indicates the strength of horizontal preferences. Thus his location is given by
xij = 1
n(n 1)+ 1
2t(wi+Ai wj Aj):
Networki’s market share is
i =
X
j6=i
xij = 0i+
X
j6=i
(wi wj);
where = 1=(2t), and 0i = 1=n+
P
j6=i(Ai Aj)captures the ex-ante asymmetries due
to consumers’ valuations of di¤erent networks.29 Letting B = (bij)
n n, with bii =n 1
and bij = 1 for j 6=i, we obtain
= 0+ Bw= 0+ B(M h +N hf F);
which can be rewritten as
=G 0+ H(N hf F); (1)
whereG= (I M Bh) 1 and H =GB = (Hij)n n. In the presence of call externalities,
this is still an implicit condition for market shares, since for >0bothGand H depend indirectly on through o¤-net prices.
29Existence and stability of equilibrium require that networks be su¢ciently di¤erentiated, or that
LettingA= (Ai)n 1, aggregate consumer surplus on mobile networks, including
trans-port cost, is given by
S = M 0(w+A) M n
X
i=1
X
j6=i
Z xij
0
tzdz
= M 0(w+A) M
4
n
X
i=1
X
j6=i
x2
ij:
Consumer surplus in the …xed telephony market (FTM and MTF calls) is
Sf =N M n
X
i=1
i(vf i+ uif) =N M 0gf;
where gf i =vf i+ uif and gf = (gf i)n 1.
Pro…ts and welfare: Networki’s pro…ts are given by
i =M i M
n
X
j=1
jRij +N Qi+Fi fi
!
;
where Rii = (pii cii)qii for on-net calls andRij = (pij cij)qij + (ai cti)qji for o¤-net calls to and from other mobile networks. Furthermore, Qi = (pif cif)qif + (ai cti)qf i
are the pro…ts from MTF calls and FTM termination. Joint pro…ts of all mobile networks can be written as
=M 0(M R +N Q+F f);
where R= (Rij)n n, Q= (Qi)n 1 and f = (fi)n 1.
The pro…ts of the …xed network from FTM calls are
f =N M
n
X
i=1
i(pf m cf o ai)qf m =N M(pf m cf o a)qf m:
Total welfare is then
W =S+Sf + + f:
3.2
Pre-Merger Equilibrium
network pro…ts. In the following we will the state equilibrium prices and …xed fees. The corresponding derivations for the pre- and post-merger cases can be found in Annex A.
In equilibrium, …rms charge the following call prices:
pii= cii
1 + ; pif =cif; pij =
P
l6=i lcil
1 (1 + ) i
; j 6=i: (2)
That is, as usual e¢cient on-net prices are set below cost in order to internalize the call externality; MTF prices are set at cost; and o¤-net prices are set on the basis of perceived o¤-net cost. These o¤-net prices increase with network size and the strength of the call externality.
Firm i’s equilibrium …xed fee is
Fi =fi N Qi+M n
X
j=1
j Rij^ Rij ; (3)
where
^
Rii = 1
M Hii n
X
j=1
Hji
HiiRij; Rij^ = 0 8 j 6=i:
Finally, with R^ = ( ^Rij)n n, the equilibrium …xed fees can be written as
F =f N Q+M( ^R R) ;
which, after substitution into (1), …nally gives rise to the equilibrium condition on market shares
[I M B(h+R R^)] = 0+ B[N(hf +Q) f]:
In the presence of call externalities the left-hand side depends on also throughh; R;and
^
R and thus this condition must be solved numerically.
Finally, after substitution of the equilibrium …xed fees the sum of equilibrium pro…ts in the mobile market can be written as
=M2 0R :^
3.3
Post-Merger Equilibrium
After the merger, non-merged …rmsjmaximize their pro…ts j, while the …rm resulting
from the merger of …rmsiandkmaximizes the sum of pro…ts i+ k. In equilibrium,
non-merged …rms continue to set equilibrium call prices as in (2). The non-merged …rm charges the same on-net and MTF prices as before, but di¤erent o¤-net prices:
pik = coi +ctk
1 + ; pij =
P
l6=i;k lcil
1 (1 + ) ( i+ k)
; j 6=i; k:
Thus the merged brands charge the e¢cient price for calls to each other, while they set higher o¤-net call prices to other networks based on the joint market share (rather than individual market shares).
As concerns …xed fees in the post-merger equilibrium, they continue to be given by the expression in (3) for the non-merged …rms. Note, though, that the equilibrium market shares and call prices have changed and thus the latter …xed fees will di¤er from the pre-merger values. In fact, they will be higher due to unilateral e¤ects. As for the merged …rms i; k, we have
^
Rii =
Hkk
M
Pn
j=1(HkkHji HkiHjk)Rij HiiHkk HkiHik ;
^
Rik =
Hki
M +
Pn
j=1(HkkHji HkiHjk)Rkj HiiHkk HkiHik ;
and Rij^ = ^Rji = 0 for allj 6=i; k. The fact that Rik^ 6= 0 for the merged …rms translates
the internalization of the competitive externality that the choice of …xed feeFi imposes on network k. This internalization is the primary consequence of the joint setting of prices on both merged …rms: Fixed fees will be set higher because there is no point in stealing either brand’s clients. All further expressions for market shares and pro…ts are as above in the pre-merger case.
4
Model Calibration
The model described in Section 3 has been calibrated with data from Ofcom’s Communi-cations Market 2011 report (Ofcom 2011c, Chapter 5) unless indicated otherwise, where CMx indicates Ofcom’s …gure numbered 5:x.30 This report contains the data for 2010,
the …rst calender year after the merger of Orange and T-Mobile. As we describe in detail immediately below, the model has been calibrated to observed network costs, subscriber
30These data are available in Excel format at: http://stakeholders.ofcom.org.uk/binaries/research/cmr/cmr11/
numbers, market shares, call quantities and total revenues. The calibration then follows several successive steps, deriving: 1) demand parameters; 2) horizontal di¤erentiation parameters; and …nally 3) preference asymmetry parameters. It takes explicitly into ac-count that both Orange and T-Mobile are controlled by the same owner while remaining separate brands.
The parameter measuring the strength of call externalities ( in our nomenclature) cannot be derived from the data, hence is varied between …ve levels, from zero (i.e. no call externalities) to the maximal value of 1 (i.e. the receiving party receives the same utility as the sending party). Arguably, a value of at least 0.5 is realistic, even if we allow for some “internalization” of call externalities between individuals in stable calling relationships with one another.31 All other parameters have been calibrated for each
speci…c value of the call externality .
All values are given in 2010 prices, as these correspond to the scaling of the available data.
Costs on mobile and …xed networks: We assume a long-run marginal or
incre-mental cost of originating and terminating calls on mobile networks of 0.75 ppm in 2010 prices, corresponding to Ofcom’s estimate of “pure LRIC” of 0.72ppm in 2008/09 prices.32
Marginal costs of origination and termination on the …xed network are taken from Of-com (2009c, Table A2.10) which reports termination costs of 0.198 ppm and origination costs of 0.212 ppm. We assume an average level for BT’s regulated termination charge of 0.21 ppm,33 and use the 2010 mobile termination rates of 4.35 ppm for Vodafone, O2,
Everything Everywhere (Orange and T-Mobile), and 4.66 ppm for H3G for the calibration (4.18ppm and 4.48ppm in 2008/09 prices).
Ofcom (2007, A19:18) assumes …xed costs per mobile subscriber of £95.38 per year. We allow for no exogenous …xed costs in our model since we only wish to include the avoidable per subscriber costs faced by networks, which are largely composed of handset subsidies. The value of the latter is determined by the level of …xed fees in our model,
31See Harbord and Pagnozzi (2010) for a discussion. As we relate below in Section 6, a value of about
0.75 makes simulated pre-merger market shares …t quite well with observed 2009 values. While this seems a reasonable estimate, more evidence is needed to claim that takes on a speci…c value.
32Prices have been adjusted to 2010 values using the RPI data available at http://www.ons.gov.uk/ons/
datasets-and-tables/data-selector.html? cdid=CHAW&dataset=mm23& table-id=2.1, averaged over the corresponding calender or business (April to May) year.
33Ofcom (2009a), Paragraph 2.18, states: “Wholesale FCT charges are currently no more than 0.25
which are themselves a function of the intensity of competition between the networks, and hence the levels of the MTRs. In order to avoid this endogeneity problem we assume that exogenous per-customer …xed costs are zero.34
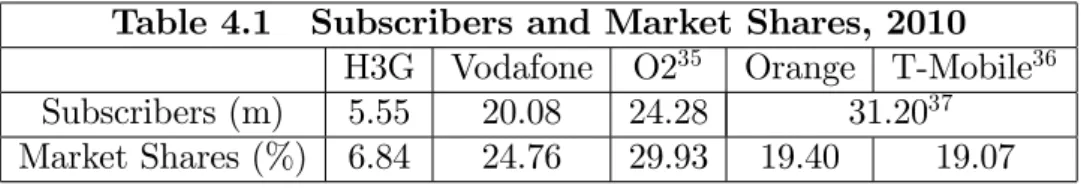
Subscriber market shares: Mobile subscriptions by network operator for 2010 have
been taken from CM54. These result in the subscriber market shares speci…ed in Table 4.1 below. The total number of mobile subscribers in 2010 was 81.165 million (CM16). After the merger that occurred at the beginning of 2010, Orange and T-Mobile continued to function as separate brands under its joint owner Everything Everywhere. Therefore we assume prices for both are set jointly, while consumers continue to perceive them as separate brands.
Table 4.1 Subscribers and Market Shares, 2010
H3G Vodafone O235 Orange T-Mobile36
Subscribers (m) 5.55 20.08 24.28 31.2037
Market Shares (%) 6.84 24.76 29.93 19.40 19.07
The mobile virtual network operators (MVNOs), such as Virgin Mobile and Tesco Mobile, are not included as independent …rms in our analysis. Tesco Mobile is a 50/50 joint venture between Telefonica O2 UK and Tesco plc, and hence acts as a retail arm of O2. Virgin Mobile was originally formed as a joint venture between T-Mobile and the Virgin Group, however in January 2004 the Virgin Group bought out T-Mobile and subsequently became part of the Virgin Media Group in 2006.38
Utility and demand parameters: For each value of the call externality parameter ,
we used the marginal costs and market shares reported above to compute predicted call prices from (2). We have then calibrated linear demand functionsq(p) = a bpfor
mobile-to-mobile (MTM) calls by matching these predicted prices with the observed demand of
Q= 82;602 million MTM call minutes per year (CM51) fromM = 81:165million mobile
network subscribers; assumed demand elasticities; and using the model’s predictions of the relative proportions of on-net and o¤-net calls. For better readability these demand parameters are scaled in terms of call minutes to one million other subscribers.
34Any truly exogenous …xed cost per customer does not a¤ect our welfare and pro…t comparisons since
it would cancel out when di¤erences are taken.
35Includes up to 2.5m Tesco Mobile subscribers. 36Includes about 4m Virgin Mobile subscribers.
37Ofcom only reports the joint subscriber number. We have attributed subscribers proportional to
2009 values.
Setting Q equal to total predicted MTM call minutes, we have
Q=M2 5 X
i;j=1
i j(a bpij) =M2(a bp~);
with the average price p~=P5i;j=1 i jpij. The market price elasticity of demand is
"= M
2
~
pb Q :
Combining both expressions, we …nd
a= 1
M2 (1 ")Q; b= "Q M2p~;
where the latter depends on through the average pricep~.
We assume an elasticity of demand for mobile-originated calls of "= 0:5. This value
is consistent with estimates found in the recent literature and with those presented to the UK Competition Commission in 2003.39
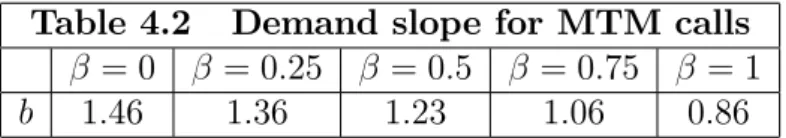
We obtain a = 18:81 and the following values of the demand slope depending on the strength of the call externality:
Table 4.2 Demand slope for MTM calls
= 0 = 0:25 = 0:5 = 0:75 = 1
b 1:46 1:36 1:23 1:06 0:86
The demand parameters for mobile-to-…xed calls were calibrated similarly, from the same elasticity, N = 33:404 million subscribers on the …xed network (CM1), and a total demand of 31,999 million MTF minutes (CM51). This results in amf = 17:7 and bmf =
6:15.40
Subscribers on the …xed network demanded 11,852 million FTM call minutes per year (CM42), with a corresponding revenue of £1,528m (CM39).41 Under the conservative 39Dewenter and Haucap (2007) have estimated demand elasticities for mobile-originated calls in Austria.
They …nd …rm-speci…c short-run elasticities between -0.26 and -0.40, and long-run elasticities between -0.46 and -1.1. Various estimates of demand elasticities for mobile-originated and …xed-to-mobile calls were presented to the UK Competition Commission’s ‘calls to mobiles’ inquiry in 2003 (see Competition Commission, 2003, Table 8.7). These ranged from -0.48 to -0.8 for mobile-originated calls, and from -0.08 to -0.63 for …xed-to-mobile calls. Jerry Hausman submitted estimates for the own-price elasticity of mobile-originated calls of between –0.5 to –0.6 for the USA. Ofcom (2007) stated that a reasonable range for the own-price elasticities was between –0.2 and –0.4 for both mobile-originated and …xed-to-mobile calls, and used the value -0.3 (Figure A19.2).
40The values of the demand parameters for MTF calls actually have no e¤ect at all on our results since
the price and quantity of these calls remain the same in all scenarios. We present their calibration here for completeness only.
assumption that the …xed network sets a separate pro…t-maximizing price for FTM calls, i.e. chooses the monopoly price given the underlying cost of origination on the …xed network and termination on mobile networks, the linear demand function calibrated on FTM call minutes leads to the demand parameters af m = 11:16and bf m= 0:53.
Horizontal di¤erentiation parameter: For a given call externality and the
re-sulting demand parameters, we have calibrated the di¤erentiation parameter of the underlying Hotelling model such that the total revenue from mobile subscriptions and metered calls is equal to £10,547m (CM47). Total revenue is given by
Revenue=M 5 X
i=1
i M
5 X
j=1
jpijqij+N pmf iqmf i+Fi
!
;
where the calibration uses the post-merger expressions for equilibrium …xed fees to deter-mine . These …xed fees take into account that they are set on a joint basis for Orange and T-mobile.
Since revenues depend nonlinearly on this condition is solved numerically.
Table 4.3 Di¤erentiation parameter
= 0 = 0:25 = 0:5 = 0:75 = 1
0.000543 0.000530 0.000510 0.000480 0.000427
stab 0.004834 0.002824 0.001834 0.001213 0.000762
Calibrated values for have always been found in the stable range, i.e. < stab,
where the latter has been determined as indicated in Hoernig (2010).42
Asymmetry parameters: Finally, given the network asymmetry parameters have been determined, up to an arbitrary normalization which we choose to be miniAi = 0.
That is, each Ai represents the additional amount per year that a subscriber would be
willing to pay for switching to …rmi, as compared to the …rm with the lowest valuation,
if all tari¤s were identical.
Letting E be the (5 1)-vector of ones, we have 0 =E=5 + BA, or
BA= 1( 0 E=5) =
1
( E=5) Bw:
42This check for stability in expectations is essentially a consistency check, but without further
The only unknown at this stage isA, but it cannot be determined directly becauseB has
less than full rank. Letting A= ~A E~a0 where E0A~= 0 and ~a0 = min ~A, we have
BA = (5I EE0) A~ Ea~0
= 5E~a0 5E~a0+ 5 ~A EE0A~= 5 ~A:
ThusA~=BA=5, from which the asymmetry parametersA can be determined as follows:
Table 4.4 Asymmetry parameters (£ per year relative to H3G)
= 0 = 0:25 = 0:5 = 0:75 = 1
Vodafone 147 147 149 153 164
O2 188 188 190 194 206
Orange 142 141 139 135 129 T-Mobile 140 139 137 133 126
With these asymmetry parameters the model replicates the 2010 (post-merger) market shares reported in Table 4.1.
5
The E¤ects of Reducing MTRs
Section 5.1 reports our model predictions. Section 5.2 discusses these results and considers some longer-run implications of reducing MTRs.
5.1
Model Predictions
This section reports the predictions of our calibrated model for call externality parameters of 0, 0.25, 0.5, 0.75 and 1, respectively. All results are reported in £ million per calendar year in 2010 prices. Increases of the variables under consideration, as compared to the base scenario are given by positive values and decreases by negative values.
In our base scenario, mobile networks’ termination rates are set at Ofcom’s “LRIC+” levels for 2010. These were 4.66 ppm for H3G and 4.35 ppm for the four other mobile operators, in 2010 prices. This base scenario is compared with three other scenarios with MTRs reduced to: (i) Ofcom’s current estimate of “pure LRIC”; (ii) the average price of termination on the …xed network; and (iii) zero, i.e. Bill & Keep.
Aggregate e¤ects: As shown in Table 5.1, total welfare, i.e. the sum of social welfare
in the mobile and the …xed markets, increases signi…cantly under all three alternative scenarios for reducing MTRs. The extent of the increase depends upon the size of the call externality parameter, and exceeds £3 billion per year when receiver bene…ts are large (i.e. >0:75).
Table 5.1 Change in Welfare Over “LRIC+” Pricing
= 0 = 0:25 = 0:5 = 0:75 = 1
Pure LRIC 992 1432 1998 2807 4214 Reciprocal with Fixed 1075 1543 2144 2996 4454 Bill & Keep 1104 1580 2190 3055 4527
When = 0 (no call externalities), the increase in aggregate welfare is caused by
aligning MTRs more closely to marginal costs, since above-cost MTRs distort call prices upwards and call quantities downwards. In the absence of a …xed network, LRIC-based pricing would always result in the highest welfare increase, since MTM calls are priced at true network cost. Since FTM calls are priced above cost, however, total welfare is further increased as MTRs are reduced below “pure LRIC” since this reduces the monopoly pricing distortion in FTM calls.
When call externalities matter, welfare-maximizing MTRs are always below marginal cost for two reasons. First, in the absence of strategic e¤ects, below-cost MTRs induce networks to “internalize” call externalities by setting o¤-net prices below cost. Second, since call externalities create strategic incentives for mobile …rms to increase their o¤-net prices, reducing MTRs below marginal cost mitigates this e¤ect, which is particularly strong on the merged networks.43 Hence Bill & Keep increasingly dominates LRIC in
welfare terms as we increase from zero to one.
As discussed in more detail in Section 5.2, lowering MTRs reduces network e¤ects and relaxes price competition in the mobile market. This can result in lower levels of mobile consumer surplus for small values of . Consumer surplus in the …xed market always increases, however, due to the reduction in the FTM call price. We …nd that in the UK market the latter e¤ect dominates and aggregate consumer surplus increases. For large values of it increases by more than £1.2 billion in every scenario (see Table 5.2).
43See Armstrong and Wright (2009b), Berger (2004) (2005), Hoernig (2008), and Harbord and Pagnozzi
Table 5.2 Change in Consumer Surplus Over “LRIC+” Pricing
= 0 = 0:25 = 0:5 = 0:75 = 1
Pure LRIC 228 513 825 1177 1540 Reciprocal with Fixed 219 517 843 1208 1581 Bill & Keep 212 514 843 1210 1584
Finally, the sum of pro…ts in the …xed and mobile markets increases in all scenarios for any value of (Table 5.3).
Table 5.3 Change in Pro…ts Over “LRIC+” Pricing
= 0 = 0:25 = 0:5 = 0:75 = 1
Pure LRIC 764 919 1173 1631 2673 Reciprocal with Fixed 857 1026 1300 1789 2873 Bill-and-Keep 892 1066 1347 1845 2943
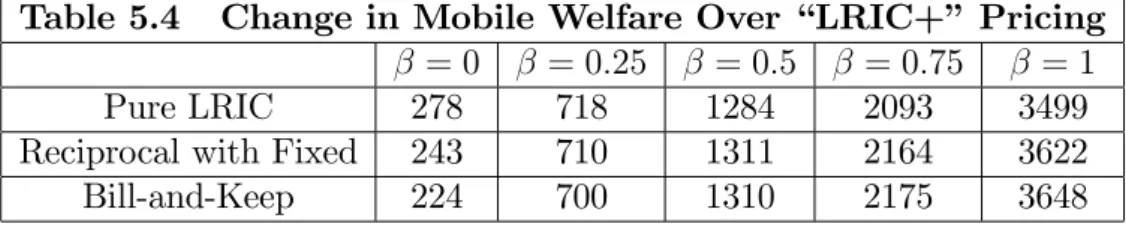
Mobile telephony: We now consider the mobile market in isolation, that is, the e¤ect of reducing MTRs on consumer surplus, welfare and pro…ts in the mobile market only. As shown in Table 5.4, welfare increases in the mobile market for all values of .
Table 5.4 Change in Mobile Welfare Over “LRIC+” Pricing
= 0 = 0:25 = 0:5 = 0:75 = 1
Pure LRIC 278 718 1284 2093 3499 Reciprocal with Fixed 243 710 1311 2164 3622 Bill-and-Keep 224 700 1310 2175 3648
The lower increase in welfare when = 0 is caused by the reduction in …xed-to-mobile
transfers. With higher levels of call externalities, this e¤ect is outweighed by the reduction in o¤-net call prices and the resulting increase in o¤-net call volumes (i.e. the "o¤-net pricing e¤ect"), induced by the lower MTRs. With very high call externalities welfare in the mobile market increases by more than £3 billion per annum.
Table 5.5 Change in Mobile Consumer Surplus Over “LRIC+” Pricing
= 0 = 0:25 = 0:5 = 0:75 = 1
Pure LRIC -10 275 587 939 1302 Reciprocal with Fixed -59 240 566 930 1304 Bill-and-Keep -81 220 549 916 1291
For higher values of these e¤ects are outweighed by the o¤-net pricing e¤ect noted above, and consumer surplus increases whenever 0:25. That is, the additional surplus
created by the reduction in o¤-net call prices is at least partly retained by consumers, compensating for the countervailing negative e¤ects.44 Still, consumer surplus in the
mobile market is higher under Pure LRIC than under Reciprocity or Bill & Keep. Mobile networks’ pro…ts, on the other hand, increase for all values of (see Table 5.6) due to the competition e¤ect. Reduced FTM transfers do not a¤ect pro…ts since the waterbed e¤ect is always "full" in our model.
Table 5.6 Change in Mobile Pro…ts Over “LRIC+” Pricing
= 0 = 0:25 = 0:5 = 0:75 = 1
Pure LRIC 288 443 697 1155 2197 Reciprocal with Fixed 301 471 745 1234 2318 Bill-and-Keep 305 480 761 1259 2356
Fixed telephony: Finally, we consider the e¤ects of reducing MTRs on the …xed mar-ket. The model includes pro…ts and consumer surplus from FTM calls, and also consumer surplus from receiving MTF calls. Fixed termination rates are set close to cost, so there are almost no termination pro…ts. The estimated values for changes in welfare, consumer surplus and pro…ts in the …xed market do not depend on the size of the call externality, since the mobile-to-…xed price is independent of the level of MTRs.
Welfare in the …xed market increases signi…cantly, for two reasons: First, transfers to mobile networks are reduced, and second, FTM call quantities are brought closer to their e¢cient level.
Table 5.7 Change Over “LRIC+” Pricing
Welfare Consumer Surplus Pro…ts Pure LRIC 714 238 476 Reciprocal with Fixed 833 278 555 Bill-and-Keep 880 293 586
Due to the monopoly pricing assumption, the …xed network retains most of this welfare increase in the form of increased pro…ts (see Section 3).
5.2
E¤ects of Reducing MTRs: Discussion
Our calibrated welfare model provides a rigorous and quanti…able approach to assessing the likely e¤ects of changes in MTRs, taking account of call externalities, calls to and from the …xed network, and a realistic number of …rms. Our results show that although consumer surplusmay decrease in the mobile market considered in isolation when MTRs
are reduced, overall welfare, consumer surplus and …rms’ pro…ts increase in the telecom-munications market as a whole, for all values of the call externality parameter. Depending on the strength of call externalities, our model predicts welfare improvements of approxi-mately £1 to £4 billion per annum, with Bill & Keep resulting in the greatest increase in overall welfare. Inclusion of the …xed-line operator and call externalities in the analysis is thus indispensable to assessing the economic e¤ects of reductions in MTRs.
The results of our analysis qualify, or even contradict, some conclusions reached in the recent literature. We discuss these issues in Section 5.2.1 below. Our model also omits certain longer-run e¤ects in assuming that the size of the market (i.e. the total number of mobile subscribers) and the structure of retail prices (i.e. "calling-party-pays") remain unchanged as MTRs are reduced. We consider these issues in Section 5.2.2.
5.2.1 Short-Run Issues
Waterbed and tari¤-mediated network e¤ects: A number of recent papers have argued that reductions in MTRs will necessarily reduce consumer surplus, and possibly welfare, in the mobile market, and for two reasons. First, a …xed-to-mobile termina-tion rate above cost results in a ‡ow of terminatermina-tion pro…ts to mobile networks, some or all of which is passed on to mobile subscribers via the “waterbed” e¤ect. Hence mo-bile subscribers should prefer …xed-to-momo-bile termination rates set at the monopoly (i.e. pro…t-maximizing) level. As Armstrong and Wright (2009a, p. F286) put it, “high FTM termination charges are a means of transferring surplus from …xed callers to mobile re-cipients”.
Second, mobile subscribers can also bene…t from above-cost mobile-to-mobile termi-nation rates, since these make o¤-net calls more expensive than on-net calls, creating network e¤ects which favour larger networks. This intensi…es competition between net-works to attract subscribers, which reduces their equilibrium subscription charges. The much-cited result is that equilibrium consumer surplus on mobile networks is increasing in the level of the mobile-to-mobile termination rate (Gans and King, 2001; Armstrong and Wright, 2009a).45
While these arguments have been much aired in recent regulatory debates, they are subject to a number of important caveats. The argument with respect to …xed-to-mobile termination rates is incomplete in two important respects. First, as observed by Arm-strong and Wright (2009a, p. F284), even if all …xed-line subscribers have a mobile phone, high termination rates would still create an allocative ine¢ciency, and hence the gain to mobile subscribers from low subscription charges is always outweighed by the welfare loss on the …xed network from high …xed-to-mobile termination rates. Since most telephone subscribers use both …xed and mobile networks, the increase in economic e¢ciency and welfare achieved by aligning MTRs more closely with marginal costs bene…ts telephony users in general.
Second, the argument loses much of its force when call externalities, or receiver ben-e…ts, matter. To see this, note that with call externalities the total surplus created on a mobile network by a …xed-to-mobile call can be written as
sf m = (a ct)qf + u(qf);
where a is the …xed-to-mobile termination rate, ct the marginal cost of termination, and qf the length of the call. An increase in a above marginal cost increases the pro…ts of the
mobile network, some or all of which is passed on to mobile subscribers via the waterbed e¤ect, but simultaneously reduces the utility received by the mobile network’s subscribers from …xed-to-mobile calls through reducing qf. With a high ratio of receiver to sender bene…ts (i.e. the call externality parameter in our model), the latter e¤ect outweighs the former and hence welfare on mobile networks becomes a decreasing function of the level of MTRs.46;47
The argument that above-cost, mobile-to-mobile termination rates bene…t mobile con-sumers is also incomplete. As demonstrated by Hoernig (2010), it is only necessarily true in models with at most two mobile networks. For n 2 symmetric networks and generic
j 6=i, consumer surplus becomes
CS = n 2
n (Rij +hij)
1
n(n 1)hij +const;
where const does not depend on the o¤-net price. Evidently, the …rst term only arises
with n >2 networks. Hoernig then shows that consumer surplus decreases in the o¤-net
on below-cost mobile-to-mobile termination charges, and that such an agreement would harm mobile subscribers who prefer the more intense competition created by higher MTRs.
46See Armstrong and Wright (2009b) and Harbord and Pagnozzi (2010, Section 5.1) for further
discus-sion.
47A third caveat is of course that the argument for high …xed-to-mobile termination rates depends
price if
n > n( ) = 3
2 +
1 2
s
1 + 4 + 1="
+ (cij cii)=cij:
Demand elasticities " <1 are su¢cient for n( ) to be decreasing in the strength of call
externalities, i.e. if the elasticity of call demand is low then stronger call externalities make it more likely that consumer surplus decreases with higher o¤-net prices. With n > n
networks, although a reduction in the mobile-to-mobile termination rate still mitigates network e¤ects, and hence relaxes competition between mobile networks for market share, the loss in consumer surplus due to fewer o¤-net call minutes dominates.
The upshot is that it is an empirical question whether a reduction in …xed-to-mobile and mobile-to-mobile termination charges will result in an increase or a decrease in welfare and consumer surplus on mobile networks considered in isolation, especially in markets with more than two …rms. In our calibrated results for the UK market, when call exter-nalities are not insigni…cantconsumer surplus and welfare increase in both the mobile and …xed markets. Hence, the theoretical trade-o¤ between increasing welfare and maintaining
consumer surplus in the mobile market disappears once call externalities and a realistic number of networks are taken into account.
Fixed-to-mobile substitution: Our welfare model treats …xed and mobile networks
as if they operated in entirely separate markets, with no competitive interaction either at the level of calls or subscriptions. That is, we have not allowed for any substitution between …xed and mobile calls, and nor have we have considered whether changes in mobile termination rates might a¤ect the overall numbers of subscriptions to …xed versus mobile networks.48
Recent data indicates that subscriptions to …xed networks are relatively price inelas-tic,49 and according to Ofcom (2009d, Fig. 4.62, p.248), more than 80% of all UK
house-holds subscribed to both …xed and mobile services in 2009.50 Hence the assumption of no
competitive interaction at the level of access or subscriptions can probably be justi…ed. Consumers who subscribe to both mobile and …xed networks, however, can choose between the two types of calls, depending on which is cheaper and on whether or not callers have a …xed phone available when they want to place a call. Armstrong and Wright (2009a, Section 3.3) model this form of FTM substitution by assuming that calls
48In the next section we consider how changes in mobile termination rates might a¤ect the numbers of
subscribers to mobile networks considered in isolation.
49See Briglaueret al. (2011) and Vogelsang (2010).
50This …gure fell to 78% in 2010 (see Ofcom 2010b, Fig. 5.67), so a small amount of FTM substitution
made on the FTM demand curve can originate on either …xed or mobile networks, and that consumers will always choose the lower-cost form of communication. That is, they assume that FTM and MTM calls are perfect substitutes and that callers are never “on the move”.
In our calibrated model, the FTM price is always above the highest equilibrium o¤-net price. Thus our results are consistent with the possibility of call substitution between FTM and MTM calls if we interpret the FTM calls observed in the data as calls made by customers of the …xed network who do not have access to a mobile phone when they place their call. Thus explicitly modeling FTM substitution would not change our results.
5.2.2 Long-Run E¤ects
Market expansion: Mobile operators in Europe have long argued that high MTRs result in mobile …rms subsidizing connection and acquisition costs for new subscribers, via the waterbed e¤ect, and that this leads to market expansion which bene…ts new and existing mobile subscribers. In the presence of such network externalities, socially-optimal MTRs should therefore exceed marginal costs.51
Armstrong and Wright (2009a) have provided some theoretical support for this policy. Noting that mobile subscribers’ utility increases with both the …xed-to-mobile and mobile-to-mobile termination charges in their duopoly model, they suggest that ‘this observation implies that …rms and the regulator can use relatively high termination charges as a means to expand the number of mobile subscribers.’ To demonstrate this formally, they consider a “Hotelling model with hinterlands” in which the total number of mobile subscribers is increasing in the utility they derive from joining one or other of the mobile networks. The possibility of market expansion introduces market-level network e¤ects: when a new subscriber joins a network, the utility of the existing subscribers to any network increases since there are now more subscribers they can call, either on-net or o¤-net. Armstrong and Wright (2009a) conclude that socially optimal MTRs should exceed the marginal cost of termination, and that the …xed-to-mobile and mobile-to-mobile rates should be set at di¤erent levels, if feasible.52
51Since the Competition Commission’s 2003 inquiry, mobile operators in the UK have received (and
paid) a “network externality surcharge” on top of their regulated MTRs for this purpose. See Competition Commission (2003, pp. 225-252). In its 2008/09 inquiry, the Competition Commission revisited the issue and decided that a network externality surcharge was no longer justi…ed (see Competition Commission, 2009, Section 4). Network externality surcharges have also been applied in Belgium, Greece, Italy and Sweden (Cullen International, 2008), although the European Commission (EC, 2009b) now recommends against this policy.
52Armstrong (2002), Wright (2002) and Valletti and Houpis (2005) also found that the