A Work Project presented as part of the requirements for the Award of a Masters Degree in Economics from the Nova - School of Business and Economics.
Evaluation of the Welfare Impact of Regulating
Mobile Termination Rates in Portugal
Ana Margarida Lemos Gomes Student Number 566
A Project carried out for the Markets and Regulations course, under the supervision of Prof. Steffen Hoernig
Evaluation of the Welfare Impact of Regulating Mobile
Termination Rates (MTRs) in Portugal
Abstract
Following the European Commission’s 2009 Recommendation on the Regulatory Treatment of Fixed and Mobile Termination Rates in the EU, the Portuguese regulatory authority (ANACOM) decided to reduce termination prices in mobile networks to their long-run incremental cost (LRIC). Nevertheless, no serious quantitative assessment of the potential effects of this decision was carried out. In this paper, we adapt and calibrate the Harbord and Hoernig (2014) model of the UK mobile telephony market to the Portuguese reality, and simulate the likely impact on consumer surplus, profits and welfare of four different regulatory approaches: pure LRIC, reciprocal termination charges with fixed networks, “bill & keep”, and asymmetric termination rates. Our results show that reducing MTRs does increase social welfare, profits and consumer surplus in the fixed market, but mobile subscribers are seriously harmed by this decision.
JEL classification: D43, L13, L51, L96.
Keywords: telecommunications, mobile termination rates, regulation, welfare.
Acknowledgments
1. INTRODUCTION
Mobile Termination Rates (MTRs) are the charges that mobile firms levy on fixed networks and other mobile operators for completing, or “terminating”, calls on their networks (Hoernig and Harbord, 2014). At the current stage of technological development, mobile call termination constitutes a bottleneck service, in the sense that calls to a particular subscriber can only be terminated by the network operator to which he/she is connected. This limitation creates a monopoly situation that may distort competition, as mobile operators can charge very high prices for delivering calls to their own subscribers. In fact, as observed by Armstrong and Wright (2009a), in the absence of regulation, mobile operators will charge monopoly-level prices for terminating calls, regardless of how fierce the competition among them is to attract new customers. This concern was further reinforced by Gans and King (2001), who showed that, if left unregulated, mobile termination rates may even exceed monopoly level due to a negative pricing externality created by consumer ignorance about prices.
Worries about the potential welfare-reducing effects of this excessive pricing, exacerbated by a history of high termination rates, led all regulatory authorities in the EU - and numerous others around the world - to introduce price controls. Despite this apparent consensus in policy decisions, the debate about the merits and demerits of regulation, as well as the most efficient approach to regulation, is far from being over.
solution. Moreover, according to him, MTRs that exceed marginal cost (or its proxy, long run incremental cost) are consistent with Ramsey (quasi-efficient) pricing. Crandall and Sidak (2004) also support this perspective, claiming that it would be unrealistic and unfeasible for regulators to attempt to set MTRs at marginal cost, given that mobile networks must use some source of revenue to defray the very large fixed costs of building and operating mobile telecommunications networks and of acquiring new customers. This view is largely contested by a growing body of recent literature, which claims that the two-sided nature of mobile interconnection markets and the existence of significant call externalities (i.e. receiver benefits) fundamentally changes the competitive interaction in these markets, namely, the analysis of interconnection charges, as observed by Hermalin and Katz (2011). The key economic issue is no longer how to set prices in order to fully recover the network’s costs, but rather how to ensure that the prices set efficiently internalize the existing two-sided benefits. According to many authors, like DeGraba (2003) and Hermalin and Katz (2011), this implies welfare-maximizing MTRs less than the marginal cost, and often less than zero.
Another argument frequently used against regulation to cost lies on the belief that reducing MTRs will lower consumer surplus and perhaps even welfare in the mobile market. According to the proponents of this hypothesis, high MTRs are desirable, as they benefit mobile consumers in two distinct ways.
effects, known as “tariff mediated network effects”, cause firms to compete more intensively for subscribers by lowering subscription fees, which benefits mobile consumers (Laffont, Rey and Tirole, 1998b). Thus, they claim, higher MTM lead to higher consumer surplus on the mobile market.
On the other hand, high fixed-to-mobile (FTM) termination rates are a means of transferring surplus from fixed network callers to mobile network callers, as the high profits they create for mobile operators are at least partially competed away in the mobile market (for instance, through larger handset subsidies, reduced fees or increased advertising), given that mobile operators will then fight more fiercely to attract customers. This effect, known as “the waterbed effect”, is also believed to increase the number of mobile subscribers and enhancing the value of the fixed networks to their subscribers who are now able to reach more people.
decreases, which, on the one hand, weakens the effect of price discrimination on the calling patterns of consumers, thus reducing the beneficial tariff-mediated network effects; and, on the other hand, exacerbates the harmful call externality effect. As noticed by Hoernig, this implies that “as the number of firms increases, higher MTRs will tend to lead to lower, instead of higher, consumer surplus”. Additionally, as discussed in Berger (2005) and Hoernig (2007), network based price discrimination not only reduces allocative efficiency and static welfare in mobile markets but also creates a barrier to entry and growth for smaller networks.
When it comes to the FTM termination rates, many authors believe that the argument used is incomplete in two important respects. First, as before, when receiver benefits are significant, the argument loses much of its strength. In fact, as the level of MTRs increases, the welfare in the mobile market decreases. Second, as noted by Armstrong and Wright (2009a), high FTM create an allocative inefficiency. This implies that, even if all fixed-line customers also have a mobile phone, the welfare gain in the mobile market due to lower subscription charges is always outweighed by the welfare loss in the fixed market due to higher FTM termination rates. Regarding the claim that the waterbed effect increases the number of mobile phone subscribers thus increasing the value of the fixed network to its customers, it is subject to much dispute. Even though, historically, we have tended to assume that an increase in penetration represents an increase in social welfare thanks to network externalities, nowadays, when penetration rates exceed 100% in most countries, this association is debatable. On top of this, the empirical evidence of the waterbed effect is also quite ambiguous (see Genakos and Valletti, 2010 and Growitsch, Marcus and Wernick, 2010).
the real effect of a reduction in MTRs on mobile market welfare and consumer surplus. Theoretically the impact is ambiguous and is likely to depend on the specific market structure, as well as on the strength of the call externalities.
In May 2009, the European Commission (EC) issued a Recommendation that set clear guidelines for the regulatory treatment of MTRs in the EU, proposing dramatic reductions to these charges, which should no longer be based on fully allocated costs, but rather reflect solely the actual incremental cost of providing a call (“pure LRIC”). All regulatory authorities are obliged to take the utmost account of this Recommendation and in fact, in Portugal, ANACOM developed a costing model that determined the long run incremental cost of terminating a call (1.27c€ per minute). Despite its prompt implementation, no quantitative assessment of the welfare consequences of this decision was performed, and many authors still believe that other alternatives could have produced better results. Thus, the main purpose of this paper is precisely to provide a framework that allows a serious evaluation of the potential impact of several different approaches to regulating MTRs, namely:
1) Pure LRIC, as recommended by the EC and implemented by ANACOM; 2) Reciprocity with fixed market, i.e. setting MTRs at the same level as FTRs; 3) Bill and Keep, i.e. setting MTRs equal to zero.
Despite the growing theoretical evidence against it and the explicit prohibition by the EC, we also estimated the effect of asymmetric MTRs, i.e. allowing the smaller network to charger higher termination prices than its rivals.
The rest of the paper is organized as follows: Section 2 describes the Portuguese telecommunications market. Section 3 introduces the EC Recommendation and Section 4 presents the evolution of MTRs in Portugal. Section 5 describes the market model, while Section 6 details the calibration procedure and data used. Section 7 reports the simulation results and Section 8 concludes.
2. THE PORTUGUESE MARKET
At the end of 2012, there were 20 entities legally authorized to provide fixed telephony service in Portugal, although only 15 were effectively active. The incumbent operator and market leader is Grupo PT, even though its market share has been declining in the previous years. The penetration rate reaches 43.2 accesses per 100 inhabitants, below the European average (44.1), but, contrary to the latter, exhibiting a tendency of growth mainly due to the proliferation of new offers (e.g. multiple play).
Regarding the mobile telephony service, it was first offered in Portugal in 1989 by a Consortium consisting of CTT – Correios de Portugal and TLF – Telefones de Lisboa e Porto. Two years later, this Consortium gave place to TMN, the first mobile operator in Portugal and still the market leader. Nowadays, there are three mobile operators in the market (TMN, Vodafone and Optimus), whose asymmetry in market shares is largely explained by the different times of entry. Penetration rate reaches 159.3 active cards per 100 inhabitants, well above the EU average, and it was estimated that 92.8% of the people living in Portugal were clients of the mobile telephone service.
Importance of the sector in the Portuguese economy
EU-27 average, the weight of this sector is one percentage point higher in Portugal. The overall investment in electronic communications added up to € 1,104M, an amount that represented 4.01% of the total Portuguese gross formation of fixed capital. In terms of employment, this market alone was responsible for more than 14,000 jobs.
3. THE EUROPEAN COMMISSION RECOMMENDATION
MTRs are regulated in all European Member States. Nevertheless, there is a significant asymmetry on the regulatory approach followed by national authorities and a wide divergence of these rates across countries that cannot be solely justified by differences in the underlying costs or other national characteristics. For instance, in 2008, MTRs ranged from 2 c€ per minute in Cyprus to 15 c€ per minute in Bulgaria, being on average 8.55 c€ per minute. Despite the downward trend that has been observed in recent years, they were still around 10 times higher than FTRs (on average ranging from 0.57c€ to 1.13 c€ per minute).
Moreover, the traditional approach to regulation has been to allow for total cost recovery, based on fully allocated cost models. Recent literature has drawn attention to the fact that this strategy may not be suitable given the two-sided nature of the mobile interconnection markets and the existence of call externalities. Harbord and Pagnozzi (2010) even claim that this approach, by exacerbating network incentives to engage in the inefficient network based price discrimination, creates a distortion in prices and loss in welfare as serious as the initial distortion that regulation aimed at repairing (i.e. the subsidy of mobile subscription via high termination charges).
Incorporating much of this new economic thinking, in May 2009, the EC issued a
particular, it establishes that MTRs at the national level should be based only on the real costs that an operator, using the most efficient technology available, incurs to establish the connection, and should apply to all operators at the same level. By creating a common regulatory framework, this Recommendation aims at removing the existing price distortions between phone operators across the EU, which is expected to lower consumer prices within and between Member States, boost sustainable competition in the Single Market and help investment and innovation in the entire telecommunication sector. A Commission Staff Working Paper that accompanied the Recommendation predicts a potential reduction in mobile industry profits of around € 4 billion over the three initial years, more than off-set by the additional revenues for fixed operators and additional consumer benefits.
4. Mobile Termination Rates in Portugal
In Portugal, FTM termination prices are regulated since 2000, while MTM termination rates are subject to price controls since 2002. The initial regulated prices were revised in 2005, when a market analysis led ANACOM to determine that the existing mobile operators had significant market power and to establish a glide-path (i.e. a gradual reduction of prices) to bring Portuguese MTRs closer to the European benchmark. Due to its later entry in the market, OPTIMUS was allowed to charge higher prices than its competitors for a while, but at the end of this glide-path (initially at October 2006, later postponed to October 2008) there should be symmetry among the different operators and the different types of interconnection.
incremental costs of an efficient operator. Based on these results, the new maximum price allowed for mobile termination was set at 1.27 c€, which should be reached by the end of 2012, trough quarterly reductions of 0.5 c€.
5. A MODEL OF THE PORTUGUESE COMMUNICATIONS MARKET
Our model of the Portuguese telecommunications market is an extension of the Harbord and Hoernig (2014) model for the UK1, assuming, as in Calzada and Valletti (2008), logit subscription demand. In our model, contrary to one monopolist fixed operator, we allow for many asymmetric networks.
Model Setup:
Networks: We assume 𝑚 =3 asymmetric mobile networks and 𝑛 = 4 fixed networks
of different sizes. We consider imperfect competition in both markets, with no strategic competition between them but with strategic competition within them. In other words, consumers perceive fixed and mobile telephony services as non-substitutable, but mobile (fixed) networks as substitutable and horizontally differentiated. All networks are assumed to be interconnected with each other. We focus exclusively on voice calls, excluding other services provided by operators (e.g. text messages).
Market Shares: Subscriber market shares are denoted by 𝛼! >0,𝑖= 1,…,𝑚 with
𝛼!
!
!!! =1 for each mobile network 𝑖, and by 𝜃! >0,𝑘= 1,…,𝑛 with 𝜃! !
!!! =1
for each fixed network 𝑘. Given our assumption of logit subscription demand,
subscriber market shares are given by 𝛼! = !
!(!!!!
!
!)
!!(!!!!!!)
! !!!
and 𝜃! = !
!(!!!!!!)
!!(!!!!!!)
!
!!!
,
1 A generalization of the network competition models of Laffont et al. (1998) and Carter and Wright
where 𝜎,𝛾 > 0 measure the degree of product differentiation (higher values imply less
differentiation), 𝐴! and 𝐵! are specific connection surplus, and 𝑤!!and 𝑤!! are specific
call surplus. In simplified matrix notation, the vectors of mobile market shares
𝛼= 𝛼! !
×! and fixed market shares 𝜃 = 𝜃! !×! can be written, respectively, as: 𝛼 =𝑔! 𝜎(𝐴+𝑤!) and 𝜃 =𝑔!(𝛾 𝐵+𝑤! ),
where 𝐴= 𝐴! !×!, 𝐵= 𝐵! !×!, 𝑤! = 𝑤!! !×!, 𝑤! = 𝑤!! !×!, and the functions
𝑔!: ℝ!
→ 0,1 !
and 𝑔!: ℝ!
→ 0,1 !
are assumed to be differentiable with symmetric Jacobian 𝐺, all of which is consistent with the logit model assumption.
Costs: Similar cost structures are assumed for both mobile and fixed networks. Each additional customer implies a given fixed cost, and each call minute terminated or originated by the network implies a constant marginal cost. Moreover, networks charge a price equal to their termination rate for terminating incoming calls.
Thus, mobile network 𝑖 faces a fixed yearly cost of 𝑓! per subscriber; on-net per
minute cost of 𝑐!!! =𝑐!"!+𝑐!"!, where the indices 𝑜 and 𝑡 correspond to origination and
termination, respectively; off-net per minute cost of 𝑐!"! = 𝑐!"!+𝑀𝑇𝑅! and fixed per
minute cost of 𝑐!"!" =𝑐!"! +𝐹𝑇𝑅!, where 𝑀𝑇𝑅 and 𝐹𝑇𝑅 stand for the network specific
mobile and fixed termination rate, respectively.
Similarly, fixed network 𝑘 incurs a fixed yearly fee of 𝑑! per customer; on-net per
minute cost of 𝑐!!! = 𝑐!"! +𝑐!"!; off-net per minute cost of 𝑐!"! =𝑐!"! +𝐹𝑇𝑅! and
fixed-to-mobile per minute cost of 𝑐!"!" = 𝑐!"! +𝑀𝑇𝑅!.
and minute prices of 𝑝!!! for on-net calls, 𝑝!"! for off-net calls, where 𝑝!"! =𝑝!"! ∀ 𝑗,𝑏≠𝑖
(uniform price), and 𝑝!"!" for calls to the fixed networks, where again 𝑝!"!" =𝑝!"!" ∀ 𝑘,𝑧.
The tariffs of the fixed market are determined in a similar way. Besides the annual subscription fee, 𝐷!, each fixed network 𝑘 charges its customers a per-minute price of
𝑝!!! for calls on its own network; 𝑝!"! for calls to other fixed networks; and 𝑝!"!" for calls to any mobile network. As before, fixed networks are assumed to use uniform prices.
Consumer Surplus: The number of consumers in the mobile market (𝑀), as well as in the fixed market (𝑁), are assumed to be constant. We assume subscribers' utility depend on the given network they are connected to, and on the amount and duration of calls made and received. As the utility depends on incoming calls, a call externality is assumed to exist. Specifically, subscribers in the mobile market 𝑖 [fixed market 𝑘]
receive a fixed utility of 𝐴! [𝐵!]; a utility for making calls of 𝑢! 𝑞 [𝑢! 𝑞 ], where 𝑞 is
the call length in minutes; and a utility from receiving calls of 𝛽!𝑢! 𝑞 [𝛽!𝑢! 𝑞 ],
where 0≤ 𝛽!,𝛽! ≤1 measure the strength of the call externality.
We assume, moreover, that all subscribers on the fixed and mobile networks are called with equal probability, therefore, if the same price applied to all consumers in the market, we would have a balanced calling pattern. In other words, each network would generate as many off-net calls as it would receive as incoming calls from each of the other networks. In the presence of price differentials, however, the demand for calls is a function of the per-minute price. For a given 𝑝, consumer demand calls of length 𝑞 𝑝 ,
which implies a surplus from making calls of 𝑣 𝑝 =𝑢 𝑞 𝑝 −𝑝𝑞 𝑝 , with
𝑞 𝑝 = −𝑣! 𝑝 . By adding the utility from receiving calls and subtracting the
For a single subscriber of mobile network 𝑖, this can be written as:
𝑤!!=𝑀 𝛼! 𝑣
!"!+𝛽!𝑢!"! +𝑁 𝜃! 𝑣!"!!+𝛽!𝑢!"!" −𝐹!
!
!!!
!
!!!
=𝑀 𝛼!ℎ
!"
!+𝑁 𝜃!ℎ!"!"−𝐹!
!
!!! !
!!!
where ℎ!"! = 𝑣!"! +𝛽!𝑢!"! and ℎ!"!" =𝑣!"!"+𝛽!𝑢!"!".
In matrix notation, this is equivalent to: 𝑤! =𝑀ℎ!𝛼+𝑁ℎ!"𝜃−𝐹,
where ℎ! = ℎ!"!
!×!,
ℎ!" = ℎ!"!" !
×! and 𝐹 = 𝐹! !×!.
Similarly, a subscriber of fixed network k obtains the following surplus:
𝑤!!=𝑁 𝜃! 𝑣!"! +𝛽!𝑢!"! +𝑀 𝛼! 𝑣!"!"+𝛽!𝑢!"!" −𝐷! !
!!!
!
!!!
=𝑁 𝜃!ℎ!"! +𝑀 𝛼!ℎ!"!"−𝐷
!
!
!!! !
!!!
where ℎ!"! =𝑣!"! +𝛽!𝑢!"! and ℎ!"!" =𝑣!"!"+𝛽!𝑢!"!".
With matrix representation given by: 𝑤! =𝑁ℎ!𝜃+𝑀ℎ!"𝛼−𝐷.
Recalling our logit subscription demand assumption, it implies that the aggregate consumer surplus in the mobile and fixed markets are given, respectively, by:
𝑆! =!
!𝑙𝑛
𝑒! !!!!!! !
!!! and 𝑆! =
!
!𝑙𝑛
𝑒! !!!!!! !
!!! .
Profits: Profits for both mobile and fixed networks are a function of subscription fees, originated and terminated calls. Specifically, mobile network i's profit can be written as:
𝜋!! =𝑀𝛼! 𝑀 𝛼!𝑅
!"!
!
!!! +𝑁 𝜃!𝑅!"!"+𝐹!−𝑓! !
!!! ,
where 𝑅!! is the proft from on-net calls and equals 𝑅!!! = 𝑝!!!−𝑐!!! 𝑞!!!; 𝑅!"! =
𝑝!"!−𝑐!"! 𝑞!"!+ 𝑀𝑇𝑅! −𝑐!"! 𝑞!"! is the profit from off-net calls; and 𝑅!"!" =
𝑝!"!"−𝑐!"!" 𝑞!"!"+ 𝑀𝑇𝑅!−𝑐!"! 𝑞!"!" is the profit from mobile-to-fixed calls.
The same applies to the fixed market. Therefore, network k's profit is equal to:
𝜋!! =𝑁𝜃! 𝑁 !! 𝜃!𝑅!"!
!! +𝑀 𝛼!𝑅!"!"+𝐷!−𝑑!
!
In aggregate, the joint profit in mobile market is Π! =𝑀𝛼! 𝑀𝑅!𝛼+𝑁𝑅!"𝜃+𝐹− 𝑓 and in the fixed market is Π! = 𝑁𝜃! 𝑁𝑅!𝜃+𝑀𝑅!"𝛼+𝐷−𝑑 .
Welfare: All of the above implies a total welfare of: 𝑊 = 𝑆!+𝑆!+Π!+Π!.
Equilibrium Outcomes
We used the standard Nash equilibrium concept to determine the equilibrium call prices and subscription fees in both mobile and fixed markets. Computations can be found in Appendix 1.
In equilibrium, mobile firm 𝑖 charges: 𝑝!!! = !!!! !!!!, 𝑝!"
! = !!!!!!!"!
!! !!!! !!, 𝑝!"
!" =𝑐!"!", while
fixed firm 𝑘 charges: 𝑝!!! = !!!! !!!!, 𝑝!"
! = !!!!!!!"!
!! !!!! !!, 𝑝!"
!" =𝑐!"!".
Equilibrium fixed fees, for mobile and fixed firms are, respectively:
𝐹! =𝑓!−𝑁 𝜃!𝑅!"!"+𝑀 𝛼! 𝑅!"!−𝑅!"!
!
!!!
!
!!! ,
𝐷! =𝑑!−𝑀 𝛼!𝑅!"!"+𝑁 𝜃! 𝑅!"! −𝑅!"! !
!!!
!
!!! ,
where:
𝑅!!! = !"! !!!!−
!!"! !!!!×𝑅!"
!
!
!!! , 𝑅!"! = 0 ∀ 𝑗 ≠𝑖, 𝐻!"! = −
𝑑𝛼! 𝑑𝐹!
𝜎∀, 𝑗,𝑖= 1,…,𝑚,
𝑅!!! =
! !"!!!! −
!!"!
!!!! ×𝑅!" !
!
!!! , 𝑅!"! = 0 ∀ 𝑙≠ 𝑘, 𝐻!"! = −
𝑑𝜃! 𝑑𝐷!
𝛾, 𝑙,𝑘= 1,…,𝑛.
In matrix notation, fixed fees can be rewritten as 𝐹 =𝑓−𝑁𝑅!"𝜃+𝑀 𝑅!−𝑅! 𝛼
and 𝐷 =𝑑−𝑀𝑅!"𝛼+𝑁 𝑅!−𝑅! 𝜃.
After substitution, we are able to obtain the equilibrium market shares given by:
𝛼 =𝑔! 𝜎 𝐴−𝑓+𝑀 ℎ!+𝑅!−𝑅! 𝛼+𝑁 ℎ!" +𝑅!" 𝜃 ,
𝜃= 𝑔! 𝛾 𝐵−𝑑+𝑁 ℎ!+𝑅!−𝑅! 𝜃+𝑀 ℎ!"+𝑅!" 𝛼 .
Π! = 𝑀!𝛼!𝑅!𝛼 and Π! = 𝑁!𝜃!𝑅!𝜃.
The condition for the equilibrium market shares can be solved numerically, allowing us to compute all the remaining variables.
6. CALIBRATION AND DATA
After having derived the theoretical equilibrium outcomes, we have calibrated the key parameters of the model using data from the Portuguese telecommunication market directly provided by ANACOM or from its “Relatório do Sector das Comunicações 2012”. We have collected information about subscriber market shares, number of subscribers, minutes of traffic and total revenues. In the absence of data for networks marginal costs, we have assumed that 1) termination costs for mobile operators equal the endpoint of the latest glide-path set by ANACOM (after the costing model has been developed), 2) there is symmetry between origination and termination costs, 3) fixed costs are zero. We assumed, moreover, symmetric costs among operators. Regarding the fixed market, we were only able to obtain information for the historical operator, which forced us to assume that the alternative networks have similar cost structures. As before, for simplicity, no fixed costs were considered.
i.e., from β!=0 (no call externalities) to β!=1 (the receiving party has the same utility has the calling party). Then, using the parameters computed, we determined the horizontal differentiation parameters σ and γ, for the mobile and fixed markets respectively. Finally, the preference asymmetry parameters, A for the mobile market and B for the fixed market, were derived.
Data:
Costs: In the absence of data for networks marginal costs, we assumed a marginal cost of originating and terminating calls on mobile networks of 1.27 c€ per minute, corresponding to ANACOM’s estimate of pure LRIC. Similarly, for the fixed market, we assumed that the marginal origination and termination costs are symmetric and equal ANACOM’s latest regulatory proposal to the EC of 0.1114 c€ per minute. For the calibration, we used the 2010 mobile termination charges of 6 c€ per minute and fixed terminate charges of 0.285c€2 per minute.
Subscribers and market shares: In 2010, the total number of mobile subscribers was 13.083 million and of fixed subscribers was 3.746 million. The subscriber market shares for each mobile and fixed network are presented in Table 1.
Mobile Market Fixed Market
TMN 44.2% Grupo PT 59.3%
Vodafone 39.7% ZON 14.8%
Optimus 16.1% Optimus 12.9%
Other operators 13%
Table 1. Market shares for mobile and fixed networks.
2
Traffic: In 2010, MTM voice traffic was 18,416 million of minutes (M min), much higher than the FTF traffic of 6,411 M min. Mobile subscribers’ calls to fixed subscribers amounted to 670 M min, while the fixed-to-mobile traffic was 891 M min.
Revenues: Total revenue from voice communications and monthly rental fees amounted, in 2010, to € 1,696 M in the mobile market and € 675 M in the fixed market.
Calibration:
Demand Parameters: Using the theoretical equilibrium outcome derived above, along with data for marginal costs and market shares, we were able to compute predicted call prices, for each value of the call externality β!. Then, given our assumption about call
demand elasticity, ε = -0,5, as well as the model’s predictions of the relative proportions of on-net and off-net calls, we were able to match the equilibrium tariffs with the observed demand to recover the linear demand parameters a and b. For instance, for MTM calls, we matched the model predicted MTM call minutes (a function of predicted prices and endogenously determined market shares) with the observed demand of
𝑄!=18,416 M min from a mass of subscribers of 𝑚=13,083 million, such that:
𝑄= 𝑚! 𝛼!𝛼! 𝑎!−𝑏!𝑝!"! =𝑚!(
!
!,!!! 𝑎!−𝑏!𝑝!),
where 𝑝! = 𝛼!𝛼!𝑝 !"!
!
!,! is the average price.
Knowing that the price elasticity of demand is given by: 𝜀 =−!!!!!! !! , we can combine both expressions to determine am and bm:
𝑎! = !
!! 1−𝜀 𝑄!, 𝑏! = −
!!! !!!!.
Thus, for MTM calls, we obtained am = 161.39, as well as the following values of the
𝛽!=0 𝛽!=0,25 𝛽!=0,5 𝛽!=0,75 𝛽!=1
bm 9.82 8.79 7.38 5.63 3.49
Table 2. Demand slope for mobile-to-mobile calls.
A similar calibration exercise resulted in amf = 20.51 and bmf =4.40, for MTF calls, and
afm = 27.30 and bfm = 1.49, for FTM calls.
Horizontal Differentiation Parameter: After having calibrated the demand parameters, we were able to determine, for each value of the call externality 𝛽!, the differentiation
parameters of the logit subscription demand (σ for the mobile market and γ for the fixed market), by matching the model’s predicted revenues from fixed subscription and voice calls with the observed ones, knowing that total revenue for the mobile and fixed market is given, respectively, by:
𝑅𝑒𝑣𝑒𝑛𝑢𝑒! =𝑀 𝛼! 𝑀 𝛼!𝑝!"!𝑞!"!+𝑁 𝜃!𝑝!"!"𝑞!"!" !
!!! !
!!!
+𝐹! !
!!!
𝑅𝑒𝑣𝑒𝑛𝑢𝑒! =𝑁 𝜃! 𝑁 𝜃!𝑝!"!𝑞!"! +𝑀 𝛼!𝑝!"!"𝑞!"!"
!
!!! !
!!!
+𝐷! !
!!!
The calibrated values, which were always within the stable range3, i.e. σ < σstab and γ <
γstab , are reported below.
𝛽!=0 𝛽!=0.25 𝛽!=0.5 𝛽!=0.75 𝛽!=1 σ 0.0138846 0.0121220 0.0099879 0.0073838 0.0040738
σstab 0.0340904 0.0212334 0.0136370 0.0083051 0.0041324
γ 0.0113446 0.0113446 0.0113446 0.0113446 0.0113446
γstab 0.1485701 0.1485701 0.1485701 0.1485701 0.1485701
Table 3. Differentiation parameters
Asymmetry Parameters: Finally, we were able to determine the network asymmetry parameters from observed market shares, predicted equilibrium prices and the
3
This stability check is essentially a consistency check that allows us to exclude multiple equilibria and tipping, without further implications given that is has been verified. γstab and σstab were determined as indicated in Hoernig (2014).
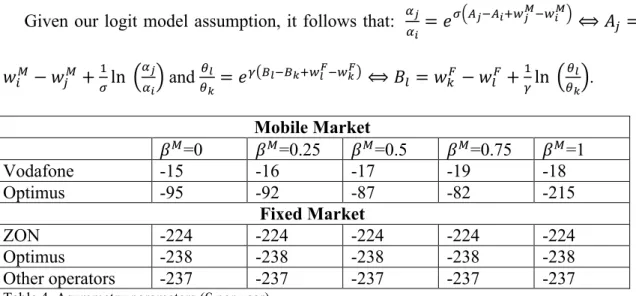
previously calibrated differentiation parameters. Given our assumption of logit subscription demand, only pairwise differences, i.e. Ai – Aj for the mobile market and
Bk - Bl for the fixed market, can be calibrated. We have, therefore, normalize Ai = 0 for
TMN and Bk = 0 for PT, which implies that the remaining asymmetry parameters
identified and reported below represent the additional amount a subscriber would be willing to pay to change from TMN or PT to each of the alternative networks, if everything else was otherwise identical.
Given our logit model assumption, it follows that: !!
!! =𝑒
! !!!!!!!
!!!!!!
⟺𝐴! =
𝑤!! −𝑤 !!+
! !ln
! ! !! and
!!
!!=𝑒
! !!!!!!!!!!!!! ⟺𝐵
! =𝑤!!−𝑤!!+
! !ln
!!
!! .
Mobile Market
𝛽!=0 𝛽!=0.25 𝛽!=0.5 𝛽!=0.75 𝛽!=1
Vodafone -15 -16 -17 -19 -18
Optimus -95 -92 -87 -82 -215
Fixed Market
ZON -224 -224 -224 -224 -224
Optimus -238 -238 -238 -238 -238
Other operators -237 -237 -237 -237 -237
Table 4. Asymmetry parameters (€ per year)
Nevertheless, as in the calibration these are also assumed to be constant, the adjustment is achieved through the specific connection surplus, A, which significantly reduces.
7. SIMULATION RESULTS
We simulated the impact of reducing MTRs in consumer surplus, profits and welfare. We tested four different scenarios, and assumed values for the call externality parameter 𝛽!of 0, 0.25, 0.5, 0.75 and 1. All results are reported in € million and refer to changes
compared to the baseline scenario, which was assumed to be MTRs at the 2010 level (6c€ per minute for all mobile operators). Positive values represent increases in the variables under consideration, while negative values imply a reduction. Market shares, which are determined endogenously in our model, are not reported here as they do not change significantly compared to their 2010 level, but they can be found in Appendix 2.
Pure LRIC, Reciprocity with fixed market and Bill and Keep
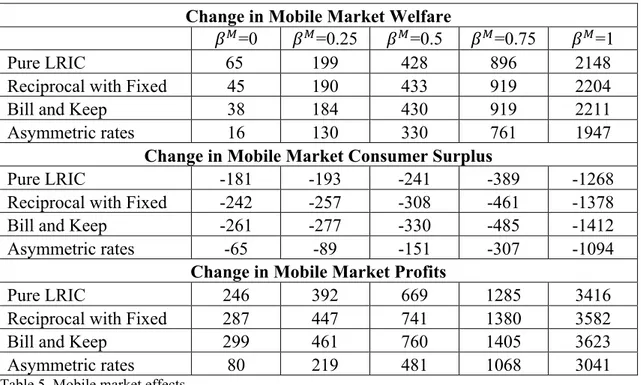
Mobile Market: Considering the mobile market in isolation, our simulations produced the following results.
Change in Mobile Market Welfare
𝛽!=0 𝛽!=0.25 𝛽!=0.5 𝛽!=0.75 𝛽!=1
Pure LRIC 65 199 428 896 2148
Reciprocal with Fixed 45 190 433 919 2204
Bill and Keep 38 184 430 919 2211
Asymmetric rates 16 130 330 761 1947
Change in Mobile Market Consumer Surplus
Pure LRIC -181 -193 -241 -389 -1268
Reciprocal with Fixed -242 -257 -308 -461 -1378
Bill and Keep -261 -277 -330 -485 -1412
Asymmetric rates -65 -89 -151 -307 -1094
Change in Mobile Market Profits
Pure LRIC 246 392 669 1285 3416
Reciprocal with Fixed 287 447 741 1380 3582
Bill and Keep 299 461 760 1405 3623
Asymmetric rates 80 219 481 1068 3041
As shown in Table 5, reducing MTRs to any of the three typical alternatives described before has a clear positive effect in welfare in the mobile market for all values of 𝛽!. This increase ranges from €38 million to € 2 billion per year, depending on the
strength of the call externality. Nevertheless, contrary to the results of Harbord and Hoernig (2014) for the UK, this increase is exclusively driven by a rise in profits, given that consumer surplus is significantly lowered (a reduction increasing in the value of 𝛽!). These losses for consumers are explained by the reduction in the waterbed effect and the weaker tariff mediated network effects. While the former reduces fixed-to-mobile transfers, the latter relaxes competition, which harms consumers through higher subscription fees. These results suggest that, given the particular structure of the Portuguese market, the positive impact of lower off-net prices (the call externality effect) is outweighed by the remaining effects, regardless of the strength of the call externality. In fact, contrary to the theoretical intuition, the higher the ratio of receiver benefits, the higher the loss for consumers. Regarding mobile networks’ profits, they tend to increase for all values of 𝛽! due to the network competition effect. Adopting a
pure LRIC approach seems to bring the highest welfare gain and the less harm to consumers.
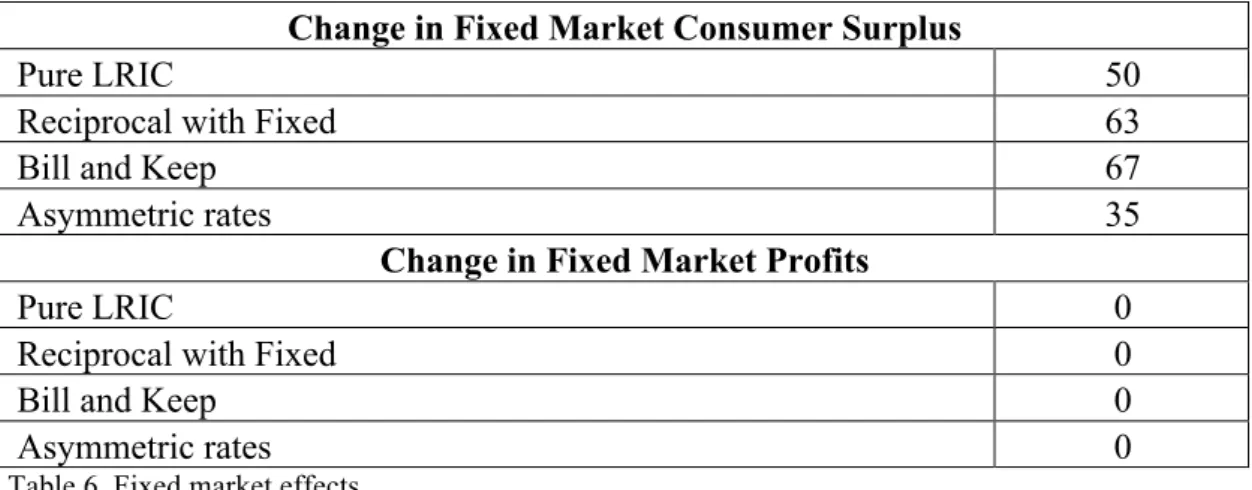
Fixed Market: Considering now the fixed market, we see that, similarly to what happened in the mobile market, welfare increases under all the alternatives considered. The estimated values, as expected, do not depend on the strength of the mobile calls externality 𝛽!.
Change in Fixed Market Welfare
Pure LRIC 50
Reciprocal with Fixed 63
Bill and Keep 67
Change in Fixed Market Consumer Surplus
Pure LRIC 50
Reciprocal with Fixed 63
Bill and Keep 67
Asymmetric rates 35
Change in Fixed Market Profits
Pure LRIC 0
Reciprocal with Fixed 0
Bill and Keep 0
Asymmetric rates 0
Table 6. Fixed market effects
This increase is explained both by the reduction of transfers to mobile networks and by the increase in FTM quantities towards their efficient level (change from 18,201 to 25,244 millions of minutes). Under the assumption of competition in the fixed market, this gain is captured by consumers, rather than fixed networks. In fact, fixed-to-fixed (FTF) prices and call quantities are independent of the level of MTRs, and even though FTM call quantities increase, as they are priced at cost, profits remain constant. Contrary to the mobile case, in the fixed market it is the “Bill and Keep” approach that produces the highest gains.
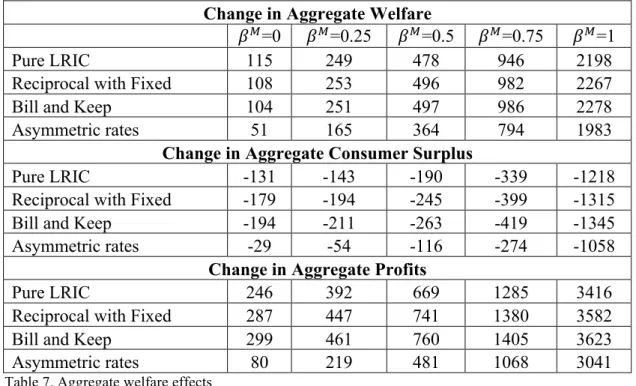
LRIC-based pricing results in the highest welfare gain, but when call externalities matter welfare-maximizing MTRs are always below cost.
Change in Aggregate Welfare
𝛽!=0 𝛽!=0.25 𝛽!=0.5 𝛽!=0.75 𝛽!=1
Pure LRIC 115 249 478 946 2198
Reciprocal with Fixed 108 253 496 982 2267
Bill and Keep 104 251 497 986 2278
Asymmetric rates 51 165 364 794 1983
Change in Aggregate Consumer Surplus
Pure LRIC -131 -143 -190 -339 -1218
Reciprocal with Fixed -179 -194 -245 -399 -1315
Bill and Keep -194 -211 -263 -419 -1345
Asymmetric rates -29 -54 -116 -274 -1058
Change in Aggregate Profits
Pure LRIC 246 392 669 1285 3416
Reciprocal with Fixed 287 447 741 1380 3582
Bill and Keep 299 461 760 1405 3623
Asymmetric rates 80 219 481 1068 3041
Table 7. Aggregate welfare effects
Asymmetric Rates:
competed away in retail market due to the assumption of competition.
Additional Issues:
The framework developed in this paper allowed us to estimate the likely welfare impacts of reducing MTRs to several different scenarios, but it is, nevertheless, unable to capture other potential effects that may accrue from the EC’s decision. First, we have assumed that changing MTRs does not alter the structure of retail prices (CPNP principle), while in fact empirical evidence and some recent literature suggest that reducing MTRs below cost may lead networks to adopt a receiving party pays regime (RPP), where consumers have to pay for receiving calls. Based on pure theory, it is not possible to make any prediction on this subject, as the literature is still scarce and the results ambiguous. Moreover, as noted by Harbord and Pagnozzi (2010), even when mobile termination rates are zero, reception charges tend to be relatively modest. The EC, on its turn, believes that it is highly unlikely that aligning MTRs to cost will result in a RPP regime. It claims that the CPNP principle is “firmly anchored in the mentality and consumer behavior of Europeans” and that any company trying to change it would probably lose much of its customers to competition.
Another potential effect that is omitted in this model is the possibility of higher investments and innovations in the fixed sector once the cross-subsidy from fixed to mobile customers is removed. This would not only benefit consumers, who would enjoy wider offer of services, but also fixed operators who would have additional revenue sources and opportunities. Our model does not allow us to draw any conclusion on the likelihood of this scenario, as fixed networks’ profits remain constant by assumption.
stronger competition. Even though our model is not able to directly assess this possibility, the fact that mobile networks’ profits increased significantly may indeed encourage other operators to enter the market, thus confirming the theoretical prediction. It is, nevertheless, very hard to be sure solely based on our framework.
8. CONCLUSIONS
The 2009 EC’s Recommendation proposed a dramatic change in the regulatory approach to MTRs in Europe, which led to significant reductions of these charges in most countries, including Portugal. While there is indeed some theoretical support of this new policy orientation in recent literature, there are also some voices that strongly oppose such shift. In fact, based on pure theory, it is not possible to predict what the likely effects of reducing MTRs will be.
In this paper we have developed a framework to quantitatively assess the potential impact of changing MTRs in Portugal. Our results show that, in line with the EC’s Recommendation, reducing MTRs does indeed increase social welfare, profits and consumer surplus in the fixed market. Nevertheless, mobile consumers will be seriously harmed and this loss is not outweighed by the gain of fixed subscribers. This result provides some evidence of the ‘waterbed effect’. Among the different regulatory approaches, pure LRIC results in the highest increase in overall welfare and is also the approach that harms consumers the least. In contrast with recent literature, asymmetric rates are beneficial for consumers, even though the increase in aggregate social welfare is smaller than with other alternatives.
REFERENCES
[2] Berger, Ulrich. 2004. “Access Charges in the Presence of Call Externalities.” The B.E. Journal of Economic Analysis & Policy, 3(1): 1-18.
[3] Crandall, Robert W. and Sidak, J. Gregory. 2004. “Should Regulators Set Rates to Terminate Calls on Mobile Networks?” Yale Journal on Regulation, 21(2): 261-314.
[4] DeGraba, P. 2003. “Efficient intercarrier compensation for competing networks when customers share the value of a call.” Journal of Economics and Management Strategy, 12: 207-230.
[5] European Commission. 2009a. Commission Recommendation on the Regulatory Treatment of Fixed and Mobile Termination Rates in the EU, 7 May, Brussels. [6] European Commission. 2009b. Explanatory Note, Commission Staff Working
Document accompanying the Commission Recommendation on the Regulatory Treatment of Fixed and Mobile Termination Rates in the EU, Brussels.
[7] European Commission. 2009c. Implications for Industry, Competition and Consumers, Commission Staff Working Document accompanying the Commission Recommendation on the Regulatory Treatment of Fixed and Mobile Termination Rates in the EU, Brussels.
[8] Gans, J. and King, S.. 2001. “Using ‘bill and keep’ interconnect arrangements to soften network competition’. Economics Letters, 71(3): 413-420.
[9] Genakos, C. and Valletti, T.. 2011. “Testing the ‘waterbed’ effect in mobile telephony.” Journal of the European Economic Association, 9: 1114-1142.
[10] Growitsch, Christian, Marcus, Scott and Wernick, Christian. 2010. “The effects of lower mobile termination rates on retail price and demand.” Paper presented at Euro CPR conference, Brussels, 28-30 March.
[11] Harbord, David and Hoernig, Steffen. 2014. “Welfare Analysis of Regulating Mobile Termination Rates in the UK.” Journal of Industrial Economics, forthcoming.
[12] Harbord, David and Pagnozzi, Marco. 2010. “Network-based price discrimination and ‘bill and keep’ vs. ‘cost-based’ regulation of mobile termination rates.”
Review of Network Economics, 9(1), Article 1.
[13] Hausman, Jerry A. 2002. “Mobile Telephone”. In Handbook of Telecommunications Economics I, ed. Martin Cave, Sumit K. Majumdar and Ingo Vogelsang, 563-604. Elsevier.
[14] Hermalin, Benjamin E. and Katz, Michael L.. 2011. “Customer or Complementor? Intercarrier Compensation with Two-Sided Benefits.” Journal of Economics and Management Strategy, 20(2): 379-408.
[15] Hoernig, Steffen. 2007. “On-Net and Off-Net Pricing on Asymmetric Telecommunications Networks.” Information Economics & Policy, 19(2): 171-188.
[16] Hoernig, Steffen. 2014. “Competition between multiple asymmetric networks: Theory and applications.” International Journal of Industrial Organization,
32(C): 57-69.
APPENDIX 1:Equilibrium Outcomes
Mobile Market:
Given our assumption of uniform off-net call prices and inelastic subscription demand,
we were able to determine equilibrium call prices through the standard technique of
holding market shares constant by appropriate adjustments of the fixed fee 𝐹!, which
will be determined afterwards.
Thus, for on-net prices 𝑝!!! and the mobile-to-fixed price 𝑝!"!" mobile firm 𝑖 holds
𝑤!! =𝑀 𝛼
! !
!!! ℎ!"!+𝑁 𝜃!ℎ!"!" !
!!! −𝐹! constant.
Using the fact that !"
!" =−𝑞 and
!!
!!
!
!!
!!! =
𝑝!!! 𝑞!!! ! and assuming that the relevant
second-order conditions hold, this implies that:
0=𝑀𝛼!!!!!! !!
!!
!×𝑑𝑝!!! −𝑑𝐹! ⟺
!!!
!!
!!! =𝑀
𝛼! 𝛽!𝑝!!! 𝑞!!! !−𝑞!!! ,
0=𝑁!!!"!" !!
!"!"×
𝑑𝑝!"!"−𝑑𝐹! ⟺ !!!
!!
!"!" =−
𝑞!"!"𝑁.
For off-net call prices 𝑝!"!!, we have to take into account the existence of call
externalities, which implies that any change in 𝑝!"! not only affects 𝑤!!, but also
𝑤
!! =𝑀 𝛼!ℎ!"! !
!!! +𝑁 𝜃!ℎ!"!" !
!!! −𝐹!, with:
𝑑𝑤!! =−𝑀 1−𝛼! 𝑞
!"!𝑑𝑝!"!−𝑑𝐹! ,
𝑑𝑤
!! =𝑀𝛼!𝛽!𝑝!"! 𝑞!"! !𝑑
𝑝!"!.
Recalling our assumption of uniform off-net call prices, we have that 𝑑𝑤
!! =𝑑𝑤!! for
all 𝑗,𝑧≠𝑖. From ! 𝛼!
!!! =𝐸!𝛼 =1, where 𝐸 is a 𝑚×1 vector of ones, it follows
The response of market shares to a small change in surplus 𝑑𝑤 is given by 𝑑𝛼 =
𝜎𝐺!𝑑𝑤!. Thus, in order to keep market shares constant, 𝑑𝑤! has to be proportional to
𝐸, i.e. 𝑑𝑤!! = 𝑑𝑤!! for all 𝑗:
!!! !!
!"!= −𝑀 1−
𝛼! 𝑞
!"!+𝛼!𝛽!𝑝!"! 𝑞!"!
!
.
Finally, firm 𝑖’s first-order conditions on profit maximization, assuming once again that
the relevant second order conditions hold, become:
𝑑𝜋!!
𝑑𝑝!!! =𝑀!𝛼!! 𝑞!!!+ 𝑝!!!−𝑐!!! 𝑞!!! !+𝛽!𝑝!!! 𝑞!!! !−𝑞!!! =0
𝑑𝜋!! 𝑑𝑝
!"!
=𝑀!𝛼! 1−𝛼! 𝑞
!"!+ 𝑝!"!−𝑐!"! 𝑞!"!
!
−𝑞!"!−
𝛼!
1−𝛼!𝛽 !𝑝 !" ! 𝑞 !"! ! =0
𝑑𝜋!!
𝑑𝑝!"!"=𝑀𝑁𝛼! 𝑞!"!"+ 𝑝!"!"−𝑐!"!" 𝑞!"!" !−𝑞!"!" =0
where 𝑐
!"! is the average off-net cost and equals 𝑐!"! = !!!𝛼!𝑐!"! 1−𝛼! .
The resulting call prices are therefore:
𝑝!!! =
!
!!! !!!! , 𝑝!"
!" =𝑐!"!", 𝑝 !"! =
!!!
!"! !!!
!! !!!! !! , 𝑗 ≠ 𝑖.
The next step is to determine networks’ optimal subscription fees. Recalling that market shares are given by 𝛼= 𝑔! 𝜎(𝐴+𝑤!) and call surplus equals 𝑤! =𝑀ℎ!𝛼+
𝑁ℎ!"𝜃−𝐹, through the implicit function theorem we are able to determine the effect of a change in fixed fees on market shares:
!"
!" =−
𝜎 𝐼−𝜎𝑀𝐺!ℎ! !!𝐺 ≡−𝜎𝐻!
A sufficient condition for 𝐼−𝜎𝑀𝐺!ℎ! !! (and thus 𝐻) to exist is “stability in
that 𝑑𝑒𝑡 𝐼−𝜎𝑀𝐺!ℎ! = 0. In the following computations we assume this condition
holds4 .
From the above, it follows that the impact of firm 𝑖’s fixed fee, 𝐹!, on firm 𝑗’s market
share, 𝛼!, is !!!
!!! = −
𝜎𝐻
!"!. Thus, firm 𝑖’s first-order condition on profit maximization
becomes:
𝑑𝜋!!
𝑑𝐹! =−𝜎𝑀𝐻!!
! 𝑀 𝛼
!𝑅!"! !
!!!
+𝑁 𝜃!𝑅!"!"
!
!!!
+𝐹! −𝑓!
+ 𝑀𝛼! 1−𝜎𝑀 𝐻
!"!𝑅!"!
!
!!! = 0.
The resulting fixed fee is:
𝐹! =𝑓! −𝑁 𝜃!𝑅!"!"+𝑀 𝛼! 𝑅!"!−𝑅!"!
! !!!
!
!!! ,
where 𝑅!!! = ! !"!!!!−
!!"! !!!!×𝑅!"
! !
!!! , 𝑅!"! =0 for all 𝑗≠ 𝑖.
Fixed Market:
In order to determine the equilibrium outcomes for the fixed market, we followed the
exact same procedure as in the mobile market. First, we found the optimal pricing
structure holding market shares constant, through appropriate adjustments of the fixed
fees, and then, in a second step, networks’ equilibrium fixed fees were determined.
Below we present the relevant computations and results, assuming that the necessary
second-order conditions hold.
For on-net prices 𝑝!!! and the fixed-to-mobile price 𝑝!"!" , fixed firm 𝑘 holds 𝑤!! =
𝑁 !! 𝜃!ℎ!"!
!! +𝑀 𝛼!
!
!!! ℎ!"!"−𝐷! constant.
For on-net prices 𝑝!!! and the fixed-to-mobile price 𝑝!"!! fixed firm 𝑘 holds 𝑤!! constant.
Using !"
!"=−𝑞 and !!!!! !!!!! =𝑝!!
! 𝑞
!!! !, this implies that:
0=𝑁𝜃!!!!!!
!!!!! ×𝑑𝑝!!
! −𝑑𝐷
! ⟺ !!! !!!!! =𝑁
𝜃! 𝛽!𝑝!!! 𝑞!!! !−𝑞!!! ,
0=𝑀!!!"!" !!
!"!"×
𝑑𝑝!"!"−𝑑𝐷! ⟺ !!!
!!
!"
!" = −𝑞!"!"𝑀.
For off-net prices 𝑝!"!, taking into account the call externality and the assumption of
off-net call prices, we have that:
!!!
!!!"! = −𝑁 1−
𝜃! 𝑞!"! +𝜃!𝛽!𝑝!"! 𝑞 !"! ! .
Firm 𝑘’s first-order conditions on profit maximization become:
!!!!
!!!!! =𝑁
!𝜃!! 𝑞!!! + 𝑝!!! −𝑐!!! 𝑞!!! !+𝛽!𝑝!!! 𝑞!!! !−𝑞!!! =0,
!!!!
!!!"! =𝑁
!𝜃! 1−𝜃! 𝑞!"! + 𝑝!"! − 𝑐!"! 𝑞!"! !−𝑞!"!!− !! !!!!𝛽
!𝑝!"! 𝑞!"! ! =0,
!!!!
!!
!"!" =𝑀𝑁
𝜃! 𝑞!"!"+ 𝑝!"!"−𝑐!"!" 𝑞!"!" !−𝑞!"!" = 0.
The resulting calls prices are:
𝑝!!! = !!! !
!!!! , 𝑝!"
!" = 𝑐
!"!", 𝑝!"! =
!
!!!"! !!!
!!!!!! !!
, 𝑙≠ 𝑘.
Regarding subcription fees, using the implicit function theorem, we determined the impact on market shares of changing fixed fees, which is given by:
!"
!" =−𝛾 𝐼
!−𝛾𝑁𝐺!ℎ! !!𝐺! ≡−𝛾𝐻!.
Thus, the impact of firm 𝑘’s fixed fee, 𝐷!, on firm 𝑙’s market share, 𝜃!, is !!!
!!! =−𝐻!" !.
𝑑𝜋!!
𝑑𝐷! =−𝛾𝑁𝐻!!
! 𝑁 𝜃
!𝑅!"! !
!!!
+𝑀 𝛼!𝑅!"!" !
!!!
+𝐷!−𝑓!
+ 𝑁𝜃! 1−𝛾𝑁 !! 𝐻!"!!𝑅!"!!
!! = 0.
The resulting fixed fee is:
𝐷! = 𝑑!−𝑀 𝛼!𝑅!"!"+𝑁 𝜃! 𝑅!"! −𝑅!"!
! !!!
!
!!! ,
where 𝑅!!! =
! !"!!!! −
!!"!
!!!! ×𝑅!" ! !
APPENDIX 2:Changes in Mobile Operators’ Market Shares
Pure LRIC
𝛽!=0 𝛽!=0.25 𝛽!=0.5 𝛽!=0.75 𝛽!=1
TMN 42.47 41.46 40.01 38.27 39.53
Vodafone 38.58 37.80 36.71 35.50 38.14
Optimus 18.94 20.74 23.27 26.23 22.33
Reciprocal with fixed network
TMN 42.29 41.24 39.79 38.09 39.30
Vodafone 38.46 37.64 36.55 35.39 37.92
Optimus 19.25 21.11 23.66 26.53 22.78
Bill and Keep
TMN 42.25 41.20 39.74 38.05 39.25
Vodafone 38.43 37.61 36.52 35.36 37.88
Optimus 19.33 21.20 23.74 26.59 22.87
Asymmetric rates
TMN 39.06 38.56 37.72 36.64 38.73
Vodafone 34.52 34.22 33.71 33.25 37.12
APPENDIX 3:Changes in Mobile Operators’ Profits
𝛽!=0 𝛽!=0.25 𝛽!=0.5 𝛽!=0.75 𝛽!=1
TMN
Pure LRIC 96 145 240 460 1340 Reciprocal with fixed 113 166 267 494 1401 Bill and Keep 118 172 274 503 1417 Asymmetric rates
-79 -31 57 263 1093
Vodafone
Pure LRIC 94 148 251 484 1380 Reciprocal with fixed 109 168 277 517 1441 Bill and Keep 114 174 284 526 1456 Asymmetric rates
-66 -14 81 297 1137
Optimus
Pure LRIC 56 99 177 341 695 Reciprocal with fixed 65 112 197 369 740 Bill and Keep 67 115 202 376 750 Asymmetric rates