Multidimensional Prognostic Index in
Association with Future Mortality and
Number of Hospital Days in a
Population-Based Sample of Older Adults: Results of the
EU Funded MPI_AGE Project
Sara B. Angleman1, Giola Santoni1, Alberto Pilotto2,3, Laura Fratiglioni1,4, Anna-Karin Welmer1,5*, on behalf of the MPI_AGE Project Investigators
1Aging Research Center, Department of Neurobiology, Care Sciences and Society (NVS), Karolinska Institutet and Stockholm University, Stockholm, Sweden,2Geriatrics Unit, Azienda ULSS 16 Padova, S. Antonio Hospital, Padova, Italy,3Department of OrthoGeriatrics, Rehabilitation and Stabilization, Frailty Area, E.O. Galliera Hospital, Genova, Italy,4Stockholm Gerontology Research Center, Department of NVS, Karolinska Institutet, Stockholm, Sweden,5Karolinska University Hospital, Stockholm, Sweden
¶ Membership of the MPI_AGE Project Investigators is listed in the Acknowledgments. *[email protected]
Abstract
Background
The Multidimensional Prognostic Index (MPI) has been found to predict mortality in patients with a variety of clinical conditions. We aimed to assess the association of the MPI with future mortality and number of in-hospital days for the first time in a population-based cohort.
Methods
The study population consisted of 2472 persons, aged 66–99 years, from the Swedish National Study on Aging and Care in Kungsholmen, Sweden, who underwent the baseline visit 2001–4, and were followed up>10 years for in-hospital days and>12 years for mortal-ity. The MPI was a modified version of the original and aggregated seven domains (personal and instrumental activities of daily living, cognitive function, illness severity and comorbidity, number of medications, co-habitation status, and nutritional status). The MPI score was divided into risk groups: low, medium and high. Number of in-hospital days (within 1, 3 and 10 years) and mortality data were derived from official registries. All analyses were age-stratified (sexagenarians, septuagenarians, octogenarians, nonagenarians).
Results
During the follow-up 1331 persons (53.8%) died. Laplace regression models, suggested that median survival in medium risk groups varied by age from 2.2–3.6 years earlier than for OPEN ACCESS
Citation:Angleman SB, Santoni G, Pilotto A, Fratiglioni L, Welmer A-K (2015) Multidimensional Prognostic Index in Association with Future Mortality and Number of Hospital Days in a Population-Based Sample of Older Adults: Results of the EU Funded MPI_AGE Project. PLoS ONE 10(7): e0133789. doi:10.1371/journal.pone.0133789
Editor:Giuseppe Sergi, University of Padova, ITALY
Received:April 13, 2015
Accepted:June 30, 2015
Published:July 29, 2015
Copyright:© 2015 Angleman et al. This is an open access article distributed under the terms of the
Creative Commons Attribution License, which permits unrestricted use, distribution, and reproduction in any medium, provided the original author and source are credited.
Data Availability Statement:Data are from the SNAC-K study, an ongoing longitudinal study (http:// www.snack-k.se). Due to ethical restrictions imposed by Regional Ethical Review Board, all relevant data are available upon request to the PI of SNAC-K, Laura Fratiglioni ([email protected]).
Funding:This work arised from the European project MPI_AGE (GA20131202) which has received funding from the European Union, in the framework of the Health Programme 2008–2013. The contents of this
those in the corresponding low risk groups (p = 0.002-p<0.001), and median survival in high risk groups varied by age from 3.8–9.0 years earlier than for corresponding low risk groups (p<0.001). For nonagenarians, the median age at death was 3.8 years earlier in the high risk group than for the low risk group (p<0.001). The mean number of in-hospital days increased significantly with higher MPI risk score within 1 and 3 years for people of each age group.
Conclusion
For the first time, the effectiveness of MPI has been verified in a population-based cohort. Higher MPI risk scores associated with more days in hospital and with fewer years of sur-vival, across a broad and stratified age range.
Introduction
Predicting life expectancy is crucial for clinicians to identify the most appropriate clinical decisions for management, treatment and prevention, as well as for patients to have realistic
expectations [1,2]. Several prognostic indices for mortality have been created and validated in
different settings, although few scales have been tested for accuracy across settings [3,4]. In
addition, many scales require information that is not routinely collected, often causing their
implementation to be time consuming and impractical to use [3]. Finally, older adults often
present with several concurrent health problems [5,6], and life expectancy is likely to be
influ-enced by a multitude of factors, suggesting that a prognostic index for mortality should be
mul-tidimensional in nature [7].
The Multidimensional Prognostic Index (MPI) is based on information on functional, cog-nitive, and nutritional status, as well as medical and social factors, that are usually available in
various settings [8]. The MPI was first developed and validated in two independent cohorts of
older hospitalized patients [9,10]. The index has been further validated for all-cause mortality
in hospitalized patients with specific acute and chronic diseases [11–15], and in outpatients
with cognitive impairment [16]. It has also been associated with mortality in nursing home
res-idents [17]. The MPI has been found to have high predictive validity across these settings, and
it has been shown to have high adherence to clinimetric properties, including accuracy, calibra-tion and feasibility. In addicalibra-tion, a large prospective multicenter study found that the MPI had significantly better prognostic accuracy in hospitalized older patients than three other frailty
indices in predicting mortality [18].
It has been suggested that older adults who are frequently admitted to hospital constitute a
small group that consume a great deal of inpatient care [19]. The MPI has been found to be
predictive of in-hospital length of stay and of hospital admissions in an outpatient setting [16,
20]. However, studies have not yet examined the association of the MPI in relation to future
mortality and number of in-hospital days in a population-based sample of older adults. Fur-thermore, most previous studies on prognostic indices for all-cause mortality in older adults, including the MPI, have evaluated mortality risk over time periods ranging from one month to
5 years [3,4,9–13,15,16]. However, according to current guidelines, some preventive
inter-ventions, are not recommended when median life expectancy is less than seven years [21,22].
Thus, there is a need to use valid predictive tools that can be used to evaluate long-term, in addition to short-term, survival and hospitalization prognosis on a population level. Further, most studies have focused on risk, but have failed to report more familiar and pragmatic
be regarded as reflecting the position of the European Union. This work was also supported by the funders of the Swedish National study on Aging and Care, SNAC (www.snac.org): the Ministry of Health and Social Affairs, Sweden, the participating County Councils and Municipalities, and the Swedish Research Council. Funder´s Role: The funders had no role in study design, data collection and analysis, decision to publish, or preparation of the manuscript.
measures for both clinicians and patients such as survival time and differences in survival
among different risk groups [2,3].
The purpose of this study was to assess the association of the MPI with future all-cause mor-tality and number of in-hospital days, for the first time in a population-based cohort. The data
regarding these outcomes spanned up to 11–13 years after the assessment of MPI.
Materials and Methods
Participants
We used data from the population-based Swedish National Study on Aging and Care in
Kung-sholmen (SNAC-K) [23]. The SNAC-K study population consists of persons aged 60 years and
older living at home or in an institution in the Kungsholmen district of central Stockholm. The study used stratified sampling by age (eleven different age groups: 60, 66, 72, 78, 81, 84, 87, 90, 93, 96, and 99 or older). Of the 5111 persons who were initially selected to be invited for partic-ipation, 521 were not eligible (200 died before start of the study, 262 had no contact informa-tion, 32 had moved, 23 did not speak Swedish, and 4 were deaf). Among the remaining 4590 persons, 3363 (73.3%) participated at the baseline examination. Baseline survey of all SNAC-K participants was conducted from 2001 through 2004. In this study we excluded: a) 753 partici-pants younger than 66 or older than 99 years, due to power restrictions. There were very few people at age 60 with medium or high risk MPI score (see next paragraph), and few people were 99+ years old; b) 110 participants missing MPI (based on six domains in the primary analyses, exclusive of Mini Nutritional Assessment-Short Form (MNA-SF)); and c) 28 people missing hospital data. This resulted in a study cohort of 2472 people for the primary analyses. In secondary analyses (examining MPI with seven domains, including MNA-SF in the index), an additional 235 participants were excluded due to missing MNA-SF, leaving an analytical sample of 2238 people. As approximately 10% of the study cohort were missing data on MNA-SF, it was decided to test MPI based on six domains, excluding MNA-SF in the primary analy-ses, yet to repeat all analyses with MPI based on seven domains, including MNA-SF in second-ary analyses.
Ethics
This study was conducted within the SNAC-K, which has the primary aim to increase our understanding of the aging process, and to identify possible preventive strategies to improve health and care in elderly adults. The study was approved by the Regional Ethical Review
Board (Regionala Etikprövningsnämnden) in Stockholm, Sweden (number: KI 01–114).
Writ-ten informed consent was collected from participants. For persons living in institutions for people with dementia, a proxy respondent (a next of kin or a legally authorized representative) was also asked for consent in addition to the participant. If possible, written consent was col-lected from the proxies. However often proxy consent was obtained via a phone call; in those cases only verbal consent was obtained. When verbal content was obtained, the time and date of the phone call was registered together with the names of the staff who asked for consent and the person who gave the consent. The participant had however always the right to refrain from participating in any or all parts of the study. When visiting the participant, the staff was always attentive to the person's willingness to answer questions or take part in the tests. If, during examination, the participant expressed anguish or discomfort then the interview ended, regardless of whether the person themselves, or a proxy, had given consent. If a person who did
not live in an institution and had consented to participate, scored22 on the Mini Mental
to hear that he or she did not oppose the participation. All parts of the study, including the con-sent procedure, was approved by the Regional Ethical Review Board.
Data collection
At baseline, data on date of birth, gender, functional, cognitive, and nutritional status, chronic diseases, medication use, and co-habitation status (living with someone, living alone, or being institutionalized) were collected at our research center via interviews and clinical examinations by trained staff. For those who agreed to participate but were unable or unwilling to come to the research center, examinations were conducted at home or institution (n = 706).
Information about thevital statusof the participants up until end of June 2014 was obtained
from the Swedish Death Registry. Information on thetotal number of hospital days in inpatient
carebetween the baseline examination and up until the end of January 2012 was retrieved from
the National Inpatient Registry.
Functional statuscomprised two domains of the MPI and was evaluated by number of per-sonal or instrumental Activities of Daily Living (P-ADL and I-ADL) that the participants man-aged independently. P-ADL included six basic daily activities (dressing, hygiene, bathing, feeding, continence, and transferring), and I-ADL included eight activities (managing finances, taking medications, using telephone, shopping, using transportation, preparing meals, clean-ing, and washing). For IADL, participants were coded as independent if they stated that they could do an activity, even if they never did, e.g. cleaning.
Global cognitive functioningwas assessed with the MMSE, instead of the short portable mental status questionnaire (SPMSQ), as the latter instrument was not available in SNAC-K. The MMSE is a commonly used screening test for dementia, and measures basic cognitive domains such as orientation, memory, attention, language, visuospatial, and executive
func-tioning (scores ranging from 0–30, and 30 representing the best performance) [24]. A
signifi-cant correlation between the MMSE and the SPMSQ has been reported [25].
Nutritional statuswas defined based on the Mini Nutritional Assessment-Short Form
(MNA-SF) [26]. The MNA-SF consists of six items from the full MNA, including declining
food intake, weight loss, mobility problems, psychological stress or acute disease, neuropsycho-logical problems such as dementia and depression, and body mass index (BMI). The MNA-SF features the same three categories as the full 18 item MNA (malnourished, at risk, and well
nourished) and has shown 90.8% agreement with the full MNA in the community-setting [27].
In this study, we used the MNA-SF, instead of the complete MNA, as in the original MPI [10].
A previous study on elderly hospitalized patients however found a MPI that included the
MNA-SF to be equally predictive of mortality as a MPI that included the full MNA [9].
Medical diagnoseswere made by the examining physicians based on the clinical examina-tion, medical history and laboratory data. Illness severity and comorbidity was assessed using
the Cumulative Illness Rating Scale (CIRS) [28], a standardized summary score which includes
the physician’s ratings of the degree of pathology in each of the following 13 major organ
sys-tems: cardiac, hypertension, vascular, respiratory, eye-ear-nose-throat, lower gastrointestinal, hepatic, renal, other genitourinary, musculoskeletal, neurological, endocrine-metabolic, and psychiatric behavioral disorders. The severity of impairment in each organ system is rated from 1 = none to 5 = extremely severe (impairment is life threatening). The CIRS score
(possi-ble range 0–13) was transformed into the Comorbidity Index (CIRS-CI) to reflect the number
of organ groups with at least moderate levels of pathology (grades 3–5) [28].
persons, a proxy or caregiver was asked instead. Before the interview, participants were instructed to bring a list of currently used medications. If the person was living in a nursing home, information on medication use was collected directly from medical records. The Ana-tomical Therapeutic Chemical (ATC) classification system was used to classify medications
[29].
Calculation of the MPI
We calculated the MPI as established in previous studies, with some modifications based on availability of data. We used seven of the original MPI domains: P-ADL, I-ADL, cognitive function (MMSE), illness severity and comorbidity (CIRS), the number of medications, and co-habitation status. As stated previously, approximately 10% of the study cohort was missing nutri-tional status via MNA-SF, so we calculated this index both excluding (primary analyses) and including (supplementary secondary analyses) this item. We also lacked pressure sore risk via the
Exton-Smith scale [10]. For each of the seven domains, a three-level score was assigned with
score 0 indicating low risk of mortality and/or longer hospitalization, score 0.5 indicating a mid-dle level of risk, and score 1 indicating high risk, as established previously in previous studies
[9,10]. Each domain was categorized as follows:number of independent P-ADL: 5–6 = score 0,
3–4 = score 0.5, and 0–2 = score 1;number of independent I-ADL: 6–8 = score 0, 4–5 = score 0.5,
and 0–3 = score 1;MMSE score [30]: 28–30 = score 0, 25–27 = score 0.5, and 0–24 = score 1;
CIRS score: 0 = score 0, 1–2 = score 0.5, and3 = score 1;number of medications: 0–3 = score 0,
4–6 = score 0.5, and7 = score 1;co-habitation status: living with someone = score 0, being
institutionalized = score 0.5, and living alone = score 1; andMNA-SF score:12 (well nourished)
= score 0, 8–11 (at risk) = score 0.5, and 0–7 (malnourished) = score 1 [9,10]. The sum of the
cal-culated scores was then divided by seven (when MNA-SF was included) or by 6 (when MNA-SF was excluded) to obtain a MPI risk score ranging between 0 and 1. As our aim was to verify the effectiveness of the previously established index in this population-based cohort, we used the
pre-viously defined cut points: MPI scores 0–0.33 were considered low risk, MPI scores 0.34–0.66
were considered medium risk, and MPI scores 0.67–1.0 were considered high risk [9,10].
Data analysis
Mean number of hospital days (within 1, 3 and 10 years from baseline visit) and 95% confi-dence intervals were calculated, by age group and MPI level, and quantitative tests for trend were performed across levels of MPI within each age group. Median time to death for medium and high MPI risk groups and 95% confidence intervals were calculated, in comparison to the
MPI low risk group using Laplace regression [31], in three separate sets of models: unadjusted,
adjusted only for age, and adjusted for age and gender. All analyses were stratified by four age groups: sexagenarians (age cohort 66), septuagenarians (age cohorts 72 and 78), octogenarians (age cohorts 81, 84 and 87) and nonagenarians (age cohorts 90, 93, 96, 99). This age stratifica-tion was necessary because as expected, both MPI and number of hospital days and time to death were highly correlated with age. However, the Laplace regression mortality analyses excluded sexagenarians as too few of this age group had died by the censoring date for mortal-ity. Statistical analyses were performed with STATA/SE 13.1 software (Texas, USA). Statistical
significance was based on p-values<0.05.
Results
During the follow-up 1331 persons (53.8%) died (maximum follow-up for mortality 12.8
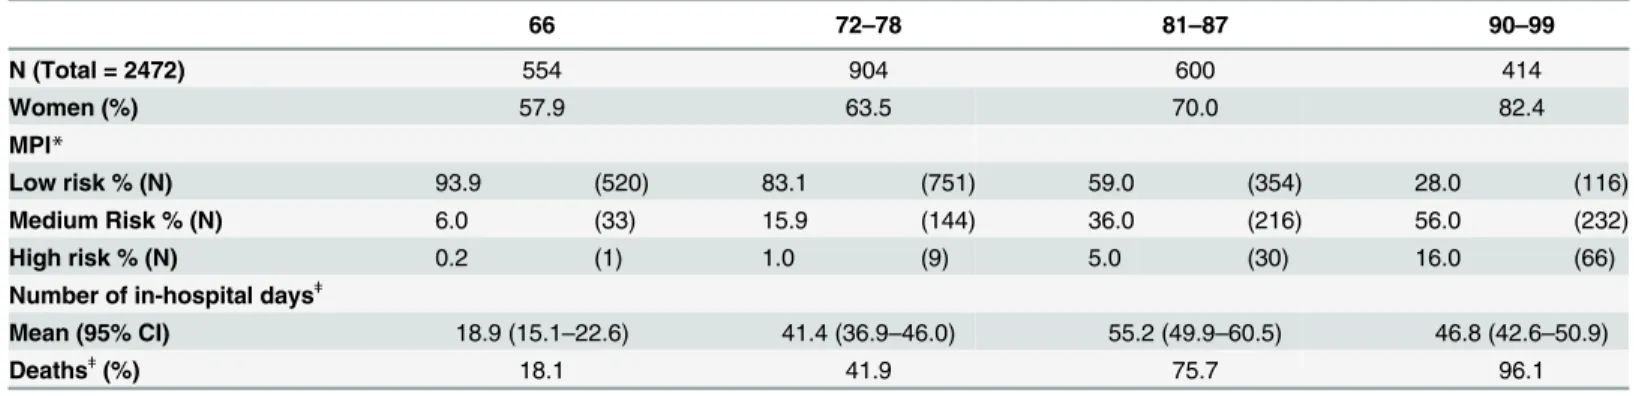
years). Characteristics of the study cohort are presented inTable 1, stratified by age group. As
sexagenarians had a low risk level of MPI (93.9%), which declined to 83.1% of septuagenarians,
59.0% of octogenarians, and only 28.0% of nonagenarians (Table 1). Having a high risk level of
MPI was uncommon in this population-based sample, extremely so in the younger two age groups, and reaching only 5% and 16% respectively amongst the octogenarians and nonagenari-ans. The mean number of days spent in hospital during the follow-up period was lowest amongst
the sexagenarians, but did not substantially differ amongst the oldest three age groups (Table 1).
Mean number of days spent in hospital within one year of the baseline visit were
signifi-cantly associated with MPI level of risk, for each age group (Table 2). Similarly and
consis-tently, significant findings were found for number of days spent in hospital within three years of the baseline visit. Findings were likewise similar even within 10 years from the baseline visit, although the association was attenuated in significance and linearity, with the highest number of hospital days being found in the moderate MPI risk category.
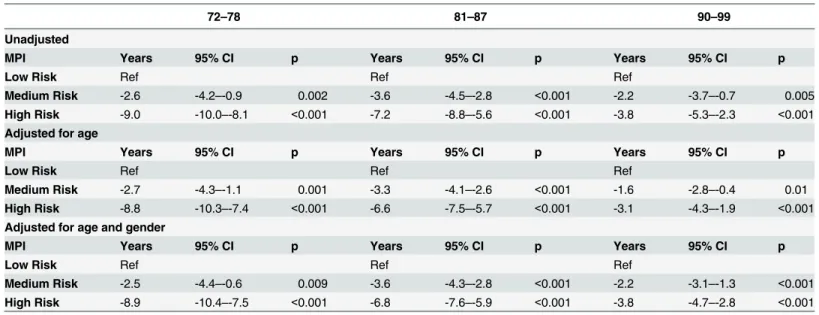
The median survival of people in medium risk MPI groups varied across age groups from
2.2–3.6 years earlier than for those in the low risk MPI group (p = 0.002-p<0.001), and the
median survival of people in high risk MPI groups varied by age from 3.8–9.0 years earlier than
for those in the low risk MPI group (p<0.001) (Table 3). Even among nonagenarians, the
median age at death was 3.8 years earlier for those in the high risk MPI group than for those in
the low risk MPI group (p<0.001). Controlling for age, or for age and gender, did not
substan-tially change the findings.
Sensitivity analyses repeated all of the main analyses using a differently calculated MPI
vari-able, which included nutritional status (using MNA-SF) (Tables A, B and C inS1 File). As
MNA-SF was missing in approximately 10% of the study population, primary analyses were conducted using MPI without MNA, to maximize power and size of the analytical sample. Generally, findings were substantially unchanged. However, there were no septuagenarians with a high level of MPI risk. Sensitivity analyses were also conducted stratifying by gender,
and stratifying by dementia status (Table D inS1 File), for the oldest two age groups (this was
not possible in the younger age groups, due to insufficient power for further stratification beyond age). The results were substantially unchanged from the primary analyses presented in
Table 3, except for shorter median time to death for persons with dementia in the high risk
MPI group, and loss of significance in the medium risk MPI group, which is at least partially due to insufficient power, as most persons with dementia would have had high risk MPI.
Table 1. Characteristics of the Study Cohort.
66 72–78 81–87 90–99
N (Total = 2472) 554 904 600 414
Women (%) 57.9 63.5 70.0 82.4
MPI*
Low risk % (N) 93.9 (520) 83.1 (751) 59.0 (354) 28.0 (116)
Medium Risk % (N) 6.0 (33) 15.9 (144) 36.0 (216) 56.0 (232)
High risk % (N) 0.2 (1) 1.0 (9) 5.0 (30) 16.0 (66)
Number of in-hospital daysǂ
Mean (95% CI) 18.9 (15.1–22.6) 41.4 (36.9–46.0) 55.2 (49.9–60.5) 46.8 (42.6–50.9)
Deathsǂ(%) 18.1 41.9 75.7 96.1
*Multidimensional Prognostic Index (MPI) aggregated six domains (personal and instrumental activities of daily living, cognitive function, illness severity and comorbidity, the number of medications, co-habitation status).
ǂA total follow-up time for mortality of a maximum of 12.8 years and for number of in-hospital days of a maximum of 10.8 years.
Discussion
In this population-based cohort, a modified version of the MPI has been found to associate both with future number of days in hospital and with mortality, across a broad age span from
Table 2. Mean Number of In-Hospital Days within 1, 3 and 10 Years Since Baseline, by Multidimensional Prognostic Index (MPI) Status and Age.
66 72–78 81–87 90–99
Mean number of in-hospital days (95% CI) within 1 year of baseline visit
MPI
Low Risk 2.9 (1.8–3.9) 4.3 (3.3–5.3) 7.8 (3.5–12.1) 11.0 (7.4–14.5)
Medium Risk 9.0 (3.3–14.6) 13.3 (9.0–17.6) 18.9 (14.7–23.1) 24.5 (20.7–28.3)
High Risk —- 30.1 (6.3–53.9) 28.2 (16.3–40.0) 30.7 (22.4–39.0)
p <0.001 <0.001 <0.001 <0.001
Mean number of in-hospital days (95% CI) within 3 years of baseline visit MPI
Low Risk 6.4 (4.5–8.3) 9.6 (8.0–11.2) 16.3 (11.3–21.4) 24.3 (19.3–29.3)
Medium Risk 14.6 (6.5–22.7) 27.4 (21.2–33.6) 34.0 (27.8–40.1) 37.1 (32.2–42.0)
High Risk —- 33.9 (6.8–61.0) 41.3 (21.0–61.6) 36.9 (26.4–47.3)
p <0.001 <0.001 <0.001 0.006
Mean number of in-hospital days (95% CI) within 10 years of baseline visit
MPI
Low Risk 17.4 (13.5–21.2) 37.9 (32.8–42.9) 48.7 (41.9–55.4) 46.8 (39.8–53.8)
Medium Risk 35.5 (19.6–51.4) 58.5 (48.0–69.0) 66.5 (57.2–75.8) 49.0 (43.3–54.6)
High Risk —- 34.6 (6.8–62.3) 45.7 (25.1–66.2) 37.9 (27.0–48.9)
p <0.001 0.005 0.006 0.176
Multidimensional Prognostic Index (MPI) aggregated six domains (personal and instrumental activities of daily living, cognitive function, illness severity and comorbidity, the number of medications, co-habitation status). Age group 66 with high risk MPI omitted, due to only one participant in this category.
doi:10.1371/journal.pone.0133789.t002
Table 3. Median Time to Death in Years, by Multidimensional Prognostic Index (MPI) Status and Age.
72–78 81–87 90–99
Unadjusted
MPI Years 95% CI p Years 95% CI p Years 95% CI p
Low Risk Ref Ref Ref
Medium Risk -2.6 -4.2–-0.9 0.002 -3.6 -4.5–-2.8 <0.001 -2.2 -3.7–-0.7 0.005 High Risk -9.0 -10.0–-8.1 <0.001 -7.2 -8.8–-5.6 <0.001 -3.8 -5.3–-2.3 <0.001 Adjusted for age
MPI Years 95% CI p Years 95% CI p Years 95% CI p
Low Risk Ref Ref Ref
Medium Risk -2.7 -4.3–-1.1 0.001 -3.3 -4.1–-2.6 <0.001 -1.6 -2.8–-0.4 0.01 High Risk -8.8 -10.3–-7.4 <0.001 -6.6 -7.5–-5.7 <0.001 -3.1 -4.3–-1.9 <0.001 Adjusted for age and gender
MPI Years 95% CI p Years 95% CI p Years 95% CI p
Low Risk Ref Ref Ref
Medium Risk -2.5 -4.4–-0.6 0.009 -3.6 -4.3–-2.8 <0.001 -2.2 -3.1–-1.3 <0.001 High Risk -8.9 -10.4–-7.5 <0.001 -6.8 -7.6–-5.9 <0.001 -3.8 -4.7–-2.8 <0.001
66–99 years. Although having a high level of MPI risk was relatively uncommon in this popula-tion-based cohort, it was still significantly associated with spending a greater number of days in hospital and a shorter time to death. Having a moderate level of MPI risk was not uncom-mon, particularly amongst octogenarians and nonagenarians (more than a third and a half of each age group respectively). The moderate level of MPI risk was also significantly associated with spending a greater number of days in hospital and a shorter time to death. Our results suggest a potential use for applying this prognostic index in the general population, in order to identify an at-risk segment of the population that may benefit from intervention or for public health planning of additional health care resources. The relatively large proportion of sexage-narians and septuagesexage-narians in the low risk category (94% of sexagesexage-narians and 83% of septuagenarians), however indicates that the MPI may be most useful to apply amongst octoge-narians and nonageoctoge-narians. Furthermore, our results indicate that MPI is most strongly
predic-tive of future number of in-hospital days within shorter lengths of follow-up (3 years) than
within longer lengths of follow-up (10 years), possibly due to the higher mortality risk amongst persons in the medium and high MPI risk categories.
Previous studies have also found prognostic associations of MPI with hospitalizations and with mortality, however they were not based on population-based cohorts, and they did not
look at long-term number of days in hospital or mortality [3,9–13,15,16,18,20]. One recent
study evaluated an instrument related to the MPI in community-dwelling older adults, called the MPI-SVaMA (a Multidimensional Prognostic Index for Mortality based on a Standardized
Multidimensional Assessment Schedule) [32]. This instrument varied substantially from the
standard MPI instrument, and it was evaluated only in relation to short-term mortality (1 month and 1 year). However, it was also found to be an effective prognostic tool for short-term mortality, which substantiates the flexibility and strength of even modified forms of the MPI as a tool that can be used in community-based settings, as well in hospital or institutional settings. However, this study selected participants to the cohort based on the requirement that they required public health care intervention or support, so they were likely not as healthy as the population-based cohort used in the present study, which was selected based on geography (and included people both living at home and in institutions within the geographically-defined area) not on care needs. An advantage of the MPI is that it is based on commonly assessed measures of morbidity, disability, cognitive, and nutritional status, and social factors. However, several other prognostic indices for all-cause mortality have been proposed, with substantive
differences in their ability to predict mortality [3,4]. Future studies should compare the
predic-tive ability of the MPI with other mortality indices in population-based studies of older adults. There are some limitations to this analysis. The MPI instrument investigated in the present study is a modified version of the original. First, the Exton-Smith Scale was excluded, as this data was not available in SNAC-K. In the development study of the original MPI on hospital-ized older patients, the Exton-Smith Scale was shown to be the strongest individual predictor of mortality. However, the prognostic value of the MPI was higher compared to those of the
individual components [10]. In addition, as the Exton-Smith Scale is an instrument to predict
risk of bed sores, this is not likely a risk that is impacting the vast majority of this population-based cohort. Second, we used MMSE instead of the SPMSQ, as the latter instrument was not available in SNAC-K. However, MMSE is a well-validated measure of cognitive status, and a
significant correlation with the SPMSQ has been reported [25]. Finally, our primary analysis
on elderly hospitalized patients found a MPI that included the MNA-SF to be equally
predic-tive of mortality as a MPI that included the full MNA [7]. Despite these modifications, MPI
was still found to be associated with both short and long-term outcomes of mortality and num-ber of in-hospital days. The ability of this index to associate with future numnum-ber of in-hospital days and death, even when using a modified version of the instrument, is a strength of the index, as it suggests it is sufficiently generalizable and flexible for implementation in various settings, which will possibly lack easy access to one or more components of the MPI, or will have variation in some of the items included in the instrument. Finally, for IADL the same cut
points are used for men and women in the MPI [9,10], which may create a potential bias.
However, participants were coded as independent if they stated that they could do an activity, even if they never did. In addition controlling for gender or stratifying by gender did not sub-stantially change the results of the analyses.
For the first time, the effectiveness of this modified version of the MPI has been verified in a population-based cohort, and across a broad and stratified age range. Higher MPI risk scores associated with more days in hospital within one and three years of the baseline examination and with fewer years of survival. Furthermore, our results indicate that the MPI may be partic-ularly useful among octogenarians and nonagenarians.
Supporting Information
S1 File. MPI_PLOS ONE_Angleman_Supporting Information_Tables.Table A. Character-istics of the Study Cohort, using MPI including MNA-SF. Table B. Mean Number of In-Hospi-tal Days within 1, 3and 10 Years Since Baseline, by Multidimensional Prognostic Index (MPI) Status and Age, using MPI including MNA-SF. Table C. Median Time to Death in Years, by MPI Status and Age, using MPI including MNA-SF. Table D. Median Time to Death in Years, by Multidimensional Prognostic Index (MPI) Status and Age, stratified by gender or by dementia status.
(DOCX)
Acknowledgments
In addition to the funding agencies, the authors would also like to extend their gratitude to the invaluable contributions by the study participants and data collection staff of SNAC-K, as well
as to all of the members of the EC funded MPI_AGE Project Investigators.^ ^EU funded
MPI_AGE Project Investigators: Alfonso Cruz-Jentoft, Hospital Universitario Ramòn y Cajal, Madrid, Spain; Massimiliano Copetti, Unit of Biostatistics, IRCCS Casa Sollievodella Soffer-enza, San Giovanni Rotondo, Foggia, Italy; Stefania Maggi, EUGMS Representative and National Research Council, Neuroscience Section, Padova, Italy; Francesco Mattace-Raso, Erasmus Medical Center, Rotterdam, The Netherlands; Marc Paccalin, University Hospital of Poitiers, France; Maria Cristina Polidori, Geriatrics Department, University of Cologne, Cologne, Germany; Daniele Sancarlo, Geriatric-Gerontology Research Laboratory, IRCCS Casa Sollievodella Sofferenza, San Giovanni Rotondo, Foggia, Italy; Eva Topinkova, University Charles I, Prague, Czech Republic; Gianluca Trifirò, Erasmus Medical Center, Rotterdam, The Netherlands and University of Messina, Italy. Dr. Pilotto is Project Leader for the MPI_AGE
European Project. E-mail:[email protected]
Author Contributions
References
1. Reuben DB. Medical Care for the Final Years of Life "When You're 83, It's Not Going to Be 20 Years". JAMA 2009; 302(24):2686–2694. doi:10.1001/jama.2009.1871PMID:20040557
2. Gill TM. The Central Role of Prognosis in Clinical Decision Making. JAMA 2012; 307(2):199–200. doi:
10.1001/jama.2011.1992PMID:22235093
3. Yourman LC, Lee SJ, Schonberg MA, Widera EW, Smith AK. Prognostic Indices for Older Adults A Systematic Review. JAMA 2012; 307(2):182–192. doi:10.1001/jama.2011.1966PMID:22235089 4. Theou O, Brothers TD, Mitnitski A, Rockwood K. Operationalization of Frailty Using Eight Commonly
Used Scales and Comparison of Their Ability to Predict All-Cause Mortality. J Am Ger Soc 2013; 61 (9):1537–1551.
5. Barnett K, Mercer SW, Norbury M, Watt G, Wyke S, Guthrie B. Epidemiology of multimorbidity and implications for health care, research, and medical education: a cross-sectional study. Lancet 2012; 380(9836):37–43. doi:10.1016/S0140-6736(12)60240-2PMID:22579043
6. Santoni G, Angleman S, Welmer AK, Mangialasche F, Marengoni A, Fratiglioni L. Age-related variation in health status after age 60. PLoS One 2005; 10:e0120077.
7. Gill TM, Gahbauer EA, Han L, Allore HG. Trajectories of Disability in the Last Year of Life. N Eng J Med 2010; 362(13):1173–1180.
8. Ellis G, Whitehead MA, Robinson D, O'Neill D, Langhorne P. Comprehensive geriatric assessment for older adults admitted to hospital: meta-analysis of randomised controlled trials. Br Med J 2011; 343.
9. Sancarlo D, D'Onofrio G, Franceschi M, Scarcelli C, Niro V, Addante F, et al. Validation of a modified-multidimensional prognostic index (m-MPI) including the mini nutritional assessment short-form (MNA-SF) for the prediction of one-year mortality in hospitalized elderly patients. J Nutr Health Aging 2011; 15(3):169–173. PMID:21369662
10. Pilotto A, Ferrucci L, Franceschi M, D'Ambrosio LP, Scarcelli C, Cascavilla L, et al. Development and validation of a multidimensional prognostic index for one-year mortality from comprehensive geriatric assessment in hospitalized older patients. Rejuvenation Res 2008; 11(1):151–161. doi:10.1089/rej.
2007.0569PMID:18173367
11. Sancarlo D, Pilotto A, Panza F, Copetti M, Longo MG, D'Ambrosio P, et al. A Multidimensional Prognos-tic Index (MPI) based on a comprehensive geriatric assessment predicts short- and long-term all-cause mortality in older hospitalized patients with transient ischemic attack. J Neurology 2012; 259(4):670– 678.
12. Pilotto A, Panza F, Sancarlo D, Paroni G, Maggi S, Ferrucci L. Usefulness of the multidimensional prog-nostic index (MPI) in the management of older patients with chronic kidney disease. J Nephrol 2012; 25:S79–S84. doi:10.5301/jn.5000162PMID:22641578
13. Pilotto A, Addante F, Ferrucci L, Leandro G, D'Onofrio G, Corritore M, et al. The Multidimensional Prog-nostic Index Predicts Short- and Long-Term Mortality in Hospitalized Geriatric Patients With Pneumo-nia. J Gerontol A Biol Sci Med Sci 2009; 64(8):880–887. doi:10.1093/gerona/glp031PMID:19349589 14. Pilotto A, Addante F, Franceschi M, Leandro G, Rengo G, D'Ambrosio P, et al. Multidimensional
Prog-nostic Index Based on a Comprehensive Geriatric Assessment Predicts Short-Term Mortality in Older Patients With Heart Failure. Circ-Heart Fail 2010; 3(1):14–20. doi:10.1161/CIRCHEARTFAILURE.
109.865022PMID:19850698
15. Pilotto A, Sancarlo D, Panza F, Paris F, D'Onofrio G, Cascavilla L, et al. The Multidimensional Prognos-tic Index (MPI), Based on a Comprehensive Geriatric Assessment, Predicts Short- and Long-Term Mor-tality in Hospitalized Older Patients with Dementia. J Alzheimers Dis 2009; 18(1):191–199. doi:10.
3233/JAD-2009-1139PMID:19584441
16. Gallucci M, Battistella G, Bergamelli C, Spagnolo P, Mazzuco S, Carlini A, et al. Multidimensional Prog-nostic Index in a Cognitive Impairment Outpatient Setting: Mortality and Hospitalizations. The Treviso Dementia (TREDEM) Study. J Alzheimers Dis 2014; 42(4):1461–1468. doi:10.3233/JAD-140516 PMID:25024343
17. Pizzato S, Sergi G, Bolzetta F, De Rui M, De Ronch I, Carraro S, et al. Effect of weight loss on mortality in overweight and obese nursing home residents during a 5-year follow-up. Eur J Clin Nutr. 2015 Mar 11. doi:10.1038/ejcn.2015.19[Epub ahead of print].
18. Pilotto A, Rengo F, Marchionni N, Sancarlo D, Fontana A, Panza F, et al. Comparing the Prognostic Accuracy for All-Cause Mortality of Frailty Instruments: A Multicentre 1-Year Follow-Up in Hospitalized Older Patients. PLoS One 2012; 7(1):9.
19. Condelius A, Edberg AK, Jakobsson U, Hallberg IR. Hospital admissions among people 65+related to multimorbidity, municipal and outpatient care. Arch Gerontol Geriatr 2008; 46(1):41–55. PMID:
20. Volpato S, Bazzano S, Fontana A, Ferrucci L, Pilotto A. Multidimensional Prognostic Index Predicts Mortality and Length of Stay During Hospitalization in the Older Patients: A Multicenter Prospective Study. J Gerontol A Biol Sci Med Sci 2015; 70 (3): 323–9.
21. Calonge N, Petitti DB, DeWitt TG, Dietrich AJ, Gregory KD, Harris R, et al. Screening for Colorectal Cancer: US Preventive Services Task Force Recommendation Statement. Ann Intern Med 2008; 149 (9):627–+. PMID:18838716
22. American Diabetes Association. Standards of Medical Care in Diabetes-2012. Diabetes Care 2012; 35 (1):S11–S63.
23. Lagergren M, Fratiglioni L, Hallberg IR, Berglund J, Elmståhl S, Hagberg B, et al. A longitudinal study integrating population, care and social services data. The Swedish National study on Aging and Care (SNAC). Aging Clin Exp Res 2004; 16:158–168. PMID:15195992
24. Folstein MF, Folstein SE, McHugh PR. "Mini-mental state". A practical method for grading the cognitive state of patients for the clinician. J Psychiatr Res 1975; 12(3):189–198. PMID:1202204
25. Hooijer CD, M; Jonker C; Lindeboom J. Short screening-tests for dementia in the elderly population. I. A comparison between AMTS, MMSE, MSQ and SPMSQ. Int J Geriatr Psychiatr 1992; 7:559–571. 26. Kaiser MJ, Bauer JM, Ramsch C, Uter W, Guigoz Y, Cederholm T, et al. Validation of the Mini Nutri-tional Assessment short-form (MNAA (R)-SF): A practical tool for identification of nutriNutri-tional status. J Nutr Health Aging 2009; 13(9):782–788. PMID:19812868
27. Kaiser MJ, Bauer JM, Uter W, Donini LM, Stange I, Volkert D, et al. Prospective Validation of the Modi-fied Mini Nutritional Assessment Short-Forms in the Community, Nursing Home, and Rehabilitation Setting. J Am Ger Soc 2011; 59(11):2124–2128.
28. Parmelee PA, Thuras PD, Katz IR, Lawton MP. Validation of the Cumulative Illnes Rating-Scale in a geriatric residential population. J Am Geriatr Soc 1995; 43(2):130–137. PMID:7836636
29. WHO Collaborating Center for Drug Statistics Methodology. Guidelines for ATC classification and DDD assignment, 2015. 2014.
30. O'Bryant SE, Humphreys JD, Smith GE, Ivnik RJ, Graff-Radford NR, Petersen RC, et al. Detecting dementia with the mini-mental state examination in highly educated individuals. Arch Neurology 2008; 65(7):963–967.
31. Bottai M, Zhang J. Laplace regression with censored data. Biom J 2010; 52: 487–503. doi:10.1002/
bimj.200900310PMID:20680972