© Author(s) 2014. CC Attribution 3.0 License.
Implementation of a soil albedo scheme in the CABLEv1.4b
land surface model and evaluation against MODIS
estimates over Australia
J. Kala1, J. P. Evans1, A. J. Pitman1, C. B. Schaaf2, M. Decker1, C. Carouge1, D. Mocko3, and Q. Sun2
1Australian Research Council Centre of Excellence for Climate Systems Science and Climate Change Research Centre,
University of New South Wales, Sydney, NSW, 2052, Australia
2Science Applications International Corporation at NASA Goddard Space Flight Centre, NASA, Greenbelt, MD, USA 3Department of Earth and the Environment, Boston University, Boston, MA, USA
Correspondence to:J. Kala ([email protected], [email protected])
Received: 23 January 2014 – Published in Geosci. Model Dev. Discuss.: 13 March 2014 Revised: 20 August 2014 – Accepted: 23 August 2014 – Published: 23 September 2014
Abstract.Land surface albedo, the fraction of incoming so-lar radiation reflected by the land surface, is a key com-ponent of the Earth system. This study evaluates snow-free surface albedo simulations by the Community Atmosphere Biosphere Land Exchange (CABLEv1.4b) model with the Moderate Resolution Imaging Spectroradiometer (MODIS) and the Satellite Pour L’Observation de la Terre (SPOT) albedo. We compare results from offline simulations over the Australian continent. The control simulation has prescribed background snow-free and vegetation-free soil albedo de-rived from MODIS whilst the experiments use a simple pa-rameterisation based on soil moisture and colour, originally from the Biosphere Atmosphere Transfer Scheme (BATS), and adopted in the Common Land Model (CLM). The control simulation, with prescribed soil albedo, shows that CABLE simulates overall albedo over Australia reasonably well, with differences compared to MODIS and SPOT albedos within ±0.1. Application of the original BATS scheme, which uses an eight-class soil classification, resulted in large differences of up to−0.25 for the near-infrared (NIR) albedo over large parts of the desert regions of central Australia. The use of a recalibrated 20-class soil colour classification from the CLM, which includes a higher range for saturated and VIS (visi-ble) and NIR soil albedos, reduced the underestimation of the NIR albedo. However, this soil colour mapping is tuned to CLM soil moisture, a quantity which is not necessarily transferrable between land surface models. We therefore re-calibrated the soil color map using CABLE’s climatologi-cal soil moisture, which further reduced the underestimation
of the NIR albedo to within±0.15 over most of the conti-nent as compared to MODIS and SPOT albedos. Small ar-eas of larger differences of up to −0.25 remained within the central arid parts of the continent during summer; how-ever, the spatial extent of these large differences is substan-tially reduced as compared to the simulation using the default eight-class uncalibrated soil colour map. It is now possible to use CABLE coupled to atmospheric models to investigate soil-moisture–albedo feedbacks, an important enhancement of the model.
1 Introduction
The albedo of the land surface is the ratio of upwelling to downwelling shortwave radiation and determines the frac-tion of incoming solar radiafrac-tion reflected back to the atmo-sphere. It is one of the key drivers of the Earth’s climate as it determines, in part, the amount of energy available to drive processes in the atmosphere and the land surface (e.g. Dickinson, 1983). The incorrect prescription or parameter-isation of surface albedo can result in large model biases. Therefore, the correct representation of albedo in land sur-face models (LSMs), whether prescribed or parameterised, is of critical importance to the surface energy and hydrological cycle.
influence on the overall surface albedo is the fractional area covered by each of vegetation, soil and snow. These are com-monly parameterised as a function of leaf area index (LAI), the total one-sided surface area of leaf per ground surface area (Bonan, 2008). When LAI is high, most of the incom-ing solar energy is reflected, scattered, and/or absorbed by the vegetation canopy and only a small proportion of radia-tion reaches the ground; the overall albedo is primarily that of the vegetation canopy. When LAI is small, the converse is true and the overall albedo is increasingly represented by the albedo of the soil or snow.
Vegetation albedo is a function of the radiative properties of the canopy. These properties include the leaf transmittance and reflectance, leaf angle or orientation, canopy clumping, and structure. Leaf transmittance and reflective properties de-termine how much radiation penetrates through the canopy and are usually prescribed in LSMs for each plant functional type (PFT) in the visible (VIS, 0.4–0.7 µm) and near-infrared (NIR, 0.7–4.0 µm) bands. This distinction is important since green canopies absorb most of the solar radiation in the VIS waveband for photosynthesis but reflect and transmit most of the radiation in the NIR waveband (Bonan, 2008). Leaf structural and physical properties can also influence within-canopy shadowing, which allows higher exposure of the un-derlying soil and/or snow cover, especially in low-density forests (Davidson and Wang, 2004). Leaf orientation influ-ences albedo since the maximum incident solar radiation on a leaf occurs when the beam is perpendicular to the surface (Bonan, 2008).
Soil albedo is a function of soil colour, determined partly by organic composition and soil moisture, with saturated soils generally having lower albedo than dry soils (Idso et al., 1975). This is especially important in transitional climatic regions, where significant soil moisture variability drives strong land–atmosphere coupling (e.g. Koster et al., 2004). Although the dependence of soil albedo on soil moisture has been well established from field experiments (e.g. Idso et al., 1975), not all LSMs include this feedback and re-cent studies have shown that it plays in important role in seasonal droughts in the central US (Zaitchik et al., 2013). Recent studies over eastern Australia have shown that the use of time-varying MODIS albedo (as opposed to monthly mean climatologies from Advanced Very High Resolution Radiometer (AVHRR)) in a regional climate model improved mean air temperature simulations and, to a lesser extent, pre-cipitation (Meng et al., 2013). This was particularly evident in arid regions where the overall albedo is predominantly in-fluenced by soil rather than vegetation.
Vegetation and soil albedo are also influenced by the solar zenith angle, especially in desert regions (Wang et al., 2005). This only applies under clear-sky conditions (i.e. direct-beam radiation) when there is little or no scattering of the incom-ing shortwave radiation. In the mornincom-ing just after sunrise and late afternoon before sunset, albedo is generally higher as compared to midday when the sun is directly overhead. The
inclusion of soil and vegetation albedo dependence on solar zenith angle during clear-sky conditions has improved albedo simulations in some LSMs (Liang et al., 2005).
With recent developments in satellite remote sensing, sev-eral surface albedo products are now available at a high spa-tial and temporal resolution and spanning several years. This has allowed for the careful evaluation of albedo in various LSMs (e.g. Wei et al., 2001; Oleson et al., 2003; Zhou et al., 2003; Wang et al., 2004) and the development of vegetation and soil albedo parameterisations (e.g. Liang et al., 2005; Yang et al., 2008). These remotely sensed products have also allowed the mapping of land surface parameters, such as the spatial and temporal distribution of PFTs, LAI, and soil colour, for use in LSMs (Lawrence and Chase, 2007). Clearly, the use of satellite remote sensing can be very useful in both the evaluation and development of LSMs.
This paper focusses on the Community Atmosphere Bio-sphere Land Exchange (CABLE) model (Wang et al., 2011), an LSM designed to simulate fluxes of heat, moisture, and carbon at the land surface. While several studies have used CABLE (e.g. Cruz et al., 2010; Zhang et al., 2011; Pit-man et al., 2011; Wang et al., 2012; Exbrayat et al., 2013), previous studies have not explicitly examined simulations of surface albedo. The aim of this paper is to address this key knowledge gap by comparing CABLE albedo simula-tions with remotely sensed albedo estimates to better quan-tify the uncertainties in CABLE’s albedo parameterisation. Section 2 provides an overview of CABLE with detailed de-scription of the parameterisation of surface albedo. This is followed by the experimental design and description of the satellite remote-sensing products used to benchmark the CA-BLE albedo simulations. Results are presented in Sect. 3 and discussed in Sect. 4.
2 Methods
2.1 Model description
CABLE simulates fluxes of energy, water, and carbon at the land surface and can be run as an offline model with pre-scribed meteorology (e.g. Abramowitz et al., 2008; Wang et al., 2011; Kala et al., 2014) or fully coupled to an atmo-spheric model within a global (Mao et al., 2011; Lorenz et al., 2014) or regional context (Hirsch et al., 2014). CABLE is a key part of the Australian Community Climate Earth System Simulator (ACCESS, see http://www.accessimulator.org.au), a fully coupled Earth system science model used in the Cou-pled Model Intercomparison Project Phase 5 (CMIP-5) . The version used in this study is CABLEv1.4b.
Snow‐free surface albedo (NIR and VIS) (Eq. A1) Direct combined effective canopy and soil reflectance (Eq. A2) Diffused combined effective canopy and soil reflectance (Eq. A3) Direct canopy reflectance (Eq. A4) Soil reflectance (prescribed) Direct canopy extinction coefficient (Eq. A6) Diffuse canopy reflectance (Eq. A5) Diffuse canopy extinction coefficient (Eq. A6) LAI (prescribed) Extinction coefficient for black canopy for direct radiation (Eqs A7,9,10,11) Extinction coefficient for black canopy for diffuse radiation (Eq. A8) Reflectance of horizontally homogeneous black canopy (Eq. A12) Solar zenith angle (θin Eqs.
A5,7,9) Leaf angle (prescribed) Leaf transmittance and reflectance (NIR and VIS, prescribed) Fraction of direct‐beam shortwave
radiation (fb term in Eq. A1,
empirically determined when offline or from atmospheric model
when coupled)
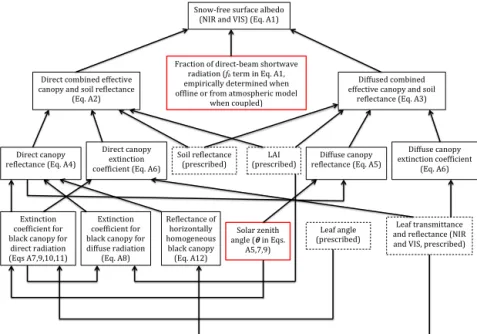
Figure 1.Schematic illustration of snow-free surface albedo parameterisation in CABLE. Boxes with dashed lines represent user-defined input parameters to the model. The boxes with solid black lines represent the equations described in Appendix A and the boxes in solid red lines represent terms used in the equations.
and aerodynamic resistance. The model also consists of a sur-face flux module to compute the sensible and latent heat flux from the canopy and soil, the ground heat flux, as well as net photosynthesis. A soil module is used for the transfer of heat and water within the soil and snow, and an ecosystem car-bon module based on Dickinson et al. (1998) is used for the terrestrial carbon cycle. A detailed description of each of the modules can be found in Kowalczyk et al. (2006) and Wang et al. (2011).
Land albedo in CABLE is a function of the vegetation albedo, snow albedo, and the background-snow-free and vegetation-free soil albedo (the fractional albedo of inland water surfaces was not considered in the simulations). The parameterisation of albedo is part of the canopy radiative transfer model. The latter accounts for direct-beam and dif-fuse radiation separately, and within each stream, albedo is computed separately in the NIR and VIS wavebands as plants utilise energy differently in these two parts of the spectrum. Appendix A provides a detailed description of the albedo pa-rameterisation, and a schematic illustration is presented in Fig. 1.
The overall albedo of the surface (snow-free) is a function of the direct and diffuse effective reflectances and the fraction of direct-beam shortwave radiation in the NIR and VIS wave-bands (Eq. A1 and Fig. 1). When running CABLE offline, the fraction of direct-beam shortwave radiation is computed em-pirically from incoming shortwave radiation (meteorological input to the model), solar constant, Julian day of year, and solar zenith angle, following Spitters (1986). When coupled, it is provided by the atmospheric radiation module. The di-rect and diffuse effective reflectances are a function of the
canopy reflectance and extinction coefficients for direct and diffuse radiation, the soil reflectance, and LAI (see Eqs. A2 and A3 and Fig. 1). In CABLEv1.4b, LAI is prescribed as the model does not include a dynamic vegetation model or dynamic phenology. The soil reflectance is derived from the prescribed background snow-free soil albedo and vegetation-free soil albedo.
The canopy reflectance for direct radiation is a function of the direct and diffuse extinction coefficients for a black canopy and the reflectance of a homogenous canopy with horizontal black leaves (Eq. A4). The canopy reflectance for diffuse radiation is, in turn, dependent on the canopy reflectance for direct radiation, and the solar zenith angle (Eq. A5). The extinction coefficients for direct and diffuse radiation are a function of the corresponding extinction co-efficients for a black canopy and the leaf transmittance and reflectance (Eq. A6). The direct and diffuse extinction co-efficients for a black canopy are a function of solar zenith angle, LAI, and leaf angle (Eqs. A7 to A11). Finally, the re-flectance of a horizontal homogeneous canopy with horizon-tal black leaves is also a function of the leaf radiative prop-erties (Eq. A12). In summary, the albedo parameterisation in CABLE is reasonably complex, as illustrated in Fig. 1. User-defined input parameters which influence albedo are the LAI, background-snow and vegetation-free soil albedo, leaf angle, and the leaf transmittance and reflectance.
Figure 2. (a)Distribution of PFTs in the domain,(b)prescribed background-snow-free soil albedo from Houldcroft et al. (2009) used in the CNTL experiment, and(c)soil colours used in the PSALB experiment. The PFTs in panel(a)are shown in Table 2.
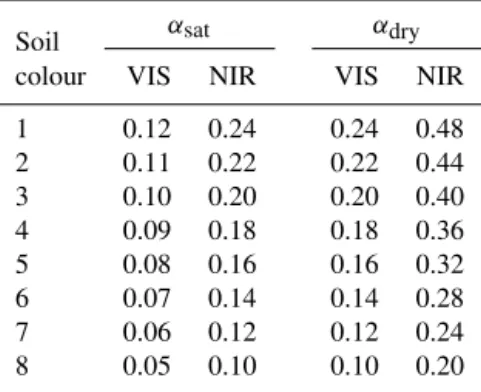
shown to be important (e.g. Vamborg et al., 2011; Za-itchik et al., 2013), we added a simple parameterisation based on soil colour and moisture, originally developed for the Biosphere-Atmosphere Transfer Scheme (BATS) LSM (Dickinson et al., 1993) and adopted by the Common Land Model (CLM) (Zhou et al., 2003):
αsoil=αsat+minαsat,max0.11(11−40θsm), αdry , (1)
whereαsatandαdryare the albedo of saturated and dry soils
respectively, dependent on the soil colour (light to dark, see Table 1), andθsmis the surface volumetric soil moisture
con-tent. The saturated- and dry-soil albedos in the VIS wave-band as shown in Table 1 are simply assumed to be twice those in the NIR waveband. As noted by Wang et al. (2004), this assumption is not unreasonable, although some studies have shown that this ratio varies geographically (Tsvetsin-skaya et al., 2002).
2.2 Simulations
CABLEv1.4b was used within the NASA Land Informa-tion System (LIS-6.1) (Kumar et al., 2006, 2008), a flexi-ble software platform designed as a land surface modelling and hydrological data assimilation system. A grid resolution of 0.25◦×0.25◦was utilised, covering continental Australia. Our domain is shown in Fig. 2a which also illustrates the dis-tribution of PFTs used (Table 2). The model was forced with the Modern-Era Retrospective Analysis for Research and Applications (MERRA) reanalysis (Rienecker et al., 2011) at 3-hourly intervals from 2001 to 2008 and initialised from a previous 30-year spin-up. This year range was chosen as it corresponded with the availability of the remotely sensed albedo products. The forcing variables included incoming long-wave and shortwave radiation, air temperature, specific humidity, surface pressure, wind speed, and precipitation. The MERRA reanalysis was bias-corrected for precipitation using the Australian Bureau of Meteorology Australian Wa-ter Availability gridded precipitation data set (Jones et al., 2009), following Decker et al. (2013). A monthly mean MODIS-derived LAI climatology from Yuan et al. (2011) was used for the simulations as shown in Fig. 3. Although monthly mean values are used in the simulations, we show seasonal means in Fig. 3 to help the interpretation of seasonal
Table 1.Saturated- and dry-soil albedos for different soil colours (Fig. 2c) in the VIS and NIR wavebands.
Soil αsat αdry
colour VIS NIR VIS NIR
1 0.12 0.24 0.24 0.48
2 0.11 0.22 0.22 0.44
3 0.10 0.20 0.20 0.40
4 0.09 0.18 0.18 0.36
5 0.08 0.16 0.16 0.32
6 0.07 0.14 0.14 0.28
7 0.06 0.12 0.12 0.24
8 0.05 0.10 0.10 0.20
differences in albedo in Sect. 3. Monthly ambient carbon dioxide concentrations were prescribed using measurements from Baring Head, New Zealand (Keeling et al., 2005). Out-puts were saved every hour for the direct and combined (di-rect and diffuse) albedos in the VIS and NIR wavebands re-spectively.
Figure 3.Seasonal mean LAI from Yuan et al. (2011) (monthly means are used in the simulations).
Table 2. Names of plant functional types (PFTs) and soil types shown in Fig. 2a.
PFT number PFT
1 Evergreen needleleaf 2 Evergreen broadleaf 3 Deciduous needleleaf 4 Deciduous broadleaf 5 Mixed forest 6 Closed shrublands 7 Open shrublands 8 Woody savannas 9 Savannas 10 Grasslands 11 Permanent wetlands 12 Croplands
13 Urban and built-up 14 Cropland mosaics 15 Snow and ice 16 Barren
CNTL and PSALB simulations, leaf transmittance and re-flectance properties and leaf angles were prescribed for each PFT following previous studies using CABLE (Pitman et al., 2011; Avila et al., 2012). Sample model name list files for the CNTL and PSALB experiments are available online at https://bitbucket.org/jkala/gmd-2014-9/src.
2.3 MODIS albedo
The albedo products from MODIS have been extensively used for the purpose of evaluating albedo from various LSMs (Oleson et al., 2003; Zhou et al., 2003; Wang et al., 2004). In this study, we used the MODIS MCD43GF (MCD stands for (MODIS Combined Terra and Aqua), GF stands for: Gap-free) 30-arc-second gap-filled snow-free albedo product (available at http://www.umb.edu/spectralmass/terra_aqua_ modis/modis_brdf_albedo_cmg_gap_filled_snow_free_ product_mcd43gf_v005). The MCD43D product utilises di-rectional reflectances from both the Aqua and Terra MODIS instruments to retrieve an appropriate surface anisotropy model and thus intrinsic measures of surface albedo (Lucht et al., 2000; Schaaf et al., 2002; Wang et al., 2004). The MCD43 product is validated to stage 3 signifying that the
high-quality retrievals are within 5 % of field measurements. Additionally, a very recent field evaluation of the MCD43A product (the standard 500 m MCD43 product from which the MCD43D is derived) found root mean square errors of less than 0.03 over agricultural and grassland sites, and less than 0.02 over forested sites, during dormant snow-free periods (Wang et al., 2014). To avoid interpreting results that are within observational uncertainty, we only show differences between the MODIS and the simulated albedo which are greater than 0.05. The MCD43D product also provides data quality flags for each grid cell, and approximately 75 % of grid cells over the domain of interest were classified as high-quality (flags 0 and 1), and 25 % were temporally fitted (flag 2). These temporally fitted points were mostly confined to north of 20◦S, i.e. the northern tropical regions where cloud fraction is generally high.
To enable comparison with the simulations, the MODIS albedo products were interpolated to the grid domain used for the simulations. Following previous studies (Oleson et al., 2003; Zhou et al., 2003; Wang et al., 2004), we compared the CABLE-simulated direct-beam VIS and NIR albedos at local solar noon (obtained by combining the appropriate longitude bands from hourly outputs) to the VIS and NIR black-sky albedos from MODIS. The MCD43 product retrieval is at-tempted every 8 days over 16 days of potential input. We computed means of the local solar noon direct VIS and NIR direct-beam albedos from CABLE over the same time inter-val of data availability to enable more meaningful compar-isons. The CABLE combined (direct and diffuse) VIS and NIR albedos were compared to the MODIS blue-sky VIS and NIR albedos. The MODIS blue-sky albedo represents both the diffuse and direct radiation and uses MODIS aerosol op-tical depth (the MOD04 product), where available, or 0.2 as a mean climatology, where unavailable. The blue-sky albedo used here is also valid at local solar noon and hence is com-pared with the CABLE combined VIS and NIR albedos at the same time.
2.4 SPOT albedo
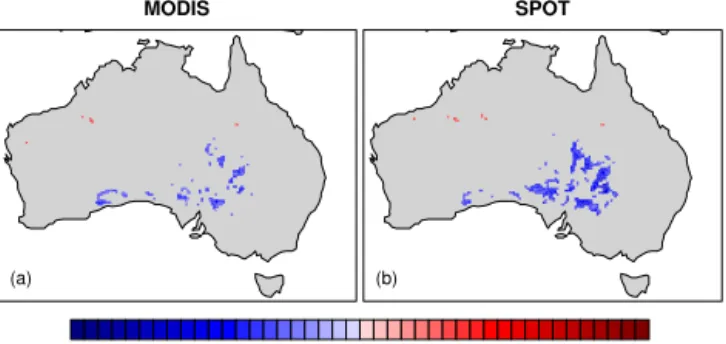
Figure 4.Yearly and seasonal difference between MODIS and SPOT (MODIS-SPOT) VIS and NIR black-sky albedo.
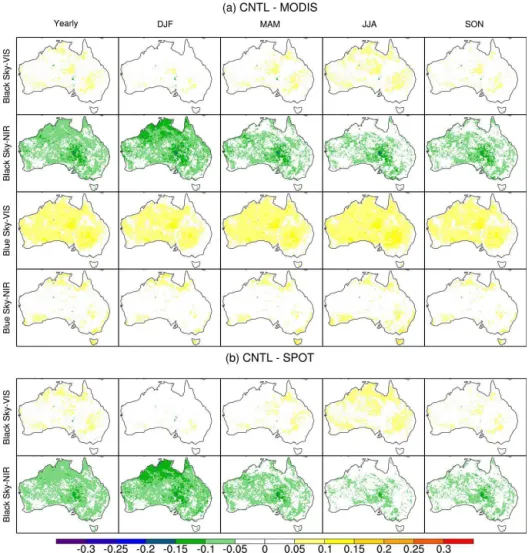
Figure 5.Mean yearly and seasonal differences between(a)CNTL and MODIS albedo (CNTL-MODIS) and(b)CNTL and SPOT albedo (CNTL-SPOT) over the period 2001–2008. December-January-February (DJF) is summer; March-April-May (MAM) is autumn; June-July-August (JJA) is winter; September-October-November (SON) is spring.
Satellite Pour L’Observation de la Terre (SPOT) albedo prod-uct (Lacaze et al., 2012). This data set comprises a black-and-white-sky albedo at a 10-day frequency and a resolution of 1/112 of a degree (approximately 0.89 km). The SPOT product has not undergone as extensive a field evaluation
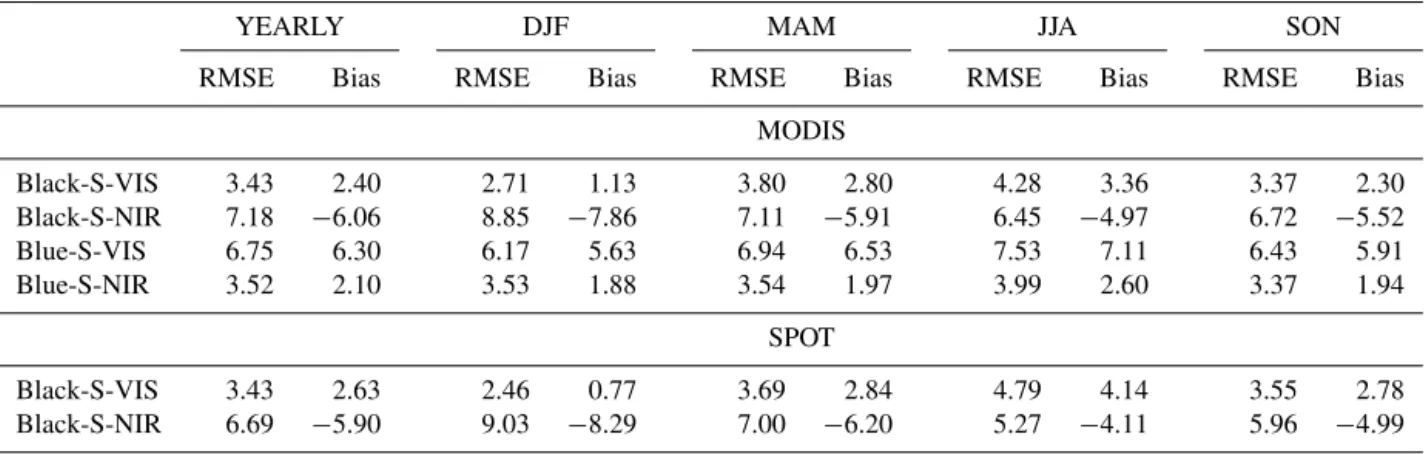
Table 3.Root mean square error (RMSE) and bias (scaled by 100) between the CNTL experiment and MODIS and SPOT black-sky (Black-S) visible (VI(Black-S) and near-infrared (NIR) albedo on the one hand and MODIS blue-sky (Blue-(Black-S) VIS and NIR albedo on the other hand on a yearly and seasonal timescale.
YEARLY DJF MAM JJA SON
RMSE Bias RMSE Bias RMSE Bias RMSE Bias RMSE Bias
MODIS
Black-S-VIS 3.43 2.40 2.71 1.13 3.80 2.80 4.28 3.36 3.37 2.30
Black-S-NIR 7.18 −6.06 8.85 −7.86 7.11 −5.91 6.45 −4.97 6.72 −5.52
Blue-S-VIS 6.75 6.30 6.17 5.63 6.94 6.53 7.53 7.11 6.43 5.91
Blue-S-NIR 3.52 2.10 3.53 1.88 3.54 1.97 3.99 2.60 3.37 1.94
SPOT
Black-S-VIS 3.43 2.63 2.46 0.77 3.69 2.84 4.79 4.14 3.55 2.78
Black-S-NIR 6.69 −5.90 9.03 −8.29 7.00 −6.20 5.27 −4.11 5.96 −4.99
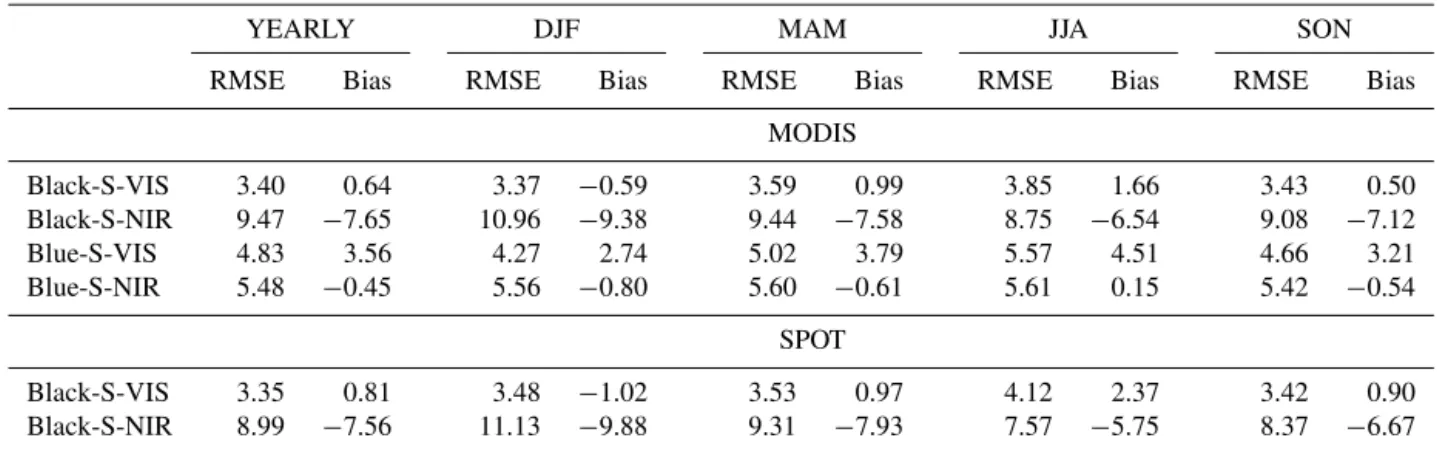
Table 4.Same as in Table 3 but for the PSALB experiment.
YEARLY DJF MAM JJA SON
RMSE Bias RMSE Bias RMSE Bias RMSE Bias RMSE Bias
MODIS
Black-S-VIS 3.40 0.64 3.37 −0.59 3.59 0.99 3.85 1.66 3.43 0.50
Black-S-NIR 9.47 −7.65 10.96 −9.38 9.44 −7.58 8.75 −6.54 9.08 −7.12
Blue-S-VIS 4.83 3.56 4.27 2.74 5.02 3.79 5.57 4.51 4.66 3.21
Blue-S-NIR 5.48 −0.45 5.56 −0.80 5.60 −0.61 5.61 0.15 5.42 −0.54
SPOT
Black-S-VIS 3.35 0.81 3.48 −1.02 3.53 0.97 4.12 2.37 3.42 0.90
Black-S-NIR 8.99 −7.56 11.13 −9.88 9.31 −7.93 7.57 −5.75 8.37 −6.67
Figure 7.Monthly time series of difference between PSALB and MODIS (PSALB-MODIS) spatially averaged over the northern and central boxes shown in the black-sky NIR yearly panel in Fig. 6.
that the SPOT albedo tends to vary more smoothly than the MODIS albedo due to the SPOT product being derived over a longer averaging window, whereas the MODIS data is pro-cessed over shorter time blocks. Since there is no equivalent post-processed blue-sky SPOT albedo product comparable to the MODIS blue-sky product, we only used the SPOT VIS and NIR black-sky product for comparison with the CABLE-simulated direct-beam VIS and NIR albedo at local solar noon. A comparison between MODIS and SPOT VIS and NIR black-sky albedo is shown in Fig. 4. The main differ-ence between the two products is that the MODIS product has a slightly higher NIR albedo during JJA (winter) over central and southwest Australia and a slightly lower albedo over the forests of eastern Australia and the northern savan-nah during summer (DJF) and autumn (MAM).
Table 5.Saturated- and dry-soil albedos for 20-class soil colours (Fig. 11) in the VIS and NIR wavebands.
Soil αsat αdry
colour VIS NIR VIS NIR
1 0.25 0.50 0.36 0.61
2 0.23 0.46 0.34 0.57
3 0.21 0.42 0.32 0.53
4 0.20 0.40 0.31 0.51
5 0.19 0.38 0.30 0.49
6 0.18 0.36 0.29 0.48
7 0.17 0.34 0.28 0.45
8 0.16 0.32 0.27 0.43
9 0.15 0.30 0.26 0.41
10 0.14 0.28 0.25 0.39
11 0.13 0.26 0.24 0.37
12 0.12 0.24 0.23 0.35
13 0.11 0.22 0.22 0.33
14 0.10 0.20 0.20 0.31
15 0.09 0.18 0.18 0.29
16 0.08 0.16 0.16 0.27
17 0.07 0.14 0.14 0.25
18 0.06 0.12 0.12 0.24
19 0.05 0.10 0.10 0.21
20 0.04 0.08 0.08 0.16
2.5 AMSR–E soil moisture
Figure 8.Yearly and seasonal soil moisture from AMSR–E and the PSALB experiment, and the difference between PSALB and AMSR–E (PSALB-AMSR_E).
In summary, the CNTL simulation uses prescribed soil albedo and the PSALB experiment parameterises soil albedo based on Eq. (1). Both simulations are compared to MODIS and SPOT albedo estimates, and we use AMSR–E soil mois-ture as means of quantifying the uncertainties in CABLE soil moisture. An initial analysis of the differences between CA-BLE on the one hand and MODIS and SPOT albedos on the other showed that most of the differences greater than±0.05 were statistically significant at 95 %. Hence, we simply show the absolute differences. In this context, deviations of more than 0.1–0.2 from remotely sensed estimates are considered to be large enough to warrant further improvements to the model.
3 Results
Figures 5 and 6 show the yearly and seasonal differences between CABLE MODIS blue-sky and black-sky NIR and VIS albedo and SPOT black-sky VIS and NIR albedo for the CNTL and PSALB experiments (designated CNTL-MODIS and PSALB-MODIS respectively). Biases and root mean square errors (RMSEs) are shown in Tables 3 and 4 respec-tively, with RMSE and bias values scaled by 100 such that small differences are easier to see. The CNTL experiment (with prescribed soil albedo) shows that CABLE simulates albedo well (Fig. 5) when compared to both MODIS and SPOT albedos. The model has a systematic underestimation of the black-sky NIR albedo, especially during DJF (sum-mer) of around 0.1 and an overestimation of between 0.05 and 0.1 of the blue-sky VIS albedo for all seasons. This over-estimation of blue-sky VIS albedo applies to most of the in-terior continent which has low LAI (Fig. 3). This suggests that part of this bias may be inherited from the prescribed soil albedo used (Fig. 2b). However, the bias is also present in the
Figure 9.Zero-lag correlation between the differences in monthly mean soil moisture between CABLE and AMSR_E (CA-BLE−AMSR_E):(a)CABLE and MODIS black-sky NIR albedo (CABLE - MODIS) and (b) CABLE and SPOT black-sky NIR albedo (CABLE-SPOT). Correlations are computed at 95 % signif-icance level over a monthly time series from 2003 to 2008, which corresponds to the availability of AMSR_E soil moisture.
northern tropical areas which have an LAI of 2.0, where veg-etation should have a larger influence. The northern tropical regions are also the areas where the MODIS albedo used for evaluation had higher percentages of temporally fitted data, which might also contribute to these biases. We also note that there is a consistent difference of 0.05 to 0.1 for the blue-sky NIR albedo in densely vegetated areas of Tasmania and the northern tropics. This has been documented elsewhere for other LSMs which use a similar two-stream radiation trans-fer scheme as is used in CABLE. For example, Pinty et al. (2011) report that the lowering of the NIR leaf scattering co-efficient below its true value was required to correct the ab-sorption due to multiple scattering within a structurally het-erogeneous canopy.
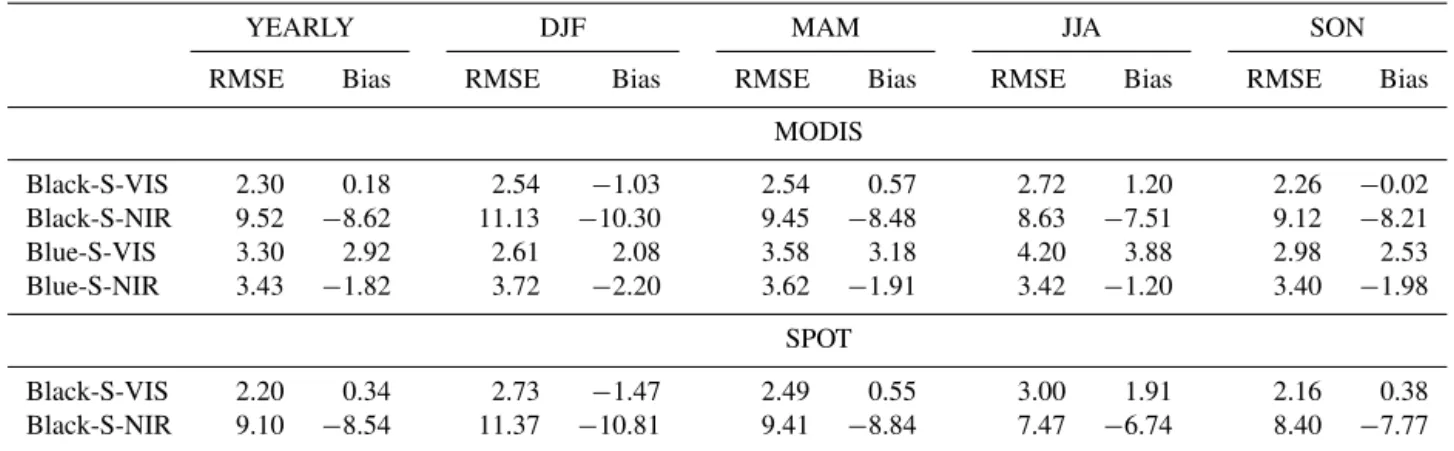
Table 6.Same as in Table 3 but for the PSALB_20 experiment.
YEARLY DJF MAM JJA SON
RMSE Bias RMSE Bias RMSE Bias RMSE Bias RMSE Bias
MODIS
Black-S-VIS 2.66 −0.15 2.98 −1.40 2.87 0.23 2.95 0.91 2.67 −0.36
Black-S-NIR 10.36 −9.34 11.94 −11.07 10.31 −9.21 9.42 −8.15 9.99 −8.93
Blue-S-VIS 3.32 2.42 2.79 1.54 3.57 2.67 4.11 3.42 3.10 2.04
Blue-S-NIR 4.74 −2.91 5.2 −3.35 4.93 −3.02 4.42 −2.23 4.77 −3.05
SPOT
Black-S-VIS 2.57 0.0 3.2 −1.85 2.85 0.19 3.16 1.61 2.54 0.03
Black-S-NIR 9.94 −9.28 12.19 −11.61 10.27 −9.60 8.28 −7.39 9.28 −8.51
YEARLY DJF MAM JJA SON
RMSE Bias RMSE Bias RMSE Bias RMSE Bias RMSE Bias
MODIS
Black-S-VIS 2.30 0.18 2.54 −1.03 2.54 0.57 2.72 1.20 2.26 −0.02
Black-S-NIR 9.52 −8.62 11.13 −10.30 9.45 −8.48 8.63 −7.51 9.12 −8.21
Blue-S-VIS 3.30 2.92 2.61 2.08 3.58 3.18 4.20 3.88 2.98 2.53
Blue-S-NIR 3.43 −1.82 3.72 −2.20 3.62 −1.91 3.42 −1.20 3.40 −1.98
SPOT
Black-S-VIS 2.20 0.34 2.73 −1.47 2.49 0.55 3.00 1.91 2.16 0.38
Black-S-NIR 9.10 −8.54 11.37 −10.81 9.41 −8.84 7.47 −6.74 8.40 −7.77
CNTL experiment for the black- and blue-sky VIS albedos but large differences of up to−0.25 for the black- and blue-sky NIR albedos. These large differences were confined to central Australia (shown by the black box in the black-sky NIR yearly panel), which is the most arid part of the conti-nent. The larger differences for the NIR as compared to the VIS albedos were to be expected as NIR albedo is gener-ally larger in magnitude than VIS albedo. The fact that these differences are confined to inland arid regions suggests that the mechanisms leading to high albedo values in desert re-gions are not being adequately represented. Similar to CNTL, the PSALB experiment also showed larger differences during DJF (summer) as compared to the other seasons, noticeably in the northern tropical regions (also shown by a black box in the black-sky NIR yearly panel). A monthly time series of the differences between PSALB and MODIS over the cen-tral and northern areas (Fig. 7) shows that PSALB consis-tently underpredicts the black-sky NIR albedo during sum-mer in the north (the monsoon season), whereas the differ-ences in the central arid region show little monthly variation. The CNTL experiment showed similar consistent underes-timation of black-sky NIR albedo for the northern tropical region, suggesting that these differences are related to the pa-rameterisation of vegetation rather than soil albedo.
The soil albedo scheme implemented depends on soil colour, which is prescribed (Fig. 2c), and soil moisture. To examine the uncertainties in the simulated soil moisture, we compared yearly and seasonal means of soil moisture from the PSALB experiment against AMSR–E satellite-estimated surface soil moisture. CABLE’s surface soil moisture is rep-resentative of the first 2.2 cm of the soil, and details of the nu-merical scheme used to solve the one-dimensional Richard’s equation can be found in Kowalczyk et al. (2006). While comparing an LSM soil moisture to a satellite-derived prod-uct is not strictly comparing like to like, our goal here is to identify whether there are any spatial similarities in the differences between CABLE albedo and soil moisture from satellite-derived alternatives rather than to examine the abso-lute soil moisture values. CABLE’s soil moisture is generally
Figure 11. Twenty-class soil colour maps used for the (a) PSALB_20 and(b)PSALB_20C simulations. The corresponding saturated and dry VIS and NIR albedos for each soil colour are shown in Table 5.
higher compared to AMSR–E for most of the continent (Fig. 8), especially during DJF and SON. Higher soil mois-ture should result in lower simulated soil albedo and hence larger differences when compared to MODIS. Hence, this could partly explain the large deviations in the NIR albedo.
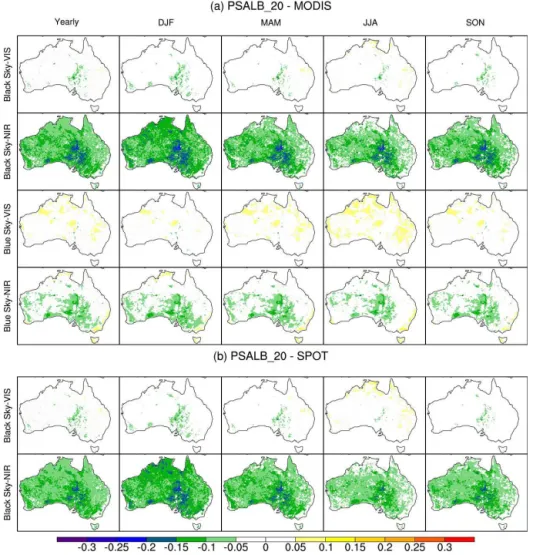
Figure 12.Same as in Fig. 6 but for the PSALB_20 experiment.
least part of the large differences in the black-sky NIR albedo over the centre of the continent can be attributed to CABLE overestimating soil moisture.
Figure 10 shows the difference in overall albedo and sur-face fluxes between the PSALB and CNTL experiments (PSALB-CNTL). The lower albedo values in central Aus-tralia for the PSALB experiment result in an increase in net radiation of up to 45–50 W m−2, most of which results in
in-creased sensible heat because the continental interior is gen-erally dry. The only noticeable change in latent heat is during the summer monsoon season (DJF) over the northern tropi-cal regions, when high precipitation leads to higher available soil water. Also illustrated in Fig. 10 is a diagnostic screen temperature showing the lower albedo and higher net radia-tion and sensible heat for the PSALB experiment leading to a temperature which is higher by up to 0.5◦C.
Such large deviations from MODIS albedo with this sim-ple parameterisation have also been noted with the CLM LSM. To reduce these deviations, Lawrence and Chase (2007) extended the eight-soil colour class to 20 colours to include a higher range of VIS and NIR albedos than observed
from MODIS. They also generated a new MODIS-consistent soil colour map by fitting VIS and NIR soil albedos which reproduced the MODIS monthly values at local solar noon as closely as possible, given a model climatological monthly mean soil moisture. Hence, we implemented the 20-class soil colour map used by Lawrence and Chase (2007) and under-took a similar recalibration using CABLE’s soil moisture. The CLM and CABLE calibrated soil colour maps are shown in Fig. 11a and b respectively, and the corresponding satu-rated and dry VIS and NIR albedos are shown in Table 5. The new soil colour maps clearly better reflect the spatial distri-bution of MODIS soil albedo than the default eight-class map (Fig. 2).
Figure 13.Same as in Fig. 10 but for the PSALB_20 experiment.
albedo, which is related to MODIS having a slightly higher NIR albedo than SPOT (Fig. 4). The overestimation of the blue-sky VIS albedo is also reduced. However, we note that although the differences in black-sky NIR albedo at the cen-tre of the continent are reduced, differences in the black-sky NIR albedo increase by 0.05 to 0.1 to the west and north of the continent when compared to the PSALB experiment (Fig. 6). Hence, the domain-averaged statistics shown in Ta-ble 6 do not show a marked improvement when compared to the PSALB experiment (Table 4). The differences in overall broadband albedo (combined VIS and NIR, direct and dif-fuse albedo, averaged at all model times), heat fluxes, and diagnostic screen temperature between the PSALB_20 and CNTL experiment are shown in Fig. 13. The differences at the centre of the continent are not as large as compared to the PSALB experiment (Fig. 10), but overall albedo is generally underestimated as compared to the CNTL.
Figure 14.Same as in Fig. 12 but for the PSALB_20C experiment.
overall albedo, heat fluxes, and diagnostic screen temperature as compared to the CNTL are shown in Fig. 15. These differ-ences are now small enough to enable us to use the scheme to explore soil-moisture–albedo feedbacks within CABLE.
4 Discussion
CABLE traditionally prescribes background soil albedo and hence does not allow for soil-moisture–albedo feedbacks, which the literature suggests can be important. To address this issue, we implemented a simple soil albedo scheme, based on soil moisture and colour, which has been used in other LSMs. Two simulations were conducted: the con-trol (CNTL) experiment, with prescribed soil albedo de-rived from MODIS, and another with parameterised soil albedo (PSALB). The CNTL simulation showed relatively small differences in albedo when compared to MODIS and SPOT albedos, whereas the PSALB experiment showed much larger differences, especially in the VIS albedo. The differences were up to−0.25 and mainly in central Australia. The better performance of the CNTL compared to PSALB is
not surprising as the CNTL experiment uses a background soil albedo which is itself derived from earlier versions of MODIS albedo (Houldcroft et al., 2009). The equally small differences when compared to an alternative remotely sensed albedo product, SPOT, give us confidence that the small dif-ferences are not simply due to CNTL soil albedo and the benchmarking data set being from the same source.
Figure 15.Same as in Fig. 13 but for the PSALB_20C experiment.
Given the large differences in albedo between MODIS and LSMs, Lawrence and Chase (2007) developed MODIS-consistent land surface parameters, including the mapping of PFTs, LAI, and soil colour for use within the CLM3 LSM. They demonstrated that the use of the modified-parameter maps improved surface albedo simulations when compared with MODIS albedo. In some instances, this resulted in im-proved simulations of precipitation and near-surface temper-ature. We therefore carried out a similar procedure and tested the modified CLM-calibrated soil colour map of Lawrence and Chase (2007). We also carried out a similar calibra-tion using CABLE climatological soil moisture. The use of these maps resulted in a reduction in the difference in the NIR albedo in central Australia as compared to MODIS and SPOT estimates, with the CABLE-calibrated map resulting in smaller differences as compared to the CLM-calibrated map. Comparisons with the CNTL overall albedo and heat
fluxes showed differences which were small enough to war-rant use of the new scheme in CABLE to further explore soil-moisture–albedo feedbacks.
with regard to the universal application of the scheme ir-respective of LSMs, as the latter vary considerably in their treatment of soil moisture (Koster et al., 2009) as well as the processes which influence soil moisture (Koster and Milly, 1997). Whilst we recalibrated the soil colour maps, we have not recalibrated the coefficients used in Eq. (1), as this for-mulation was designed such that the soil albedos range in a nonlinear manner between their saturated and dry values (Dickinson et al., 1993). Rather than altering the formulation, we choose to recalibrate the soil colour maps. Additionally, it is assumed that the ratio of the NIR to VIS albedo is exactly a factor of 2. However, Wang et al. (2005) have shown that this ratio from MODIS data over the arid part of central Aus-tralia is 2.69. We could make use of a higher factor and this would help over Australia, but it would also lead to larger differences elsewhere in global simulations.
One cause of the large differences between LSM-simulated and observed albedo in arid regions is the depen-dence of soil albedo on solar zenith angle (Wang et al., 2005; Yang et al., 2008) and the lack of an explicit physical rep-resentation of this relationship in many LSMs. Wang et al. (2005) devised a semi-empirical scheme to relate bare-soil albedo at a single site in the Sahel to solar zenith angle and show improvements in albedo and surface flux simula-tions when the scheme was applied to the Noah land sur-face model. However, their simulations were on the site scale and over a very short time frame (less than 2 months) and may not be easily applicable to regional or global simula-tions over longer time frames. Liang et al. (2005) developed a “dynamic–statistical” parameterisation of snow-free albedo using MODIS albedo and soil moisture from a land data as-similation system over North America. While the dynami-cal part of the model represents the physidynami-cal dependencies of surface albedo on solar zenith angle and surface soil moisture etc., the statistical model provides parameter estimates spe-cific to geographic location. This scheme has been shown to significantly improve albedo simulations in CLM over North America, but a globally applicable scheme is yet to be tri-alled. Hence, we identify this an important future direction for albedo parameterisation development in CABLE.
5 Conclusions
Surface albedo is a key element of the surface energy bal-ance as it determines the amount of solar energy absorbed at the surface and redistributed into sensible and latent heat, which, in turn, drive the surface energy and water cycles. In this study, we investigated how well CABLEv1.4b simu-lates albedo compared with MODIS and SPOT estimates. We also tested a new simple parameterisation for the soil albedo, which is prescribed and held constant in time in the standard version of CABLE. This is an important step for the model as it enables the feedback between albedo and soil moisture to be represented. Our results show that CABLEv1.4b sim-ulates overall albedo reasonably well when the soil albedo is prescribed, as would be expected. The new parameterisa-tion for soil albedo, after calibraparameterisa-tion to produce a MODIS-consistent soil colour map, which is also tuned to CABLE soil moisture, resulted in satisfactory comparisons with both MODIS-derived albedo and an alternative, remotely sensed albedo product, SPOT. Hence, there is now added capacity and value within CABLE to further explore soil-moisture– albedo feedbacks.
Appendix A: Parameterisation of surface albedo in CABLEv1.4b
The overall albedo of the land surface for shortwave radiation (αs) is defined as
αs=0.5 X
j=1,2
(ρ(dir,j )fb+ρ(dif,j )(1−fb)), (A1)
wherefbis the fraction of direct-beam shortwave radiation
andρ(dir,j ) andρ(dif,j ) are the effective combined soil and
canopy reflectance for direct and diffuse radiation in the VIS (j =1) and NIR (j=2) spectral bands.
The effective combined canopy reflectances (ρ(dir,j ) and
ρ(dif,j )) in each band in Eq. (A1) are defined as
ρ(dir,j )=ρ(can_dir,j )
+(ρ(soil,j )−ρ(can_dir,j ))exp(−2k(∗dir,j )3), (A2)
ρ(dif,j )=ρ(can_dif,j )
+(ρ(soil,j )−ρ(can_dif,j ))exp(−2k(∗dif,j )3), (A3)
whereρ(can_dir,j ) andρ(can_dif,j ) are the canopy reflectance
for direct and diffuse radiation,ρ(soil,j )is the soil reflectance,
k∗
(dir,j ) andk
∗
(dif,j ) are the extinction coefficients for direct
and diffuse radiation, and3is the LAI.
The canopy direct and diffuse reflectance (ρ(can_dir,j )and
ρ(can_dif,j )) in each band in Eqs. (A2) and (A3) are defined
as
ρ(can_dir,j )=
2kdir
kdir+kdif
ρ(can_black,j ), (A4)
ρ(can_dif,j )=2 π
2
Z
0
ρ(can_dir,j )sin(θ )cos(θ )dθ, (A5)
where kdir and kdif are the extinction coefficients for a
canopy with black leaves for direct and diffuse radiation,
ρ(can_black,j )is the reflectance of a horizontally homogeneous
canopy with horizontal black leaves, andθis the solar zenith angle.
The extinction coefficients for a real canopy ( dirand dif) in Eqs. (A2) and (A3) and black canopy (kdir andkdif) in
Eqs. (A4) and (A5) are related as follows (Goudriaan and van Laar, 1994):
k∗(dir,j )=kdir(1−ωj) 1
2 , k∗
(dif,j )=kdif(1−ωj)
1
2, (A6)
whereωjis the scattering coefficient for each waveband and
is equal to the sum of the canopy reflectance and transmit-tance.
The extinction coefficients for a black canopy (kdir and
kdif) in Eqs. (A4) and (A5) are defined as
kdir(θ )=
G
cos(θ ), (A7)
kdif= −
1
3ln
3 Z
0
exp(−kdir(θ )λ)dλ
, (A8)
whereλis the cumulative canopy LAI from the canopy top andGis the ratio of the projected area of leaves in the direc-tion perpendicular to the direcdirec-tion of incident solar radiadirec-tion and the actual leaf area:
G=φ1+φ2cos(θ ), (A9)
φ1=0.5−χ (0.633+0.33χ ), (A10)
φ2=0.877(1−2φ1), (A11)
whereχ is an empirical parameter related to the leaf angle distribution applicable over the range [−0.4, 0.6].
Finally, the reflectance of a horizontally homogeneous canopy with horizontal black leaves (ρ(can_black,j )) in
Eq. (A4) is defined as
ρ(can_black,j )=
1−(1−ωj) 1 2
1+(1−ωj) 1 2
Acknowledgements. All the authors except David Mocko, Crystal B. Schaaf, and Qingsong Sun are supported by the Australian Research Council Centre of Excellence for Climate System Science (CE110001028). This work was also supported by the NSW Environment Trust (RM08603). We thank CSIRO and the Bureau of Meteorology through the Center for Australian Weather and Climate Research for their support in the use of the CABLE model. We thank the National Computational Infrastructure at the Australian National University, an initiative of the Australian Government, for access to supercomputer resources. We thank the NASA GSFC LIS team for support in coupling CABLE to LIS. The MODIS-derived background soil albedo was provided by Peter R. J. North from the Department of Geography, Swansea University, Swansea, United Kingdom. The modified MODIS LAI data was provided by Hua Yuan from the Land-Atmosphere Interaction Research Group at Beijing Normal University. The AMSR–E soil moisture data was provided by Yi Liu from the University of New South Wales. The SPOT albedo product was obtained from: http://www.geoland2.eu/index.jsp, and we formally acknowledge the use of the SPOT albedo as per the data policy: “The research leading to these results has received funding from the European Community’s Seventh Framework Program (PF7/2007–2013) under grant agreement no. 218795. The BioPar SPOT/VEGETATION albedo products were originally defined in the framework of the PF5/CYCLOPES project. They are a joint property of CNES and VITO under copyright geoland2. They have been generated from the SPOT VEGETATION data under copyright CNES and distributed by VITO”. All of this assistance is gratefully acknowledged.
Edited by: R. Marsh
References
Abramowitz, G., Leuning, R., Clark, M., and Pitman, A.: Evaluating the Performance of Land Surface Models, J. Climate, 21, 5468– 5481, 2008.
Avila, F. B., Pitman, A. J., Donat, M. G., Alexander, L. V., and Abramowitz, G.: Climate model simulated changes in temper-ature extremes due to land cover change, J. Geophys. Res., 117, D04108, doi:10.1029/2011JD016382, 2012.
Bonan, G.: Ecological climatology, Cambridge University Press, 2nd Edn., 2008.
Cruz, F. T., Pitman, A. J., and Wang, Y.-P.: Can the stomatal re-sponse to higher atmospheric carbon dioxide explain the unusual temperatures during the 2002 Murray-Darling Basin drought?, J. Geophys. Res., 115, D02101, doi:10.1029/2009JD012767, 2010. Davidson, A. and Wang, S.: The effects of sampling resolution on the surface albedos of dominant land cover types in the North American boreal region, Remote Sens. Environ., 93, 211–224, 2004.
Decker, M., Pitman, A. J., and Evans, J. P.: Groundwater Con-straints on Simulated Transpiration Variability over South-eastern Australian Forests, J. Hydrometeorol., 14, 543–559, doi:10.1175/JHM-D-12-058.1, 2013.
Dickinson, R. E.: Land surface processes and climate-surface albe-dos and energy balance, Adv. Geophys., 25, 305–353, 1983. Dickinson, R. E., Henderson-Sellers, A., and Kennedy, P. J.:
Biosphere-Atmosphere Transfer Scheme (BATS) Version 1e as
coupled to the NCAR Community Model, NCAR Tech. Note, NCAR/TN-387+STR, 72 pp., Natl. Cent. Atmos. Res., Boulder, Colo., 1993.
Dickinson, R. E., Shaikh, M., Bryant, R., and Graumlich, L.: Inter-active Canopies for a Climate Model, J. Climate, 11, 2823–2836, 1998.
Disney, M., Lewis, P., Thackrah, G., Quaife, T., and Barnsley, M.: Comparison of MODIS broadband albedo over an agricultural site with ground measurements and values derived from Earth observation data at a range of spatial scales, Int. J. Remote Sens., 25, 5297–5317, 2004.
Exbrayat, J.-F., Pitman, A. J. J., Abramowitz, G., and Wang, Y.-P.: Sensitivity of net ecosystem exchange and heterotrophic res-piration to parameterization uncertainty, J. Geophys. Res., 118, 1640–1651, doi:10.1029/2012JD018122, 2013.
Goudriaan, J. and van Laar, H. H.: Modelling crop growth pro-cesses, Kluwer, Amsterdam, the Netherlands, 1994.
Hirsch, A. L., Kala, J., Pitman, A. J., Carouge, C., Evans, J. P., Haverd, V., and Mocko, D.: Impact of Land Surface Initialization Approach on Subseasonal Forecast Skill: A Regional Analysis in the Southern Hemisphere, J. Hydrometeorol., 15, 300–319, 2014. Houldcroft, C. J., Grey, W. M. F., Barnsley, M., Taylor, C. M., Los, S. O., and North, P. R. J.: New Vegetation Albedo Parameters and Global Fields of Soil Background Albedo Derived from MODIS for Use in a Climate Model, J. Hydrometeorol., 10, 183–198, 2009.
Idso, S. B., Jackson, R. D., Reginato, R. J., Kimball, B. A., and Nakayama, F. S.: The Dependence of Bare Soil Albedo on Soil Water Content, J. Appl. Meteorol., 14, 109–113, 1975.
Jones, D., Wang, W., and Fawcett, R.: High-quality spatial climate data-sets for Australia, Aust. Meteorol. Mag., 58, 233–248, 2009. Kala, J., Decker, M., Exbrayat, J.-F., Pitman, A. J., Carouge, C., Evans, J. P., Abramowitz, G., and Mocko, D.: Influence of Leaf Area Index Prescriptions on Simulations of Heat, Moisture, and Carbon Fluxes, J. Hydrometeorol., 15, 489–503, 2014.
Keeling, C. D., Piper, S. C., Bacastow, R. B., Wahlen, M., Whorf, T. P., Heimann, M., and Meijer, H. A.: Atmospheric CO2 and
13CO
2exchange with the terrestrial biosphere and oceans from
1978 to 2000: observations and carbon cycle implications, pages 83–113, in: A History of Atmospheric CO2 and its effects on
Plants, Animals, and Ecosystems, edited by: Ehleringer, J. R., Cerling, T. E., Dearing, M. D., Springer Verlag, New York, 2005. Koster, R. D. and Milly, P. C. D.: The Interplay between Transpi-ration and Runoff Formulations in Land Surface Schemes Used with Atmospheric Models, J. Climate, 10, 1578–1591, 1997. Koster, R. D., Guo, Z., Dirmeyer, P. A., Bonan, G., Chan, E.,
Cox, P., Davies, H., Gordon, C. T., Kanae, S., Kowalczyk, E., Lawrence, D., Liu, P., Lu, C.-H., Malyshev, S., McAveney, B., Mitchell, K., Mocko, D., Oki, T., Oleson, K. W., Pitman, A., Sud, Y. C., Taylor, C. M., Verseghy, D., Vasic, R., Xue, Y., and Ya-mada, T.: Regions of strong coupling between soil moisture and precipitation, Science, 305, 1138–1140, 2004.
Koster, R. D., Guo, Z., Yang, R., Dirmeyer, P. A., Mitchell, K., and Puma, M. J.: On the Nature of Soil Moisture in Land Surface Models, J. Climate, 22, 4322–4335, 2009.
Re-013, November 2006, 37 pp., available at: www.cmar.csiro.au/ e-print/open/kowalczykea_2006a.pdf, 2006.
Kumar, S., Peters-Lidard, C., Tian, Y., Houser, P., Geiger, J., Olden, S., Lighty, L., Eastman, J., Doty, B., Dirmeyer, P., Adams, J., Mitchell, K., Wood, E., and Sheffield, J.: Land information sys-tem: An interoperable framework for high resolution land surface modeling, Environ. Model. Softw., 21, 1402–1415, 2006. Kumar, S. V., Peters-Lidard, C. D., Eastman, J. L., and Tao,
W.-K.: An integrated high-resolution hydrometeorological modeling testbed using LIS and WRF, Environ. Model. Softw., 23, 169– 181, 2008.
Lacaze, R., Makhmara, H., and Smets, B.: Towards an Operational GMES Land Monitoring Core Service BioPar Product User Manual SPOT/VEGETATION V1 (BP-05), Tech. Rep. BP-RP-BP053, l1.22, available at: http://web.vgt.vito.be/documents/ BioPar/g2-BP-RP-BP053-ProductUserManual-ALBV1.pdf (last access: 18 April 2013), 2012.
Lawrence, P. J. and Chase, T. N.: Representing a new MODIS consistent land surface in the Community Land Model (CLM 3.0), J. Geophys. Res.-Biogeo., 112, G01023, doi:10.1029/2006JG000168, 2007.
Liang, X.-Z., Xu, M., Gao, W., Kunkel, K., Slusser, J., Dai, Y., Min, Q., Houser, P. R., Rodell, M., Schaaf, C. B., and Gao, F.: Development of land surface albedo parameteriza-tion based on Moderate Resoluparameteriza-tion Imaging Spectroradiome-ter (MODIS) data, J. Geophys. Res.-Atmos., 110, D11107, doi:10.1029/2004JD005579, 2005.
Liu, Y. Y., van Dijk, A. I. J. M., de Jeu, R. A. M., and Holmes, T. R. H.: An analysis of spatiotemporal variations of soil and vegetation moisture from a 29-year satellite-derived data set over mainland Australia, Water Resour. Res., 45, W07405, doi:10.1029/2008WR007187, 2009.
Lorenz, R., Pitman, A. J., Donat, M. G., Hirsch, A. L., Kala, J., Kowalczyk, E. A., Law, R. M., and Srbinovsky, J.: Represen-tation of climate extreme indices in the ACCESS1.3b coupled atmosphere-land surface model, Geosci. Model Dev., 7, 545– 567, doi:10.5194/gmd-7-545-2014, 2014.
Lucht, W., Schaaf, C., and Strahler, A.: An algorithm for the re-trieval of albedo from space using semi-empirical BRDF models, IEEE T. Geosci. Remote, 38, 977–998, 2000.
Mao, J., Phipps, S. J., Pitman, A. J., Wang, Y. P., Abramowitz, G., and Pak, B.: The CSIRO Mk3L climate system model v1.0 coupled to the CABLE land surface scheme v1.4b: evaluation of the control climatology, Geosci. Model Dev., 4, 1115–1131, doi:10.5194/gmd-4-1115-2011, 2011.
Meng, X., Evans, J., and McCabe, M.: The influence of inter-annually varying albedo on regional climate and drought, Clim. Dynam., 42, 787–803, doi:10.1007/s00382-013-1790-0, 2013. Oleson, K. W., Bonan, G. B., Schaaf, C., Gao, F., Jin, Y., and
Strahler, A.: Assessment of global climate model land sur-face albedo using MODIS data, Geophys. Res. Lett., 30, 1443, doi:10.1029/2002GL016749, 2003.
Pinty, B., Andredakis, I., Clerici, M., Kaminski, T., Taberner, M., Verstraete, M. M., Gobron, N., Plummer, S., and Widlowski, J.-L.: Exploiting the MODIS albedos with the Two-stream In-version Package (JRC-TIP): 1. Effective leaf area index, vegeta-tion, and soil properties, J. Geophys. Res.-Atmos., 116, D09105, doi:10.1029/2010JD015372, 2011.
S. J., and de Noblet-Ducoudré, N.: Importance of background climate in determining impact of land-cover change on regional climate, Nature Climate Change, 9, 472–475, 2011.
Raupach, M. R.: Simplified expressions for vegetation roughness length and zero-plane displacement as functions of canopy height and area index, Bound.-Lay. Meteorol., 71, 211–216, 1994. Rienecker, M. M., Suarez, M. J., Gelaro, R., Todling, R.,
Bacmeis-ter, J., Liu, E., Bosilovich, M. G., Schubert, S. D., Takacs, L., Kim, G.-K., Bloom, S., Chen, J., Collins, D., Conaty, A., da Silva, A., Gu, W., Joiner, J., Koster, R. D., Lucchesi, R., Molod, A., Owens, T., Pawson, S., Pegion, P., Redder, C. R., Re-ichle, R., Robertson, F. R., Ruddick, A. G., Sienkiewicz, M., and Woollen, J.: MERRA: NASA’s Modern-Era Retrospective Anal-ysis for Research and Applications, J. Climate, 24, 3624–3648, 2011.
Schaaf, C. B., Gao, F., Strahler, A. H., Lucht, W., Li, X., Tsang, T., Strugnell, N. C., Zhang, X., Jin, Y., Muller, J.-P., Lewis, P., Barnsley, M., Hobson, P., Disney, M., Roberts, G., Dunderdale, M., Doll, C., d’Entremont, R. P., Hu, B., Liang, S., Privette, J. L., and Roy, D.: First operational BRDF, albedo nadir reflectance products from MODIS, Remote Sens. Environ., 83, 135–148, 2002.
Spitters, C.: Separating the diffuse and direct component of global radiation and its implications for modeling canopy photosynthe-sis Part II. Calculation of canopy photosynthephotosynthe-sis, Agr. Forest Me-teorol., 38, 231–242, 1986.
Tsvetsinskaya, E. A., Schaaf, C. B., Gao, F., Strahler, A. H., Dick-inson, R. E., Zeng, X., and Lucht, W.: Relating MODIS-derived surface albedo to soils and rock types over Northern Africa and the Arabian peninsula, Geophys. Res. Lett., 29, 67.1–67.4, 2002. Vamborg, F. S. E., Brovkin, V., and Claussen, M.: The effect of a dynamic background albedo scheme on Sahel/Sahara pre-cipitation during the mid-Holocene, Clim. Past, 7, 117–131, doi:10.5194/cp-7-117-2011, 2011.
Wang, Y.-P. and Leuning, R.: A two-leaf model for canopy con-ductance, photosynthesis and partitioning of available energy I: Model description and comparison with a multi-layered model, Agr. Forest Meteorol., 91, 89–111, 1998.
Wang, Y. P., Kowalczyk, E., Leuning, R., Abramowitz, G., Rau-pach, M. R., Pak, B., van Gorsel, E., and Luhar, A.: Di-agnosing errors in a land surface model (CABLE) in the time and frequency domains, J. Geophys. Res., 116, G01034, doi:10.1029/2010JG001385, 2011.
Wang, Y. P., Lu, X. J., Wright, I. J., Dai, Y. J., Rayner, P. J., and Reich, P. B.: Correlations among leaf traits provide a significant constraint on the estimate of global gross primary production, Geophys. Res. Lett., 39, L19405, doi:10.1029/2012GL053461, 2012.
Wang, Z., Zeng, X., Barlage, M., Dickinson, R. E., Gao, F., and Schaaf, C. B.: Using MODIS BRDF and Albedo Data to Evaluate Global Model Land Surface Albedo, J. Hydrometeorol., 5, 3–14, 2004.
over grassland, agriculture and forest surface types during dor-mant and snow-covered periods, Remote Sens. Environ., 140, 60–77, 2014.
Wei, X., Hahmann, A. N., Dickinson, R. E., Yang, Z.-L., Zeng, X., Schaudt, K. J., Schaaf, C. B., and Strugnell, N.: Compar-ison of albedos computed by land surface models and evalua-tion against remotely sensed data, J. Geophys. Res.-Atmos., 106, 20687–20702, 2001.
Yang, F., Mitchell, K., Hou, Y.-T., Dai, Y., Zeng, X., Wang, Z., and Liang, X.-Z.: Dependence of Land Surface Albedo on So-lar Zenith Angle: Observations and Model Parameterization, J. Appl. Meteorol. Clim., 47, 2963–2982, 2008.
Yuan, H., Dai, Y., Xiao, Z., Ji, D., and Shangguan, W.: Reprocessing the MODIS Leaf Area Index products for land surface and cli-mate modelling, Remote Sens. Environ., 115, 1171–1187, 2011.
Zaitchik, B. F., Santanello, J. A., Kumar, S. V., and Peters-Lidard, C. D.: Representation of soil moisture feedbacks during drought in NASA Unified WRF (NU-WRF), J. Hydrometeorol., 14, 360– 367, doi:10.1175/JHM-D-12-069.1, 2013.
Zhang, Q., Wang, Y. P., Pitman, A. J., and Dai, Y. J.: Limi-tations of nitrogen and phosphorous on the terrestrial carbon uptake in the 20th century, Geophys. Res. Lett., 38, L22701, doi:10.1029/2011GL049244, 2011.