HESSD
8, 8639–8670, 2011Shallow groundwater effect on land surface
temperature
F. Alkhaier et al.
Title Page
Abstract Introduction
Conclusions References
Tables Figures
◭ ◮
◭ ◮
Back Close
Full Screen / Esc
Printer-friendly Version
Interactive Discussion
Discussion
P
a
per
|
Dis
cussion
P
a
per
|
Discussion
P
a
per
|
Discussio
n
P
a
per
|
Hydrol. Earth Syst. Sci. Discuss., 8, 8639–8670, 2011 www.hydrol-earth-syst-sci-discuss.net/8/8639/2011/ doi:10.5194/hessd-8-8639-2011
© Author(s) 2011. CC Attribution 3.0 License.
Hydrology and Earth System Sciences Discussions
This discussion paper is/has been under review for the journal Hydrology and Earth System Sciences (HESS). Please refer to the corresponding final paper in HESS if available.
Shallow groundwater e
ff
ect on land
surface temperature and surface energy
balance under bare soil conditions:
modeling and description
F. Alkhaier1, G. N. Flerchinger2, and Z. Su1
1
Department of water resources, Faculty of Geo-Information Science and Earth Observation, University of Twente, Enschede, The Netherlands
2
Northwest Watershed Research Center, United States Department of Agriculture, Washington, DC, USA
Received: 7 September 2011 – Accepted: 14 September 2011 – Published: 23 September 2011
Correspondence to: F. Alkhaier ([email protected])
HESSD
8, 8639–8670, 2011Shallow groundwater effect on land surface
temperature
F. Alkhaier et al.
Title Page
Abstract Introduction
Conclusions References
Tables Figures
◭ ◮
◭ ◮
Back Close
Full Screen / Esc
Printer-friendly Version
Interactive Discussion
Discussion
P
a
per
|
Dis
cussion
P
a
per
|
Discussion
P
a
per
|
Discussio
n
P
a
per
|
Abstract
Appreciating when and how groundwater affects surface temperature and energy fluxes is important for utilizing remote sensing in groundwater studies and for integrating aquifers within land surface models. To explore the shallow groundwater effect, we numerically exposed two soil profiles – one having shallow groundwater – to the same 5
meteorological forcing, and inspected their different responses regarding surface soil moisture, temperature and energy balance. We found that the two profiles differed in the absorbed and emitted amounts of energy, in portioning out the available energy and in heat fluency within the soil. We conclude that shallow groundwater areas reflect less shortwave radiation due to their lower albedo and therefore they get higher mag-10
nitude of net radiation. When potential evaporation demand is high enough, a large portion of the energy received by these areas is spent on evaporation. This makes the latent heat flux predominant, and leaves less energy to heat the soil. Consequently, this induces lower magnitudes of both sensible and ground heat fluxes. The higher soil thermal conductivity in shallow groundwater areas facilitates heat transfer between 15
the top soil and the subsurface, i.e. soil subsurface is more thermally connected to the atmosphere. In view of remote sensors’ capability of detecting shallow groundwater effect, we conclude that this effect can be sufficiently clear to be sensed if at least one of two conditions is met: high potential evaporation and big contrast in air temperature between day and night. Under these conditions, most day and night hours are suitable 20
for shallow groundwater depth detection.
1 Introduction
Investigating the effect of shallow groundwater on land surface temperature and sur-face energy balance has two-fold benefits. Firstly, it provides solid ground for optimal utilization of thermal remote sensing in observing the areal extent of shallow ground-25
HESSD
8, 8639–8670, 2011Shallow groundwater effect on land surface
temperature
F. Alkhaier et al.
Title Page
Abstract Introduction
Conclusions References
Tables Figures
◭ ◮
◭ ◮
Back Close
Full Screen / Esc
Printer-friendly Version
Interactive Discussion
Discussion
P
a
per
|
Dis
cussion
P
a
per
|
Discussion
P
a
per
|
Discussio
n
P
a
per
|
the basis in which this effect can be included in climate research, weather forecast, and water management studies.
The effect of groundwater on soil temperature has been noted as early as the 1930’s, (van den Bouwhuysen, 1934). In one of the pioneering investigations, Kap-pelmeyer (1957) successfully used near surface soil temperatures (1.5 m depth) to lo-5
cate fissures carrying hot water. Since then, studies have been using soil temperature at shallow depths (0.5 to 2 m) to locate aquifers and delineate their flow systems.
Cartwright (1968) made use of temperature measurement at a depth of 0.5 m to find thermal anomalies caused by shallow aquifers located at a depth of about 5 m. He used a simple model to describe heat transport between soil-air interface and aquifer-10
overburden interface. Though his model was the earliest to describe this process, it included a major shortcoming: both land surface and groundwater had predefined standing temperatures (Dirichlet boundary condition). Obviously, this prevented any thermal interaction between the aquifer and the land surface.
Birman (1969) attributed the small amplitude of annual shallow-earth temperature 15
wave to the presence of shallow groundwater. A year later, Krcmar and Masin (1970) reported that the most important results of geothermic measurements had been the investigation for circulation of both cold and hot underground waters.
Studies of geothermal prospecting for groundwater were continued by
Cartwright (1971, 1974). Specifically Cartwright (1974) studied the use of soil 20
temperature measured at 1m depth to describe the flow of small, shallow groundwater systems. Afterwards, and along the same line, several studies (Takeuchi, 1980, 1981, 1996; Yuhara, 1998 cited in Furuya et al., 2006; Olmsted et al., 1986; Bense and Kooi, 2004; Alkhaier et al., 2009) used thermal prospecting to locate shallow aquifers and to delineate their flow systems.
25
HESSD
8, 8639–8670, 2011Shallow groundwater effect on land surface
temperature
F. Alkhaier et al.
Title Page
Abstract Introduction
Conclusions References
Tables Figures
◭ ◮
◭ ◮
Back Close
Full Screen / Esc
Printer-friendly Version
Interactive Discussion
Discussion
P
a
per
|
Dis
cussion
P
a
per
|
Discussion
P
a
per
|
Discussio
n
P
a
per
|
The majority of investigations that used remote sensing for detecting shallow ground-water effect on surface temperature was conducted between the late 60’s (Chase, 1969) and the early 80’s (Heilman and Moore, 1982). These studies were accompa-nied with relevant in-situ measurements and modeling efforts; Quiel (1975) measured the radiant temperature of gravel with varying depth of the groundwater table. He con-5
cluded that the influence of groundwater on surface temperature is insignificant if it is deeper than 0.2 m (diurnal damping depth of dry gravel). His conclusion is striking but understandable because gravel allows for a very small capillary rise; consequently, it does not affect the moisture state and the thermal properties of the section above water table. Furthermore, Quiel’s study considered only the penetration of the daily 10
temperature variation and totally neglected the yearly temperature oscillation.
The latter was also neglected in the numerical model built by Huntley (1978), who conducted an important theoretical and practical investigation for aquifer detection us-ing remote sensus-ing. The diurnal numerical model he developed was simple (numerical faculties were not as advanced as it is today), but it was the last and the most detailed 15
model that dealt with this phenomenon. His study concluded that it is impractical to estimate groundwater depth directly using thermal infrared imagery.
Actually, Huntley’s investigation underestimated the effect of groundwater on surface temperature mainly because of two reasons. Firstly, his study neither distinguished hot from cold groundwater nor separated very deep from shallow groundwater. For 20
that reason, the measured subsurface soil temperatures and the depths of groundwa-ter brought forth poor correlation. Secondly, his model was not sophisticated enough to simulate the inter-connection among energy balance components at land surface. Moreover, it did not consider the effect of groundwater on soil moisture and thus the thermal properties of the vadose zone.
25
HESSD
8, 8639–8670, 2011Shallow groundwater effect on land surface
temperature
F. Alkhaier et al.
Title Page
Abstract Introduction
Conclusions References
Tables Figures
◭ ◮
◭ ◮
Back Close
Full Screen / Esc
Printer-friendly Version
Interactive Discussion
Discussion
P
a
per
|
Dis
cussion
P
a
per
|
Discussion
P
a
per
|
Discussio
n
P
a
per
|
groundwater and land surface models using different schemes and techniques (Liang and Xie, 2003; Chen and Hu, 2004; Maxwell and Miller, 2005; Gulden et al., 2007; Fan et al., 2007; Niu et al., 2007; Jiang et al., 2009). Careful inspection of these works shows that their focal point was the mass aspect of the linkage between the surface and the subsurface domains via moisture flux. In this way, the main interest 5
was the influence of groundwater, as an extra source of water for evaporation, on water budget at land surface. Specifically, Niu et al. (2007) developed a simple groundwa-ter model (SIMGM) which considers unsaturated soil wagroundwa-ter and evaluated the model against the Gravity Recovery and Climate Experiment (GRACE) terrestrial water stor-age change data. Therefore, these studies did not provide a complete prospective of 10
shallow groundwater effect. The temporal patterns of that effect on surface temper-ature, net radiation, and surface heat fluxes (latent, sensible and ground heat fluxes) were not portrayed. More importantly, utilizing thermal remote sensing in these efforts or reversely, utilizing their findings in detecting shallow groundwater via thermal remote sensing was beyond the scope of these studies.
15
Prior to any real success in the application of remote sensing techniques in shal-low groundwater studies, and prior to solid integration of aquifers within coupled land surface models, it is essential to appreciate the basic physical principles involved in the process. In fact, the question whether shallow groundwater affects land surface temperature or not is still put forth. Furthermore, questions as: when and how this 20
effect takes place or whether it is possible to utilize currently operational satellites in its detection, have not been adequately answered until now.
In this paper we undertook the aforementioned questions by implementing numeri-cal simulations that take into consideration the majority of the aspects through which shallow groundwater affects land surface temperature and the various components of 25
HESSD
8, 8639–8670, 2011Shallow groundwater effect on land surface
temperature
F. Alkhaier et al.
Title Page
Abstract Introduction
Conclusions References
Tables Figures
◭ ◮
◭ ◮
Back Close
Full Screen / Esc
Printer-friendly Version
Interactive Discussion
Discussion
P
a
per
|
Dis
cussion
P
a
per
|
Discussion
P
a
per
|
Discussio
n
P
a
per
|
With respect to the numerical simulation implemented in this study, we exposed two soil profiles – one having shallow groundwater – to the same meteorological forcing. We then looked closely at the different responses of both profiles with regards to sur-face soil moisture, sursur-face soil temperature and sursur-face energy balance components. Hereinafter we sketch the general features of shallow groundwater effect. Afterwards 5
we describe the numerical modeling experiments that had been implemented for por-traying the expected pattern and magnitude of that effect.
2 Theory
Generally, groundwater is defined as water under positive pressure in the saturated zone of earth materials (Dingman, 2002). Within the context of this paper, “shallow” 10
groundwater means that water table is close enough to influence soil moisture at land surface. In such systems, water can move upward from the water table into the vadose zone, driven by surface tension forces. This results in a saturated to nearly satu-rated zone of negative pressure above the water table (i.e. capillary fringe or tension-saturated zone) which may range in height from about 10 mm for gravel, to 1.5 m for silt 15
and even to several meters for clay (Dingman, 2002).
The effect of shallow groundwater on soil moisture in the vadose zone may further extend above the capillary fringe to the land surface. This is not only due to surface-tension forces, but also due to its effect on the infiltration rate, as a result of air com-pression and counterflow in bounded soil columns (Grismer et al. 1994; Salvucci and 20
Entekhabi, 1995).
At land surface, energy fluxes interact instantaneously with each other in accordance with the prevailing meteorological conditions and the specific thermal and radiative characteristics of soil surface. The surface temperature represents the state variable that continuously adjusts to changes in hydraulic and meteorological forcing in such a 25
way that the energy balance is always being preserved:
HESSD
8, 8639–8670, 2011Shallow groundwater effect on land surface
temperature
F. Alkhaier et al.
Title Page
Abstract Introduction
Conclusions References
Tables Figures
◭ ◮
◭ ◮
Back Close
Full Screen / Esc
Printer-friendly Version
Interactive Discussion
Discussion
P
a
per
|
Dis
cussion
P
a
per
|
Discussion
P
a
per
|
Discussio
n
P
a
per
|
LE (Wm−2) is latent heat flux that is used for evaporation (in this study we consider bare soil conditions). H (Wm−2) is sensible heat flux which expresses the heat exchange between land surface and the air above it; G (Wm−2
) is ground heat flux, that is, the heat that enters the ground or migrates upward to the surface. Rn (Wm−
2
) is the net radiation, which is the outcome of the radiation irradiated by the sun (Kin) and the sky
5
(ε Lin) onto the land surface, minus the radiation which is reflected (α Kin) or emitted
by the land surface (ε σ Ts4), as:
Rn = (1 − α)Kin + ε Lin − εσ Ts4 (2)
where α, ε are land surface albedo and emissivity respectively, Ts is land surface temperature (K) andσ is Stefan-Boltzmann constant (5.6697×10⁻⁸). Soil albedo, α, 10
changes according to soil moisture,θl, as (Idso et al., 1975):
α = αd exp [−aαθl] (2a)
whereαdis dry soil albedo andaα is an empirical coefficient.
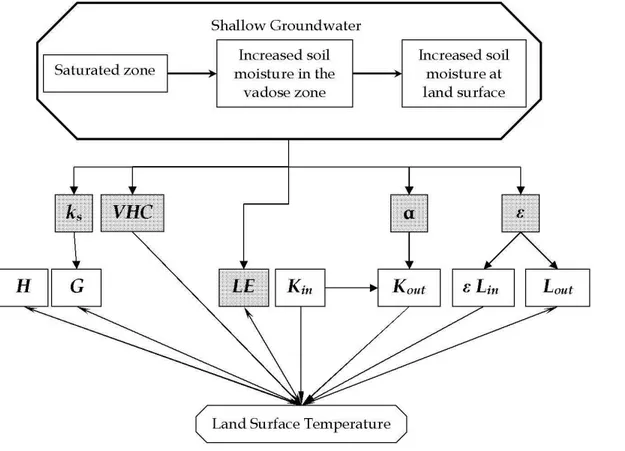
Figure 1 presents a sketch of how shallow groundwater affects the different com-ponents of the energy balance at land surface. The component that prospers most 15
when the soil moisture rises by shallow groundwater presence is latent heat flux (LE). Thus, more energy is spent for evaporation leaving less energy to heat the soil surface. Consequently, the cooler soil surface induces smaller thermal exchanges between the top surface soil and both the air above (sensible heat flux,H) and the subsurface soil beneath (ground heat flux,G).
20
Furthermore, the presence of shallow groundwater affects thermal properties of both saturated and unsaturated zones. Through its effect on thermal conductivity and vol-umetric heat capacity of the soil profile, groundwater alters the propagation of heat in the subsurface and thereby affects soil temperature and ground heat flux. Whereas the change in thermal conductivity affects the intensity of ground heat flux and both diurnal 25
HESSD
8, 8639–8670, 2011Shallow groundwater effect on land surface
temperature
F. Alkhaier et al.
Title Page
Abstract Introduction
Conclusions References
Tables Figures
◭ ◮
◭ ◮
Back Close
Full Screen / Esc
Printer-friendly Version
Interactive Discussion
Discussion
P
a
per
|
Dis
cussion
P
a
per
|
Discussion
P
a
per
|
Discussio
n
P
a
per
|
amount of heat that can be stored in soil layers. As a result, both amplitude and phase of diurnal and annual waves of ground heat flux and soil temperature are affected.
Net radiation, Rn, (Eq. 2) has three components that are likely to be influenced by
the wetness of land surface, namely; the reflected shortwave radiation (α Kin) and both
absorbed and emitted longwave radiation (ε σ Ts4). The first component (α Kin) is
5
controlled by albedo, while the last two are dependent on emissivity; both albedo and emissivity vary with soil moisture. Nevertheless, soil emissivity may have a minor effect since it is involved in two components of comparable magnitude acting in opposite directions, i.e.ε Lin andLout(Eq. 2).
3 Methodology 10
We used the Simultaneous Heat and Water model (SHAW) (Flerchinger, 2000) to sim-ulate water and heat transfer within soil and to produce the germane energy fluxes at land surface. We chose SHAW because it presents the heat and water transfer processes in detailed physics and has been successfully employed to simulate land surface energy balance over a broad range of conditions and applications (Flerchinger 15
and Cooley, 2000; Flerchinger et al., 2003, 2009; Flerchinger and Hardegree, 2003; Santanello and Friedl, 2003; Huang and Gallichand, 2006).
The simulation was implemented for two different soil profiles that were put under the same forcing meteorological conditions. Though the two profiles were alike in terms of soil composition and profile depth, they differed in one aspect which was the presence 20
of groundwater. One profile had water table perched at 2m from land surface (hereafter referred to as the “GWP”) whereas the other profile had no groundwater (hereafter designated to as the “NOGWP”).
To maintain simplicity, we adopted the following assumptions: (1) both heat and water transfers took place only in the vertical direction (2) the soil was homogeneous in both 25
HESSD
8, 8639–8670, 2011Shallow groundwater effect on land surface
temperature
F. Alkhaier et al.
Title Page
Abstract Introduction
Conclusions References
Tables Figures
◭ ◮
◭ ◮
Back Close
Full Screen / Esc
Printer-friendly Version
Interactive Discussion
Discussion
P
a
per
|
Dis
cussion
P
a
per
|
Discussion
P
a
per
|
Discussio
n
P
a
per
|
Hereinafter, we spotlight the most important expressions being adopted in SHAW to obtain surface heat fluxes. We also present how water and heat transfers within the soil profile are mathematically expressed in accordance with Flerchinger (2000). Afterwards, we describe the experimental design together with the input data (profile depth, soil and weather data, simulation duration and time step).
5
3.1 SHAW formulations
SHAW model simulates a vertical, one-dimensional profile which may extend from the top of possibly existing vegetation canopy, plant residue, snow, or soil surface down to a certain depth within the soil. This system is represented by detailed physics. We present hereinafter some of its fundamental equations that are relevant to our 10
specific simulation purpose. For further details the reader is referred to SHAW technical documentation (Flerchinger, 2000).
3.1.1 Surface heat fluxes
Sensible heat flux is related to temperature gradient between the soil surface and the atmosphere. Following Campbell (1977), we write:
15
H = −ρaca
(Ts − Ta)
rH (3)
whereρa,ca and Ta are air density (kg m− 3
), specific heat (J kg−1◦C−1
) and temper-ature (◦C) at the measurement reference height zref;Ts is the temperature (◦C) of soil
surface, and rH is the resistance to surface heat transfer (s m−1) corrected for atmo-spheric stability.
20
Latent heat flux is associated with water vapor transfer from soil surface to the atmo-sphere, as:
LE = L (ρvs − ρva) rv
HESSD
8, 8639–8670, 2011Shallow groundwater effect on land surface
temperature
F. Alkhaier et al.
Title Page
Abstract Introduction
Conclusions References
Tables Figures
◭ ◮
◭ ◮
Back Close
Full Screen / Esc
Printer-friendly Version
Interactive Discussion
Discussion
P
a
per
|
Dis
cussion
P
a
per
|
Discussion
P
a
per
|
Discussio
n
P
a
per
|
where L is the latent heat of vaporization (J kg−1), E is vapor flux (kg s−1m−2), ρvs
andρva are vapor density (kg m−3) of soil surface and air at the reference height. The resistance value for vapor transferrv (s m−
1
) is assumed to be equal to the resistance to surface heat transferrH.
The resistance to surface heat transfer,rH, is calculated from: 5
rH =
1 u∗k
ln
z
ref − d + zH
zH
+ ψH
(5)
whereu∗ is the friction velocity (m s−1):
u∗ = u k
ln
z
ref − d + zm
zm
+ ψm
−1
(6)
is wind speed (m s−1),kis von Karman’s constant,dis the zero plane displacement,z
m
andzHare the surface roughness parameters for momentum and temperature
respec-10
tively,ψmandψHare the stability correction functions for momentum and heat transfer
respectively. Atmospheric stability is expressed as the ratio of thermally induced to mechanically induced turbulence (Campbell, 1977):
s = k zref g H
ρaca (Ta + 273.16)u 3
∗
(7)
wheregis the gravitational acceleration (m s−2). 15
Whens >0 (stable conditions):
ψH = ψm = 4.7s (8)
and whens <0 (unstable conditions):
ψm ≈ 0.6ψH and ψH = −2 ln
1 + √1 − 16s 2
!
HESSD
8, 8639–8670, 2011Shallow groundwater effect on land surface
temperature
F. Alkhaier et al.
Title Page
Abstract Introduction
Conclusions References
Tables Figures
◭ ◮
◭ ◮
Back Close
Full Screen / Esc
Printer-friendly Version
Interactive Discussion
Discussion
P
a
per
|
Dis
cussion
P
a
per
|
Discussion
P
a
per
|
Discussio
n
P
a
per
|
Ground heat flux, G, is a function of thermal conductivity, ks, and soil temperature
gradient,∂T /∂z, and expressed by:
G = −ks
∂T
∂z. (10)
Ground heat flux is computed by solving for a surface temperature that satisfies surface energy balance, which is solved iteratively and simultaneously with the equations for 5
heat and water fluxes within the soil profile.
3.1.2 Heat transfer within the soil matrix
The governing equation for temperature variation in the soil matrix within SHAW consid-ers, next to heat conduction, latent heat of water freezing and ice thawing, convective heat transfer by liquid water flux and latent heat transfer by vapor:
10
VHC∂T
∂t −ρiLf ∂θi
∂t =
∂(ks∂T)
∂2z − VHCW
∂qlT
∂z − L
∂q
v
∂z + ∂ρv
∂t
(11)
whereρi is ice density (kg m− 3
); Lf is the latent heat of fusion (J kg− 1
);θi is the
volu-metric ice content (m3m−3); VHC and VHC
W are the volumetric heat capacity of soil
matrix and water respectively (J m−3◦C−1);ql is the liquid water flux (m s− 1
); qv is the
water vapor flux (kg m−2s−1) andρvis the vapor density (kg m− 3
). 15
Soil thermal properties are calculated according to de Vries (1963). Hence, the soil thermal conductivityks(Wm−
1◦
C−1) is expressed as:
ks =
P
mj kj Xj
P
mj Xj (12)
and the soil volumetric heat capacity VHC (J m−3◦C−1
) is expressed as:
VHC = XVHCj Xj (13)
HESSD
8, 8639–8670, 2011Shallow groundwater effect on land surface
temperature
F. Alkhaier et al.
Title Page
Abstract Introduction
Conclusions References
Tables Figures
◭ ◮
◭ ◮
Back Close
Full Screen / Esc
Printer-friendly Version
Interactive Discussion
Discussion
P
a
per
|
Dis
cussion
P
a
per
|
Discussion
P
a
per
|
Discussio
n
P
a
per
|
wherekj, VHCj,mj andXj are the thermal conductivity, the volumetric heat capacity, the weighting factor and volumetric fraction of thej-th soil constituent (i.e. sand, silt, clay, organic matter, water, ice and air).
3.1.3 Water and vapor fluxes within the soil matrix
The governing equation for water movement within soil matrix is expressed in SHAW by 5
extending the traditional Richards equation to include the dynamic change in volumetric ice content and water vapor flux within the soil pores:
∂θl
∂t + ρi
ρl ∂θi
∂t = ∂ ∂z
kh
∂ψ
∂z +1
+ ρ1
l
∂qv
∂z +U (14)
where θl is the volumetric liquid water content (m 3
m−3), ρl is the liquid water
den-sity (kg m−3); kh is the unsaturated hydraulic conductivity (m s− 1
); ψ is the soil matric 10
potential (m) andU is a source/sink term (m3m−3s−1).
The moisture characteristic equation is expressed as (Brooks and Corey, 1966; Campbell, 1974):
ψ = ψae
θ
l
φ
−b
(15)
whereψae is air entry potential (m), b is a pore size distribution parameter, and φis
15
soil porosity (m3m−3). Unsaturated hydraulic conductivity is computed from:
kh = kh∗
θ
l
φ
(2b+3)
(16)
wherek∗
his saturated hydraulic conductivity (ms
−1
HESSD
8, 8639–8670, 2011Shallow groundwater effect on land surface
temperature
F. Alkhaier et al.
Title Page
Abstract Introduction
Conclusions References
Tables Figures
◭ ◮
◭ ◮
Back Close
Full Screen / Esc
Printer-friendly Version
Interactive Discussion
Discussion
P
a
per
|
Dis
cussion
P
a
per
|
Discussion
P
a
per
|
Discussio
n
P
a
per
|
Vapor flux in soil pores occurs because of the gradient in vapor density. The latter is the result of both water potential gradient,qvp, and temperature gradientqvT (Campbell, 1985), so:
qv = qvp + qvT = −Dvρv
dhr
dz − ξ Dvhrsv dT
dz (17)
whereDvis vapor diffusivity within the soil matrix (m 2
s−1);h
ris relative humidity within
5
the soil matrix;ξ is an enhancement factor; sv (kg m− 3◦C−1
) is the slope of the satu-rated vapor pressure curve (dρv′/dT).
The one-dimensional state equations describing energy and water balance are writ-ten in implicit finite difference form and solved using an iterative Newton-Raphson tech-nique for infinitely small layers.
10
Atmospheric forcing above the upper boundary (land surface) and soil conditions within the soil profile define heat and water fluxes within the system. Consequently, the input to the SHAW model includes (a) meteorological data and general site informa-tion, (b) soil composition and hydraulic parameters and (c) initial soil temperature and moisture.
15
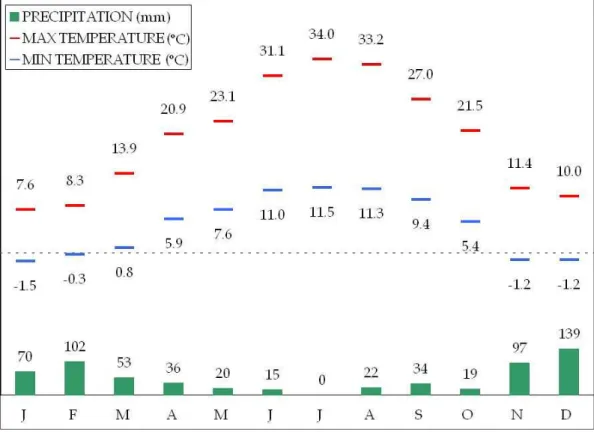
3.2 Simulation duration, time step and the applied meteorological data
All simulations were run for one year duration, after three years of pre-simulation in order to reach proper initial boundary conditions (i.e. soil moisture and temperature profiles). The time step was chosen to be 1 h.
The daily weather input data includes minimum and maximum temperatures, dew 20
HESSD
8, 8639–8670, 2011Shallow groundwater effect on land surface
temperature
F. Alkhaier et al.
Title Page
Abstract Introduction
Conclusions References
Tables Figures
◭ ◮
◭ ◮
Back Close
Full Screen / Esc
Printer-friendly Version
Interactive Discussion
Discussion
P
a
per
|
Dis
cussion
P
a
per
|
Discussion
P
a
per
|
Discussio
n
P
a
per
|
summer and cool wet winter. Figure 2 shows monthly averaged data for minimum and maximum temperatures and precipitation of the year under consideration.
3.3 Soil profile information
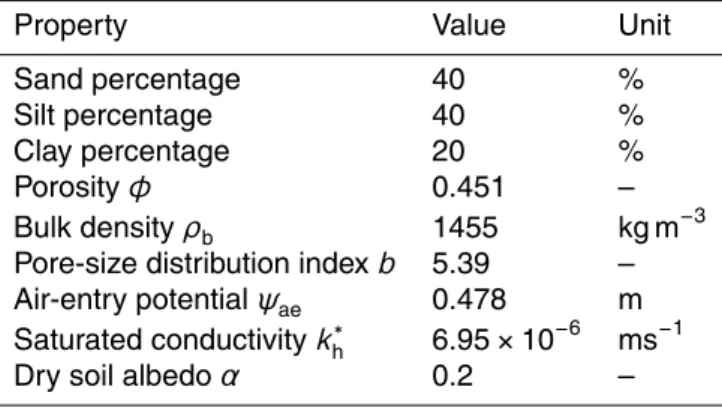
The soil of both profiles was chosen to be loam, which is medium-textured soil and contains a relatively even mixture of sand, silt, and clay (Brown, 2003). The soil texture 5
composition and hydraulic parameters are listed in Table 1 (Clapp and Hornberger, 1978). The depth of both profiles was assigned to be 30 m to ensure that it is deeper than the common annual depth of heat penetration. The lower boundary condition at the bottom of both profiles was set as a fixed temperature (Dirichlet boundary condition) that is equal to the mean annual temperature at the simulated site. Matric potential of 10
the bottom soil layer for the profile with shallow groundwater was set to maintain a water table at 2 m below the soil surface. The lower boundary for the water flow of the profile with no water table (NOGWP) was assumed to be gravitational flow.
After solving for heat and water fluxes within the soil simultaneously with the en-ergy balance at soil surface for each profile, the model provided for each time step 15
the parameters of our concern, i.e. soil moisture, soil temperature, net radiation and heat fluxes (latent, sensible and ground heat fluxes) at land surface. Temperature and moisture of the surface 2.5 cm soil layer within the model were taken as “surface” con-ditions. The different responses of both profiles were compared with respect to the abovementioned parameters.
20
4 Simulation results and discussion
HESSD
8, 8639–8670, 2011Shallow groundwater effect on land surface
temperature
F. Alkhaier et al.
Title Page
Abstract Introduction
Conclusions References
Tables Figures
◭ ◮
◭ ◮
Back Close
Full Screen / Esc
Printer-friendly Version
Interactive Discussion
Discussion
P
a
per
|
Dis
cussion
P
a
per
|
Discussion
P
a
per
|
Discussio
n
P
a
per
|
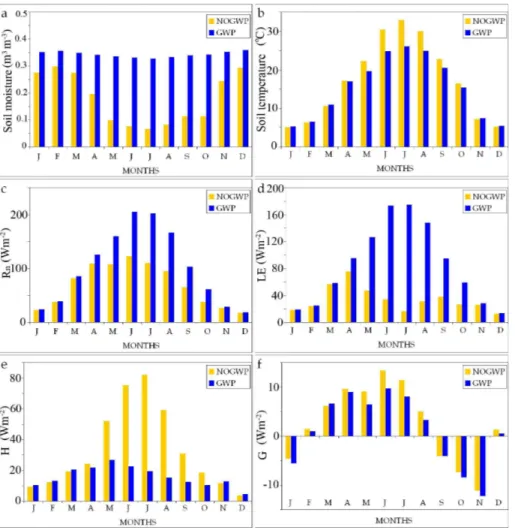
Surface soil moisture (Fig. 3a) of GWP persisted at high levels all year round. This was due to the incessant water supply from the shallow water table. This supply was not provided for NOGWP which suffered moisture deficit in summer as a result of the increase in potential evaporation and the absence of frequent rainfalls.
Surface soil temperature (Fig. 3b) of GWP was slightly higher than that of NOGWP in 5
winter and noticeably lower in summer. We ascribe the higher surface temperature of GWP in wintertime to its higher volumetric heat capacity. This effect revealed itself de-spite the counteractive effects of evaporation and longwave radiation emission. While the latent heat flux was exploiting the higher temperature in more evaporation, the longwave radiation was continuously alleviating land surface temperature by emitting 10
energy into the atmosphere. Nevertheless, the latter two effects were minor in winter. In summertime, evaporation played a major role in cooling down the soil surface of GWP.
Net radiation (Fig. 3c) of GWP was generally higher than that of NOGWP all through the year. The higher soil moisture of GWP resulted in lower surface albedo (Eq. 2a); 15
this in turn induced smaller magnitude of reflected shortwave radiation which caused higher net radiation (Eq. 2).
Latent heat flux (Fig. 3d) of GWP was continually higher than that of NOGWP. While GWP had boundless supply of water, NOGWP lacked that supply to meet the demand of potential evaporation. This was especially apparent during the dry hot summer at 20
what time the difference in LE between the two profiles was at its highest level.
Synchronized with soil temperature behavior, sensible heat flux (Fig. 3e) of GWP was a little higher in winter and noticeably lower in summer.
In comparison to NOGWP, ground heat flux of GWP had the propensity to be weaker when it was positive and stronger when it was negative (Fig. 3f). Since soil thermal 25
conductivity,ks, was always higher in GWP, the magnitude of soil temperature gradient,
HESSD
8, 8639–8670, 2011Shallow groundwater effect on land surface
temperature
F. Alkhaier et al.
Title Page
Abstract Introduction
Conclusions References
Tables Figures
◭ ◮
◭ ◮
Back Close
Full Screen / Esc
Printer-friendly Version
Interactive Discussion
Discussion
P
a
per
|
Dis
cussion
P
a
per
|
Discussion
P
a
per
|
Discussio
n
P
a
per
|
depth was gaining heat, i.e. ground heat flux was downward (positive), and coincided with the months when surface temperature of NOGWP was considerably higher than that of GWP.
The yearly averaged values (Table 2) of the variables shown in Fig. 3, indicates that in the long run, GWP had higher values for soil moisture, net radiation and latent heat 5
flux and lower values for soil temperature, sensible heat flux and ground heat flux. In GWP, the ample surface soil moisture, which was endowed by the nearby water table, increased the albedo. This in turn made the net radiation higher. Latent heat flux was also higher due to the abundant soil moisture which facilitated satisfying po-tential evaporation demand. This demand could not be met in NOGWP, and the extra 10
available energy was spent for increasing soil temperature. The increased soil surface temperature brought on higher magnitudes of sensible and ground heat fluxes.
Ground heat flux in GWP was lower, even though it had higher soil thermal conduc-tivity. Thermal conductivity affects heat flux intensity in both vertical directions, thus its effect fades away in the long run. Under this condition, soil temperature gradient, 15
∂T /∂z, becomes the sole governor of ground heat flux magnitude (Eq. 10). Given that the milder surface soil temperature fluctuations in GWP induce smaller soil temperature gradients, the yearly upshot of ground heat flux is always smaller in areas dominated by shallow groundwater.
To get a bird’s eye view of the instantaneous behavior of the two profiles in terms of 20
the variables under consideration, we zoomed into two-hourly averaged data for three days: one typical winter day (3 January), one typical summer day (16 July) and one wet summer day (19 June).
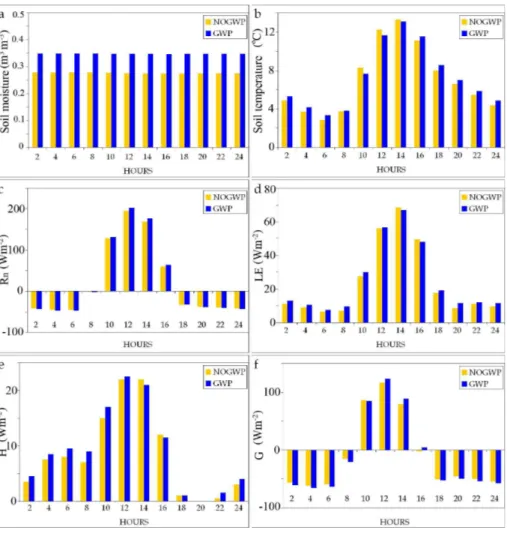
In the winter day (Fig. 4), both profiles were comparably wet, though surface soil moisture of GWP was slightly higher (Fig. 4a). This emphasizes that the two profiles 25
HESSD
8, 8639–8670, 2011Shallow groundwater effect on land surface
temperature
F. Alkhaier et al.
Title Page
Abstract Introduction
Conclusions References
Tables Figures
◭ ◮
◭ ◮
Back Close
Full Screen / Esc
Printer-friendly Version
Interactive Discussion
Discussion
P
a
per
|
Dis
cussion
P
a
per
|
Discussion
P
a
per
|
Discussio
n
P
a
per
|
volumetric heat capacity and needs more time to warm up or cool down. Net radia-tion of GWP was slightly higher day and night (Fig. 4c). During nighttime, the higher negative net radiation of GWP was due to the higher outgoing longwave radiation. The effect of the lower albedo of GWP appeared during daytime through a small increment in its positive net radiation. Similarly, ground heat flux of GWP was a little higher most 5
of the time (Fig. 4f). Both latent and sensible heat fluxes of GWP remained somewhat higher day and night except for a few hours after noon (Fig. 4d and e).
In this winter day, the low atmospheric demand for moisture (i.e. potential evapora-tion), the low temperature contrast between day and night and the comparable wetness status of the two profiles made the differences between them small in terms of the dis-10
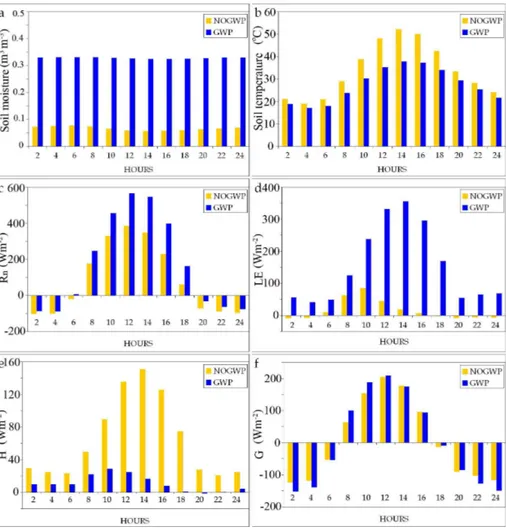
cussed parameters. On the contrary, the summer day demonstrated large and clear differences (Fig. 5).
The high potential evaporation rapidly consumed the available soil moisture in both profiles (Fig. 5a). However, the deficit in soil moisture of GWP was compensated by upward fluxes of both water and vapor from the water table. This resulted in consider-15
ably higher soil moisture and latent heat flux in this profile (Fig. 5a and d). Land surface temperature and hence sensible heat flux of GWP were remarkably lower both day and night (Fig. 5b and e). Net radiation of GWP was higher during daytime, but a little lower in nighttime (Fig. 5c). Finally, ground heat flux of GWP tended to be stronger than that of NOGWP most of the time (Fig. 5f). The higher thermal conductivity of GWP 20
induced clearly stronger ground heat flux during nighttime. During daytime, the higher surface temperature of NOGWP imposed higher soil temperature gradient,∂T /∂z, and resulted in comparable ground heat flux values between the two profiles.
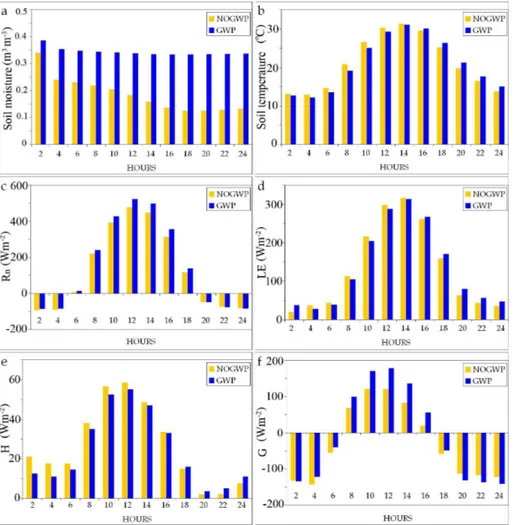
It may be useful to observe what happened after it had rained in summer (Fig. 6). The rain temporarily compensated the moisture deficit in NOGWP, thus the change oc-25
HESSD
8, 8639–8670, 2011Shallow groundwater effect on land surface
temperature
F. Alkhaier et al.
Title Page
Abstract Introduction
Conclusions References
Tables Figures
◭ ◮
◭ ◮
Back Close
Full Screen / Esc
Printer-friendly Version
Interactive Discussion
Discussion
P
a
per
|
Dis
cussion
P
a
per
|
Discussion
P
a
per
|
Discussio
n
P
a
per
|
surface soil moisture of NOGWP after rainfall (Fig. 6a compared to Fig. 5a) increased latent heat flux (Fig. 6d) and decreased the surface albedo which caused the increment in daytime net radiation (Fig. 6c). Surface soil temperature of NOGWP decreased and became comparable to that of GWP (Fig. 6b). Here we notice that the effect of the difference in volumetric heat capacity became clear again, particularly when surface 5
temperature of GWP decreased slower during the decreasing phase. Harmonized with surface soil temperature, sensible heat flux of NOGWP decreased to become compa-rable to that of GWP (Fig. 6e). Finally, ground heat flux of NOGWP decreased during daytime (downward flux), due to the cooling surface temperature which decreased soil temperature gradient,∂T /∂z(Fig. 6f).
10
The above results show that GWP is more capable of meeting the demand of po-tential evaporation. When evaporation is not that intense or precipitation provides both profiles with adequate amount of moisture, differences in latent heat flux are minor be-tween the two profiles. Under such conditions, latent heat fluxes of the two profiles have approximately the same values.
15
On the other hand, latent heat flux plays a major role in differentiating between the two profiles when potential evaporation is sufficiently strong. Thus, large portion of the available energy for GWP is consumed by evaporation, leaving less energy to be spent in warming the soil surface. Consequently, the cooler surface soil causes smaller exchange of heat with the air above land surface (i.e. sensible heat flux) and with 20
subsurface soil layers (i.e. ground heat flux).
Nevertheless, the increment of latent heat flux due to the excess of soil moisture is not the sole player within the course of shallow groundwater effect on surface tempera-ture and surface energy balance. Actually, the results show that there are other factors that play a role in shaping and molding that effect. Due to its higher moisture, GWP has 25
HESSD
8, 8639–8670, 2011Shallow groundwater effect on land surface
temperature
F. Alkhaier et al.
Title Page
Abstract Introduction
Conclusions References
Tables Figures
◭ ◮
◭ ◮
Back Close
Full Screen / Esc
Printer-friendly Version
Interactive Discussion
Discussion
P
a
per
|
Dis
cussion
P
a
per
|
Discussion
P
a
per
|
Discussio
n
P
a
per
|
The effect of volumetric heat capacity was clear in the temperature behavior when the difference in wetness between the two profiles was not severe, i.e. in the winter day and the rainy summer day (Figs. 4 and 6). Under this condition, the profile with higher volumetric heat capacity (GWP) shows a delayed temperature response during both increasing and decreasing phases. On the other hand, the effect of thermal conductiv-5
ity was clear in increasing the intensity of ground heat flux within GWP, and the effect of albedo was clear in increasing its net radiation. Finally, the effect of emissivity as aforementioned is minor due to its two fold connection to both incoming and outgoing longwave radiation. The latter two have generally comparable magnitudes and act in opposite directions. Actually, we cannot trace this effect in the figures presented in 10
this study because SHAW adopts a constant value of emissivity of 1.0 and does not account for its moisture dependency.
The results show that the effect of shallow groundwater on surface soil temperature is definite. However, what can be learned regarding differences large enough to be detectable via the currently operational satellites? We noticed that the temperature 15
differences in the winter day were small (about ±0.5◦C), and might be difficult to be detected remotely (Fig. 4). On the contrary, the differences in both summer days were big enough, and could be basically sensed using the currently operational thermal infrared sensors (Figs. 5 and 6).
Concerning the best time of the day to detect groundwater effect, the presented re-20
sults show that all day and night hours are suitable when the effect of latent heat flux is predominant (Fig. 5). When the effect of volumetric heat capacity is predominant, most day and night hours are suitable except for the transition period when the temperature of the two profiles equalizes (Figs. 4 and 6).
In our experiment, we applied two meters as water table depth; however the critical 25
HESSD
8, 8639–8670, 2011Shallow groundwater effect on land surface
temperature
F. Alkhaier et al.
Title Page
Abstract Introduction
Conclusions References
Tables Figures
◭ ◮
◭ ◮
Back Close
Full Screen / Esc
Printer-friendly Version
Interactive Discussion
Discussion
P
a
per
|
Dis
cussion
P
a
per
|
Discussion
P
a
per
|
Discussio
n
P
a
per
|
5 Conclusions and recommendations
The purpose of this investigation was to explore the features of shallow groundwater effect on land surface temperature and surface energy balance components under bare soil conditions. We illustrated that areas dominated by shallow groundwater have wetter soil profile due to the upward water and vapor flux; consequently, they respond 5
differently to the prevailing atmospheric forcing. We brought to light fundamental factors that take action within the scope of this effect.
Generally speaking, shallow groundwater areas reflect less shortwave radiation to the atmosphere due to their lower albedo and therefore, they get higher magnitude of shortwave radiation. When potential evaporation demand is high enough, a large 10
portion of the energy received by these areas is spent on evaporation. This makes the latent heat flux predominant, and leaves less energy to heat the soil. Consequently, this induces lower magnitudes of both sensible and ground heat fluxes.
The higher soil thermal conductivity in shallow groundwater areas facilitates heat transfer between the top soil and the subsurface which promotes greater provisional 15
heat transfer in both vertical directions. That is to say, soil subsurface is more ther-mally connected to the atmosphere. Nevertheless, the milder surface temperatures of such areas make the upshot of ground heat flux smaller in the long run, i.e. the yearly average.
With regards to remote sensors’ capability of detecting shallow groundwater effect on 20
land surface temperature, we found that this effect can be sufficiently clear to be sensed if at least one of two conditions are met: firstly, latent heat flux effect is predominant due to the high potential evaporation, or secondly, soil volumetric heat capacity effect is strong due to the big contrast in air temperature between day and night.
Wherever it is possible to delineate the effect of shallow groundwater on remotely 25
HESSD
8, 8639–8670, 2011Shallow groundwater effect on land surface
temperature
F. Alkhaier et al.
Title Page
Abstract Introduction
Conclusions References
Tables Figures
◭ ◮
◭ ◮
Back Close
Full Screen / Esc
Printer-friendly Version
Interactive Discussion
Discussion
P
a
per
|
Dis
cussion
P
a
per
|
Discussion
P
a
per
|
Discussio
n
P
a
per
|
surface temperature, remotely sensed data such as land surface albedo, emissivity, vegetation indexes, etc, jointly with other supplementary information collected in the field (weather conditions, soil data, etc.). The practical utilization of remote sensing data and SEBS in delineating shallow groundwater effect on land surface temperature and surface energy balance is illustrated in the companion paper (Alkhaier et al., 2011). 5
The numerical experiment in this study represents a special case; it was imple-mented for specific site, climate type, soil conditions and water table depth. In spite of that, it was helpful in highlighting the main aspects of shallow groundwater effect and in concluding important findings regarding shallow groundwater depth detection using thermal remote sensing. This is because we used (1) a soil type (loam) that con-10
tains a relatively even mixture of sand, silt, and clay, and (2) a climate that has various weather conditions; wet and cold in winter, and dry and hot in summer. However, the complex convoluted interactions among the different components of surface energy balance may differ from one region to another and from time to time, in accordance to the site specific conditions. Hence in areas where there is a doubt concerning the 15
chances and conditions of groundwater depth detection using thermal remote sensing, it is advisable to implement numerical simulations that consider the specific conditions prevailing in the area under investigation (i.e. site elevation and latitude, soil types and characteristics, climate type, water table depth, etc.).
Acknowledgements. The authors highly appreciate the editor Harrie-Jan Hendricks Franssen,
20
and the reviewers for their sincere efforts and constructive comments.
References
Alkhaier, F., Schotting, R. J., and Su, Z.: A qualitative description of shallow groundwa-ter effect on surface temperature of bare soil, Hydrol. Earth Syst. Sci., 13, 1749–1756, doi:10.5194/hess-13-1749-2009, 2009.
HESSD
8, 8639–8670, 2011Shallow groundwater effect on land surface
temperature
F. Alkhaier et al.
Title Page
Abstract Introduction
Conclusions References
Tables Figures
◭ ◮
◭ ◮
Back Close
Full Screen / Esc
Printer-friendly Version
Interactive Discussion
Discussion
P
a
per
|
Dis
cussion
P
a
per
|
Discussion
P
a
per
|
Discussio
n
P
a
per
|
Alkhaier, F., Su, Z., and Flerchinger, G. N.: Reconnoitering the effect of shallow groundwater on land surface temperature and surface energy balance using MODIS and SEBS, Hydrol. Earth Syst. Sci. Discuss., 8, doi:10.5194/hessd-8-8671-2011, 8671–8700, 2011.
Bense, V. F. and Kooi, H.: Temporal and spatial variations of shallow subsurface tempera-ture as a record of lateral variations in groundwater flow, J. Geophys. Res., 109, B04103,
5
doi:10.1029/2003JB002782, 2004.
Birman, H.: Geothermal exploration for groundwater, Geol. Soc. Am. Bull., 80, 617–630, 1969. Brown, R. B.: Soil Texture, University of Florida, Institute of Food and Agricultural Sciences,
fact sheet SL-29, 2003.
Campbell, G. S.: Simple method for determining unsaturated conductivity from moisture
reten-10
tion data, Soil Sci., 117, 311–314, 1974.
Campbell, G. S.: An Introduction to Environmental Biophysics, Springer-Verlag, New York, 1977.
Campbell, G. S.: Soil Physics with BASIC: Transport models for soil-plant systems, Elsevier, Amsterdam, 1985.
15
Cartwright, K.: Thermal prospecting for groundwater, Water Resour. Res., 4, 395–401, 1968. Cartwright, K.: Redistribution of geothermal heat by a shallow aquifer, Geol. Soc. Am. Bull., 82,
3197–3200, 1971.
Cartwright, K.: Tracing shallow groundwater systems by soil temperatures, Water Resour. Res., 10, 847–855, 1974.
20
Chase, M. E.: Airborne remote sensing for groundwater studies in prairie environment, Can. J. Earth Sci., 6, 737–741, 1969.
Chen, X. and Hu, Q.: Groundwater influences on soil moisture and surface evaporation, J. Hydrol., 297, 285–300, 2004.
Clapp, R. B. and Hornberger, G. M.: Empirical equations for some soil hydraulic properties,
25
Water Resour. Res., 14, 601–604, 1978.
de Vries, A. D.: Thermal properties of soils, In Physics of plant environment, North Holland Publication Company, Amsterdam, the Netherlands, 210–235, 1963.
Dingman, S. L.: Physical Hydrology, Prentice-Hall Inc., Upper Saddle River, New Jersey, 2002. Fan, Y., Miguez-Macho, G., Weaver, C. P., Walko, R., and Robock, A.: Incorporating water
30
HESSD
8, 8639–8670, 2011Shallow groundwater effect on land surface
temperature
F. Alkhaier et al.
Title Page
Abstract Introduction
Conclusions References
Tables Figures
◭ ◮
◭ ◮
Back Close
Full Screen / Esc
Printer-friendly Version
Interactive Discussion
Discussion
P
a
per
|
Dis
cussion
P
a
per
|
Discussion
P
a
per
|
Discussio
n
P
a
per
|
Flerchinger, G. N.: The simultaneous heat and water (SHAW) model, Technical Report, 37, Northwest Watershed Research Centre, USDA, Agricultural Research Service, Boise, Idaho, 2000.
Flerchinger, G. N. and Cooley, K. R.: A ten-year water balance of a mountainous semi-arid watershed, J. Hydrol., 237, 86–99, 2000.
5
Flerchinger, G. N., Sauer, T. J., and Aiken, R. A.: Effects of crop residue cover and architecture on heat and water transfer at the soil surface, Geoderma, 116, 217–233, doi:10.1016/S0016-7061(03)00102-2, 2003.
Flerchinger, G. N. and Hardegree, S. P.: Modelling near-surface soil temperature and moisture for germination response predictions of post-wildfire seedbeds, J. Arid Environ., 59, 369–
10
385, doi:10.1016/j.jaridenv.2004.01.016, 2004.
Flerchinger, G. N., Xiao, W., Sauer, T. J., and Yu, Q.: Simulation of within-canopy radiation exchange, NJAS-Wagen., J. Life Sc., 57, 5–15, 2009.
Furuya, G., Suemine, A., Sassa, K., Komatsubara, T., Watanabe, N., and Marui, H.: Re-lationship between groundwater flow estimated by soil temperature and slope failures
15
caused by heavy rainfall, Shikoku Island, south western Japan, Eng. Geol., 85, 332–346, doi:10.1016/j.enggeo.2006.03.002, 2006.
Grismer, M. E., Orang, M. N., Clausnitzer, V., and Kinney, K.: Effects of air compres-sion and counterflow on infiltration into soils, J. Irrig. Drain. E.-ASCE, 120, 775–795, doi:10.1061/(ASCE)0733-9437(1994)120:4(775), 1994.
20
Gulden, L. E., Rosero, E., Yang, Z., Rodell, M., Jackson, C. S., Niu, G., Yeh, P. J.-F., and Famiglietti, J.: Improving land-surface model hydrology: Is an explicit aquifer model better than a deeper soil profile?, Geophys. Res. Lett., 34, L09402, doi:10.1029/2007GL029804, 2007.
Heilman, J. L. and Moore, D. G.: Evaluating depth to shallow groundwater using heat capacity
25
mapping mission (HCMM) data, Photogramm. Eng. Rem. S., 48, 1903–1906, 1982.
Huang, M. and Gallichand, J.: Use of the SHAW model to assess soil water recovery after apple trees in the gully region of the Loess Plateau, China, Agr. Water Manage., 85, 67–76, doi:10.1016/j.agwat.2006.03.009, 2006.
Huntley, D.: On the detection of shallow aquifers using thermal infrared imagery, Water Resour.
30
Res., 14, 1075–1083, 1978.
HESSD
8, 8639–8670, 2011Shallow groundwater effect on land surface
temperature
F. Alkhaier et al.
Title Page
Abstract Introduction
Conclusions References
Tables Figures
◭ ◮
◭ ◮
Back Close
Full Screen / Esc
Printer-friendly Version
Interactive Discussion
Discussion
P
a
per
|
Dis
cussion
P
a
per
|
Discussion
P
a
per
|
Discussio
n
P
a
per
|
Jiang, X. Y., Niu, G. Y., and Yang, Z. L.: Impacts of vegetation and groundwater dynamics on warm season precipitation over the central United States, J. Geophys. Res., 114, D06109, doi:10.1029/2008JD010756, 2009.
Kappelmeyer, O.: The use of near surface temperature measurements for discovering anoma-lies due to causes at depths, Geophys. Prospect., 5, 239–258, 1957.
5
Krcmar, B. and Masin, J.: Prospecting by the geothermic method, Geophys. Prospect., 18, 255–260, doi:10.1111/j.1365-2478.1970.tb02106.x, 1970.
Liang, X. and Xie, Z.: Important factors in land-atmosphere interactions: surface runoff gen-erations and interactions between surface and groundwater, Global Planet. Change, 38, 101–114, 2003.
10
Maxwell, R. M. and Miller, N. L.: Development of a coupled land surface and groundwater model, J. Hydrometorol., 6, 233–247, 2005.
Niu, G.-Y., Yang, Z.-L., Dickinson, R. E., Gulden, L. E., and Su, H.: Development of a simple groundwater model for use in climate models and evaluation with Gravity Recovery and Cli-mate Experiment data, J. Geophys. Res., 112, D07103, doi:10.1029/2006JD007522, 2007.
15
Olmsted, F. H., Welch, A. H., and Ingebritsen, S. E.: Shallow subsurface temperature surveys in the basin and range province, U.S.A., I. Review and evaluation, Geothermics, 15, 251–265, 1986.
Quiel, F.: Thermal/IR in geology, Photogramm. Eng. Rem. S., 41, 341–346, 1975.
Salvucci, G. D. and Entekhabi, D.: Ponded infiltration into soils bounded by a water table. Water
20
Resour. Res., 31, 2751–2759, 1995.
Santanello, J. A. and Friedl, M. A.: Diurnal covariation in soil heat flux and net radiation, J. Appl. Meteorol., 42, 851–862, 2003.
Su, Z.: The Surface Energy Balance System (SEBS) for estimation of turbulent heat fluxes, Hydrol. Earth Syst. Sci., 6, 85–100, doi:10.5194/hess-6-85-2002, 2002.
25
van den Bouwhuysen, J. N. A.: The thermocouple proves useful on a geophysical survey, Eng. Min. J., 135, 342–344, 1934.
York, J. P., Person, M., Gutowski, W. J., and Winter, T. C.: Putting aquifers into atmospheric simulation models: an example from the Mill Creek watershed, northeastern Kansas, Adv. Water Resour., 25, 221–238, 2002.
HESSD
8, 8639–8670, 2011Shallow groundwater effect on land surface
temperature
F. Alkhaier et al.
Title Page
Abstract Introduction
Conclusions References
Tables Figures
◭ ◮
◭ ◮
Back Close
Full Screen / Esc
Printer-friendly Version
Interactive Discussion
Discussion
P
a
per
|
Dis
cussion
P
a
per
|
Discussion
P
a
per
|
Discussio
n
P
a
per
|
Table 1.Texture Composition and Physical Properties of Soil in the Two Profiles.
Property Value Unit
Sand percentage 40 %
Silt percentage 40 %
Clay percentage 20 %
Porosityφ 0.451 –
Bulk densityρb 1455 kg m− 3
Pore-size distribution indexb 5.39 – Air-entry potentialψae 0.478 m
Saturated conductivityk∗
h 6.95×10− 6
ms−1
HESSD
8, 8639–8670, 2011Shallow groundwater effect on land surface
temperature
F. Alkhaier et al.
Title Page
Abstract Introduction
Conclusions References
Tables Figures
◭ ◮
◭ ◮
Back Close
Full Screen / Esc
Printer-friendly Version
Interactive Discussion
Discussion
P
a
per
|
Dis
cussion
P
a
per
|
Discussion
P
a
per
|
Discussio
n
P
a
per
|
Table 2. The Yearly Averaged Values of Surface Soil Moisture, Surface Soil Temperature and the Surface Energy Balance Components for the simulated Year.
Variable/ θl Ts Rn LE H G
Unit m3m−3 ◦C Wm−2
Wm−2
Wm−2
Wm−2
HESSD
8, 8639–8670, 2011Shallow groundwater effect on land surface
temperature
F. Alkhaier et al.
Title Page
Abstract Introduction
Conclusions References
Tables Figures
◭ ◮
◭ ◮
Back Close
Full Screen / Esc
Printer-friendly Version
Interactive Discussion
Discussion
P
a
per
|
Dis
cussion
P
a
per
|
Discussion
P
a
per
|
Discussio
n
P
a
per
|