IN ROMANIA
1
Authors: Daniela ANTONESCU2,
Florina POPA3
bstract: The urbanisation process in Romania followed a variable growth trajectory (that intensified), stagnation and, in the last period, a slightly decreasing trend. Thus, the years between the sixties to the nineties were characterised by marked development, concomitantly with population increase in small- and medium-sized towns. After the year 1990, the developments were different from one urban area to another: some succeeded in adjusting quicker to the new conditions; others were overwhelmed by the new town status. Currently, they are facing a series of problems triggered both by internal factors (urban agglomeration, pollution, built-environment deterioration, decrease in living standards quality, etc.), and external ones (EU integration, globalisation, financial crisis, etc.).Currently, urban areas draw increasingly more attention due to their important potential and to the role played in the current integration and economic and social cohesion process. The present article intends to capture the urbanisation process evolution in Romania and to identify current difficulties and opportunities confronting these areas.
Keywords: urban regions, cities, regions JEL Classification: R11, R12, F02
1 This article was based on the research work developed in the year 2011, coordinated
by Dr. Daniela Antonescu and entitled “Contribution of urban areas to strengthening economic and social cohesion”.
2 SR II, INE, Romanian Academy, email: [email protected]. 3 SR, INE, Romanian Academy, email: [email protected].
1. Introduction
Generally, the issue of urban area is particularly complex due to the multi-disciplinary character of approaches and analyses at this level, as they cover a very broad range of fields and activities of social, demographic, economic, environmental and infrastructural nature, etc.
From the economic viewpoint, the approach to the urban issue emerges, especially, from the intention of acting and answering the real questions of life (unemployment, migration, traffic congestion, pollution, building, housing, etc.). It is noticed that initiating analyses at urban level is closely related to emergence of economic and social crises that require specific territorial policies and measures. The town turns, under these conditions, into a scientific objective of surpassing some dysfunctions, or imbalances emerged in time as effect of disturbing internal or external factors.
With respect to the Romanian urban system, it still is under the impact of the forced industrialisation policies’ effect (before 1990), which led to the creation of some urban centres in the midst of rural areas without providing for basic services and, sometimes, even without the necessary functional resources (human, financial, etc.).
After 1990, the urban centres have evolued in different way: some succeeded to adjust swifter to the new conditions; others were overwhelmed by the town status. For several of these towns, a series of difficulties triggered by the internal factors (urban agglomeration, pollution, deterioration of the built environment, decrease in the living standards, economic structure, etc.), external factors (EU integration, globalisation, the financial crisis, etc.) but also by the inexistence of an “urban culture” all affected the positive developments up to 2010. The opportunities created by the new status as a European Union member state and the absorption of funds dedicated to urban development (integrate, polarise, sustain) could contribute to diminishing the effects of the current financial crisis and halting the decline of some categories of areas.
2. Evolution of the urbanisation process
Initiated practically in 1945, the urbanisation process in Romania was influenced by a series of economic and demographic phenomena which shifted the territorial importance of the country in favour of urban areas (cities). This process was supported by the territorial reform in the year 1968 (the last one) that determined the territorial division of Romania into 41 counties plus the Bucharest Municipality (residence of County of Ilfov, but separately administered – a municipality with county rights).
All the stages of cities’ modern development were accompanied by the artificial growth in the share of urban population by legislative definition of some categories of areas: suburban communities, cities, municipalities.
In a first stage, the demographic evolution of towns in Romania was characterised by an important process of territorial centralisation and sectoral development policies. Thus, four main stages can be identified:
1. A first stage is represented by the industrial revolution which resulted in specialised industrial urban centres (1950-1970);
2. The second stage is characterised by forced industrialisation of urban centres and of some average-sized cities (1970-1980);
3. The third state consists in industrialising small towns and some rural localities, designed as agricultural-industrial centres (1980-1990);
4. The last stage is under the influence of an important industrial restructuring and privatisation process, which led to increasing importance of the services sector at urban level, generating a labour force surplus in many of these areas (1990 to date).
Undergoing the stages presented above triggered, finally, a significant increase in the urbanisation degree (1960-2002), from 32.1% to 52.7%.
Figure 1: Urban settlements evolution, 1960-2010 (urban population in total, %)
Source: Own computations, see Annex 1.
The consequences of the phenomena presented above consisted in an increase in number of large-size towns, which practically, doubled in the period 1960-2002. Hence, the analysis of the structure by size groups of the urban areas (depending on the number of inhabitants) reveals the predominance of towns up to 20.000 inhabitants (60.75%), and regarded as medium and large. Also, a net distancing of the capital from the other towns of the country can be seen and, after 1989, the emergence of large urban centres (towns with a population of over 300.000 inhabitants – Annex 2).
In 2010, the urban population recorded a decrease as compared with 2008 (-0.3%) following the national trend of diminishing the total number of inhabitants, as due to birth rate decrease and migration increase. The share of urban population in total population was 55%, a value placing Romania much below the European Union average (37%).
The female urban population records a higher share in total population (56.1%) than the national average (55.1%). The towns with a population between 10.000-19.999 inhabitants hold 31.2% of the total, and these are followed by the ones with a population between 5000 and 9000 inhabitant with about 30.6% of the total. In relation to the total number of inhabitants, the situation is changed in favour of towns with a population between 200.000 and 1.000.000 inhabitants which hold 23.2% of the total, and they are followed by those with over 1.000.000 inhabitants which represent about 16.5% (Figure 2).
Figure 2: Situation of urban cities in Romania, 2010 (no. of cities, no. of inhabitant. % of the total)
Source: Own computations, see Annex 4.
Figure 3: Urban and total population by age, 2010 (% in total urban population)
Source: Own computations, see Annex 5.
Due to the employment opportunities in these areas, the activity rate recorded at urban level was about 63.1% (in the year 2010), on slight increase as compared with the year 2005 (60.3%). At the same time, compared with the average national level, the urban activity rate is smaller for the entire analysed period (2005-2010). The same trend of increase is registered also by the employment rate at urban level: from 55% in the year 2005 to 57.3% in the year 2010. Also, the urban employment rate is smaller as compared with the national average.
At national level there is a strong concentration of some economic processes (especially, the investment one) in Bucharest and the large towns in the western part of the country (Timisoara, Arad, Oradea, Satu Mare, Cluj-Napoca, Sibiu), the role of geographic location being on increase.
Also, there is a strong concentration for innovation and of attractive industrial enterprises (Galati, Ploiesti, Pitesti, and Craiova). As an effect of this process there also is a strong differentiation within the national urban hierarchy due to high development of Bucharest and of the large towns. The large urban centres (especially Bucharest, Timisoara, Cluj-Napoca, Ploiesti, Bacau), which have a developed services sector, are placed on a favourable position as compared with those having industrial economies.
underwent a significant decrease as an effect, mainly, of migration. In this period, the highest decline (about 20%) was registered by the small and medium towns specialised in a single sector, in particular, mining industry (Fagaras – chemical industry, Cugir – defence industry, Orsova – machine industry, Sinaia – machine industry, Predeal, Anina, Uricani, Balan – mining industry).
Due to the existence of some strongly affected economic sectors due to the global financial crisis (constructions, trade, some services), the unemployment at urban level recorded, in the last period, an increase (from 8.1% in 2005, to 9.7% in 2010), the value of the rate being superior to the national average (Annex 6).
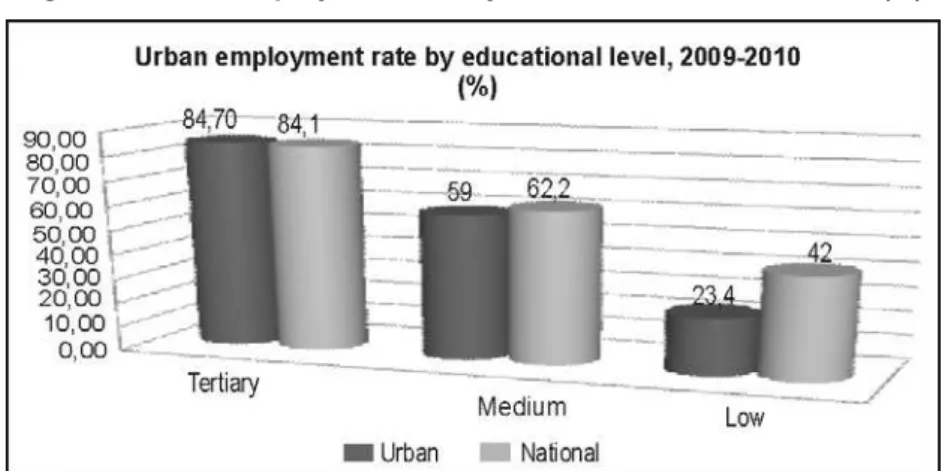
The share of employed population with superior educational levels (84.7%) is close to the national average level (84.10%), while employed population with an average training level has an inferior share weight in the national average. Within urban areas, employed population with a low level of training represents only 23.4% of the total, much below the national average (Figure 4).
Figure 4: Urban employment rate by eductional level, 2009-2010 (%)
Source: Own computations, see Annexe 6.
3. Urban development regions
The statistical regions, or planning regions created in the year 19981 generated premises for a balanced development at territorial level. From the viewpoint of urban development, these regions represent the implementation basis for actions
and policies supporting towns regarded as growth poles and financed from Structural Funds (Table 1):
Table 1: Development regions in Romania
Regions County Cities – Growth poles
RO11 North -West Bihor, Bistri a-N s ud, Cluj, Maramu-reş, S laj, Satu-Mare
Cluj-Napoca
RO12 Center Alba, Sibiu, Braşov, Covasna, Harghita, Mureş
Braşov
RO21 North-East Bac u, Botoşani, Iaşi, Neam , Suceava, Vaslui
Iaşi
RO22 South-East Br ila, Buz u, Constan a, Gala i, Tulcea, Vrancea
Constan a
RO31 South-Muntenia Argeş, C l raşi, Dâmbovi a, Giurgiu, Ialomi a, Prahova Teleorman
Prahova
RO32 Bucharest-Ilfov Municipiul Bucureşti, jude ul Ilfov Bucharest RO41 South-West Oltenia Dolj, Gorj, Mehedin i, Olt, Vâlcea Craiova RO42 West Arad, Caraş-Severin, Hunedoara, Timiş Timişoara
Source: Eurostat.
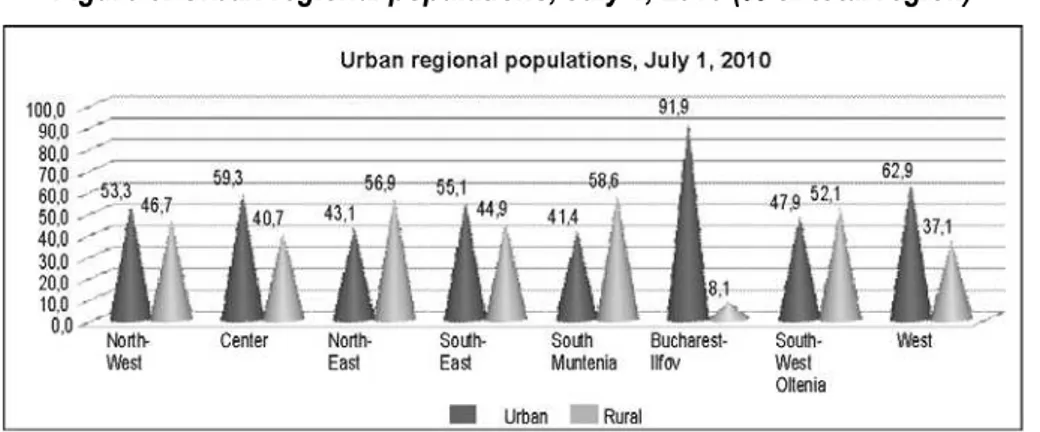
As regards to the situation of urban population in the eight development regions, also here the discussions could be around the presence of some important discrepancies, such as:
9 The distribution of towns by development regions indicates a more numerous concentration of the latter in the Centre region, a region covering a large part of the historical province of Transylvania (a province with an old and well-structured urban network) and South (where most counties are – seven). It can be said that the territorial distribution is relatively balanced with respect to large towns inside the country.
9 The second urbanised region of the country is the West region, with a share of the urban population of 63%, followed by the Centre region with a share of about 59.93%;
9 The third place is held by the South-East region with an urban population of 55.08%;
9 The four regions presented above have a share of urban population higher than to the national average of 55.07;
9 Of the eight development regions, five are urban (population over 50% in urban centres) and three agricultural regions (South-West, North-East and South-Muntenia) (Figure 5).
Figure 5: Urban regional populations, July 1, 2010 (% of total region)
Source: Own computations, see Annexe 7.
The North-East development region consisting of the counties of Bacau, Botosani, Iasi, Neamt, Suceava, Vaslui is regarded as an agricultural region (urban population account for 43.15%). The main towns are: Iasi (university centre), Bacau (industrial and university centre), Suceava, Piatra-Neamt (industrial towns), Botosani and Vaslui (textile industry, trade, agriculture).
problems (population ageing, increase in infantile mortality, etc.), problems triggered by low quality infrastructure (outdated roads, hospitals with endowments under the community standards, decrease in subscriptions to radio and TV), weak employment of minimally trained labour force, high unemployment, etc. These negative phenomena affect both urban and rural areas.
Figure 6: Internal migration determined by change in permanent residence, at urban/regional level , 2010 (balance, no. of persons)
Source: Own computations, see Annexe 8.
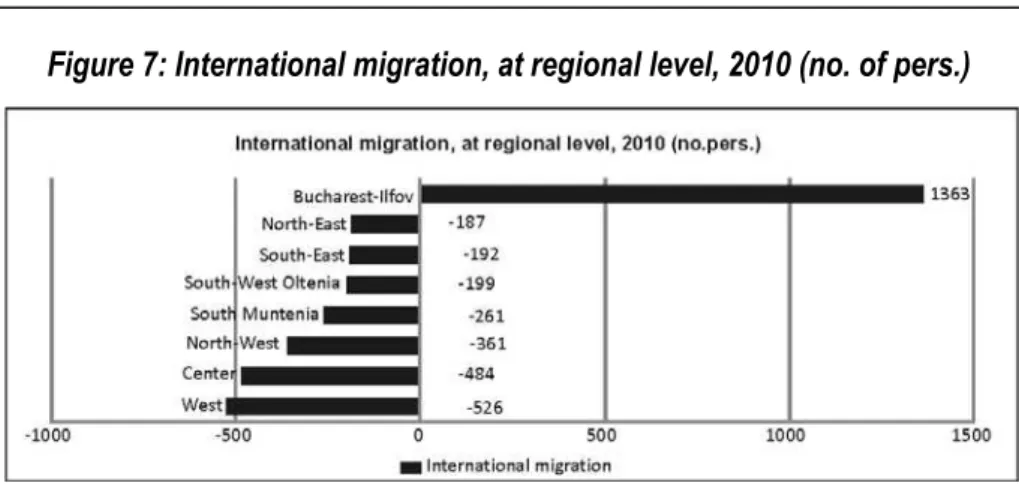
Figure 7: International migration, at regional level, 2010 (no. of pers.)
Source: Own computations, see Annexe 9.
Among the towns of the South-West region there are important historical and economic relations, which contributed to the cohesion of the regional urban system. Thus, the northern part is specialised in mining and oil industry, while the south part is predominantly agricultural, complementing the economy of the northern region.
The South-Muntenia region is represented by the counties of Argeş, C l raşi, Dâmbovi a, Giurgiu, Ialomi a, Prahova, Teleorman, the urban population amounting, in 2010, to 41.44% (the lowest at national level), on decrease as compared with the year 2005, when it was of 41.70%.
The northern part of the region (counties of Argeş, Dâmbovi a and Prahova) shows a strong industrialisation degree, Prahova ranking first in the country with respect to industrial production. In this area, the decline of industrial units generated the decline of the urban areas, triggering further a high unemployment rate. The winding-up of large industrial centres caused some severe economic and social problems, mainly in the mono-industrial urban areas (Mizil, Moreni, Plopeni, Urla i, Costeşti and Câmpulung-Muscel).
The south of the region (counties of C l raşi, Giurgiu, Ialomi a and Teleorman) is traditionally regarded as underdeveloped, being the second largest poverty pocket in Romania (the second pole being in the north-east region). This area is characterised by the preponderance of the population employed in agriculture.
urbanisation degree in the South-East Region, followed by Braila and Galati, while the county of Vrancea has the lowest urbanisation degree.
The region is the third in the national top of indicators of internal migration balance with changes of the permanent residence and international migration.
The towns from the South-East Region are facing a several common problems determined by the quality of air, intense traffic, increased noise levels, low-quality construction, abandoned lands, greenhouse gas emissions, non-systematised areas, waste and used water generation which are improperly managed. Other general issues:
• Increase in the use of resources per capita • Increase in number of individual households • Demographic changes
• In the number of private vehicles
Urban expansion in the region leads to the development of transports with impact on the environment, affecting agricultural lands, deterioration of renewable resources, affecting the landscape and, by and large, a change in the lifestyle, etc.
The Bucharest-Ilfov region isthe largest urban centre of the country concentrating a large urban population (91.7%). The regional urban system Bucharest-Ilfov is a mono-centric one, polarising around towns such as Ploieşti (county of Prahova), Buzau (county of Buzau), Pitesti (county of Arges), Ramnicu-Valcea (county of Valcea), Targovişte (county of Dambovita), Alexandria (county of Teleorman) and Slobozia (county of Ialomi a). Also,City of Bucharest polarises directly towns from counties of Ilfov, Giurgiu and Calarasi, but also other towns close by (for instance, Videle, Urziceni, Titu). Bucharest has a strong influence on the county of Ilfov, but also on the counties placed in the first neighbouring ring.
The concentration of the population in periphery districts, the expansion of the residential area by mono-family constructions (villas) make more frequent and acute the lack and insufficiency of investments in modernising the transportation network, of the water supply, sewage, heating one and, in general, in all types of urban services.
county of Hunedoara has the highest urbanisation degree in the country, save for the capital of the country, 76.9% urban population. Also, the West region has the highest international migration and holds the last but one position with respect to the migratory balance of residence change.
The North-West region is represented by the counties of Satu-Mare, Maramures, Bihor, Cluj-Napoca, Bistrita-Nasaud, Salaj. The urbanisation degree of the region is 53.3% (under the national average). The urban areas are characterised by concentration of residential areas, around historical centres, but also by the emergence of new districts placed on the periphery. The industrial areas are localited, as a rule, on the periphery. The most important towns are Cluj-Napoca, Baia-Mare, Oradea, Zalau, Satu-Mare and Bistrita – as they are both regional economic development poles and towns with cultural and historical patrimony of particular relevance.
The Center Region is represented by the counties of Alba, Sibiu, Brasov, Covasna, Harghita, Mures, with an urbanisation degree of 59.3%. With respect to the urbanisation degree of the region’s counties, a more marked development can be noticed for the towns in the counties of Brasov and Sibiu. Below the regional average, but close to it are the counties of Alba and Mures. The counties with more than half of population in the rural area are: Harghita, Mures and Covasna. According to a study about the relationship between rural development and region’s urbanisation, the conclusion was that, at county level, the higher the urbanisation, the more developed villages are, the best situation being found in the counties of Brasov and Sibiu, at a similar development level being also the villages from the counties of Harghita and Covasna, due to a strong development of crafts traditions even though the urbanisation degree of these counties is lower.
4. Urban regional disparities
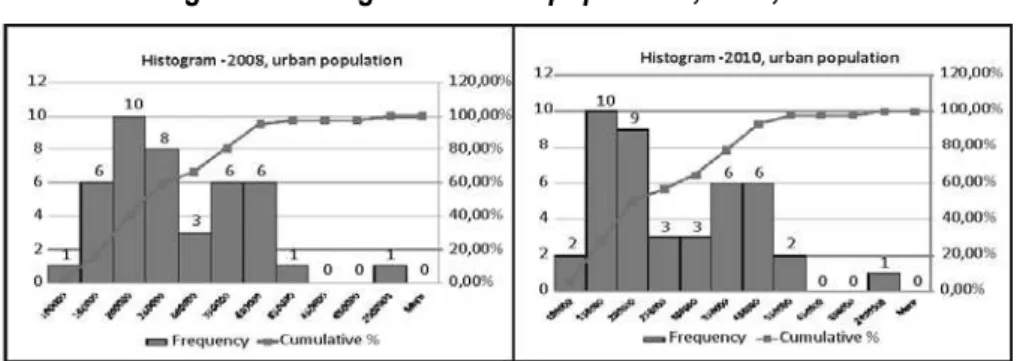
After 2007, there was a process of deepening regional disparities (between regions, but, especially, within regions). Increasing disparities are noticed between urban areas and rural ones within the eight development regions. Analysing the existing data at the level of urban areas, at regional level, with the assistance of the Histogram (one of the most employed analysis techniques for territorial series), the following trends were identified:
counties with an urban population up to 250.000 inhabitants.; 12 counties have an urban population comprised between 350.000-450.000 inhabitants, a single county with a population up to 550.000 inhabitants and a county with a population of approximately 2.000.000 inhabitants;
• In the year 2010, a slight growth trend can be found in the share of large towns (up to 250.000 inhabitants) and very large ones (up to 550.000 inhabitants); • There is a trend of increased disparities in the volume of urban area
population (Figure 8).
Figure 8: Histogram – Urban population, 2008, 2010
Source: Own computations, see Annexe 9.
At regional level we can see a catching-up of the towns from the viewpoint of population size, but also a numerical increase in urban areas of large sizes (Figure 9).
Figure 9: Histogram – Urban regional populations, 2008, 2010 (%)
5. Present difficulties facing urban areas
If before 1990 the urban problems were triggered by forced industrialisation, by the migratory flow (from rural to urban) and by the creation of artificial mono-industrial structures (around a single urban centre), after 1990, the main problems of the urban areas were generated by the long transition period to the market economy (which is not yet regarded as closed).
An important stage which marked the development of urban areas was the integration into the European Union (the year 2007), followed immediately by the emergence of the global financial crisis, which made this process harder (the end of 2008).
The urban areas face certain difficulties resulting from the following aspects: • pressure originating in external processes: EU integration, globalisation,
crisis, increasing importance of the knowledge-based economy, heigher competition between regions, international migration;
• pressures resulting from transition-related processes, decentralisation, regionalisation policies, imbalances and social and economic distortions, competition between towns, environmental issues;
• imbalances on the land market – (the demand for locations exceeds the supply, while the surrounding localities record a low level of land demand). On the other hand, the lands around large towns are used for polluting services (waste storage, filtering stations, etc.) which decrease the attractiveness and affects the land market;
• imbalances in the economic development of the town – the central area shows prosperous economic activities, while on the periphery or in the neighbourhood unemployment is high, which triggers migration;
• low accessibility and inadequate endowment;
• low quality of services provided in some urban centres (in general, the urban attractiveness is based on the quality and diversity of provided services); • diminution in the living standard: local communities are deeply affected by
economic changes; they are directly reflected in low birth rates, unemployment phenomena, increase in criminality, disregard of local values, decrease in availability for entrepreneurship and initiative, etc. ;
6. Opportunities for urban development
The accession of Romania to the European Union led, on one hand, to integration effects and, on the other hand, to the materialisation of some favourable premises for development and opportunities for diminishing the effects of the current crisis.
The allotment from Structural Funds to urban development made by the Regional Operational Programme (Regio) are opportunities for supporting and turnaround of these areas. By the Regio the balanced and sustainable development of all regions, in accordance with their potential (needs, specific resources) is pursued by:
− focus on the urban growth poles; − improving infrastructure;
− sustaining the business environment.
For supporting the urban areas financial resources are allocated from several sources, mainly the one allotted from structural funds within the cohesion policy. The total value allocated by Regio (2007-2013) is 4.568 billion €, of which 81.56% from the European Regional Development Fund (ERDF), 12.79% from the state budget, to which an estimative contribution of 1.61% from the local budgets is added and 4% on behalf of the private sector. The towns are supported - urban growth poles – by financing the Integrated Development Plans drawn up by local public authorities, in partnership and with important regional impact.
By means of the integrated urban development plan individual projects identified in the urban action area are implemented which faces certain development problems and covers a well-defined area with a population of minimum 10.000 inhabitants.
Table 2: Orientation financial allocation corresponding to sustainable urban development within Regio is as follows (period 2007-2013) (mil. euro)1:
Development regions North- East South - East South South- West West North- West Cent er Bucharest- Ilfov Total financial allocation2:
227,04 184,33 197,96 194,90 143,85 168,19 151,64 123,26
ERDF + National buget
222,50 180,64 194,00 191,01 140,97 164,83 148,61 120,79
Source: www.fonduri-structurale.ro.
The individual projects carried out within the integrated urban development plans pursue: (1) rehabilitation of the urban infrastructure and improvement of urban services, including urban transports (urban public infrastructure, transport, population mobility, and world, national and local cultural patrimony from the urban area), (2) sustainable development of the business environment and (3) rehabilitation of the social infrastructure.
Within this major intervention field there are three sub-fields depending on the type of beneficiary of non-reimbursable financing, such us:
• growth poles, represented by seven large urban centres (Iasi, Constanta, Ploiesti, Craiova, Timisoara, Cluj-Napoca and Brasov) and their areas of influence;
• urban development poles represented by the municipalities of Arad, Baia Mare, Bacau, Braila, Galati, Deva, Oradea, Pitesti, Ramnicu-Valcea, Satu Mare, Sibiu, Suceava, Targu-Mures.
The growth and urban development poles were determined by Governmental Resolution no. 998/2008 for establishing the national growth poles. Therefore priority investments are made from community and national financing programmes, with subsequent changes and amendments. The urban centres are towns/municipalities with over 10.000 inhabitants, other than the growth poles and the urban development poles.
Total allotment of public funds (community and national) by Regio for urban development is 1.391.171 million Euros, of which 1.117.806 million Euros by ERDF and 273.365 million Euros as national co-financing, which represents
1 According to the Resolution CMPOR no.5/16.08.2007, available at http://www.inforegio.ro. 2 This allocation includes the EU contribution by ERDF, the national contribution from
31.74% of the total amount allotted within Regio 2007-2013. The share in Romanian total GDP of the amounts for urban development range from 0349% to 1.720% (Table 3).
Tabel 2: Total allotment
EFDR + state budget (mil.euro)
GDP (mil.lei)
GDP (mil.euro)
% in total allotment
Nord-East 227.04 54940.9 14848.9 1.529
South- East 184.33 55865.9 15098.9 1.221
South 197.96 65451.8 17689.7 1.119
South-West 19.,9 41921.9 11330.2 1.720
West 143.85 50020.5 13519.1 1.064
North-West 168.19 57937.1 15658.7 1.074
Centre 151.64 57586.8 15564.0 0.974
Bucharest-Ilfov 123.26 130521.7 35276,1 0,349
Total 1391.17 514246.6 138985,6 1,001
Source: www.fonduri-structurale.ro.
Although, as a whole, the financial allocation for sustainable development of towns related to total GDP (year 2008) is relatively low (about 1%), it can be regarded as a development opportunity in the current period.
With respect to financing by development regions, it can be seen that the regions with the lowest share inurban population – the South region – takes the second place with respect to allocation intended for urban projects (Table 4).
Table 3: Regions’ position after financial allocations from Regio in 2010
Regions \Ranking by Regio allocation for urban areas
Ranking by urban population
Ranking by total GDP
South 4 8 2
North-East 2 7 6
South-West 1 5 8
North-West 5 5 3
South-East 3 4 5
Centre 7 3 4
West 6 2 7
Bucharest-Ilfov 8 1 1
Even with this urban development opportunity, the interest granted is relatively low (the absorption degree is the lowest as compared with the other Regio fields). From performed evaluations up to date on the low absorption level of funds for urban development it resulted that the projects to be submitted are very complex and difficult to implement from technical, financial, etc. viewpoint.
7. Conclusions
In conclusion, we may say that the development and trends recorded in the urban development process in Romania were closely linked with the development of the society as a whole. In the analysed period, the urbanisation degree increased at a high rate, even forced, especially before 2002. Nevertheless, it remains inferior to the EU average. The size of urban settlements developed from small towns to large-sized ones, with remarkable differences between the capital city of Bucharest and the other urban centres.
After the year 2002, the urbanisation process in Romania presents the following trends:
• after a period of important growth in urban population, a stagnation with diminishing trends is found;
• from the viewpoint of town size (depending on the number of inhabitants), there is a trend of increased significance for large and very large towns (regarded from the viewpoint of regional development, growth poles);
• increase in the activity rate and of the employment rate at the level of urban areas (2008-2010);
• existence of an urban population at tertiary training level;
• increase in the urban- rural migration process as result of ownership reverting of in the last year, due to job loss;
• unemployment increase in some towns;
• increase in international migration, in particular from the urban areas of the western part of the country;
• low interest in obtaining financial advantages as a result of integration and allocated for urban development.
historical province of Transylvania (province with an old and well-structured urban network) and south (the most counties – seven). It can be stated that there is a relatively balanced territorial distribution of large towns in the country.
The opportunities created by the new status as an EU member-state and the absorption of some funds for urban development (integrated, polarised, sustainable, etc.) could contribute to towns’ recovery and to obtaining the status of economic growth drivers.
8. Annexes
Annex 1: Evolution of urban population
Inhabitants As percentage of total
Urban Rural Urban Rural
1 July 1960 5912011 12491403 32.1 67.9
15 March 1966 1) 7305714 11797449 38.2 61.8
1 July 1970 7464811 12787730 36.9 63.1
5 January 1977 1) 9395729 12164181 43.6 56.4
1 July 1980 10171618 12029769 45.8 54.2
1 July 1990 12608844 10597876 54.3 45.7
1 July 1991 12552407 10632677 54.1 45.9
7 January 1992 1) 12391819 10418216 54.3 45.7
1 July 1993 12406204 10349056 54.5 45.5
1 July 1997 12404690 10141235 55.0 45.0
1 July 1998 12347886 10154917 54.9 45.1
1 July 1999 12302729 10155293 54.8 45.2
1 July 2000 12244598 10190607 54.6 45.4
1 July 2001 12243748 10164645 54.6 45.4
18 martie 2002 1) 11435080 10245894 52.7 47.3
1 July 2002 11608735 10186058 53.3 46.7
1 July 2004 11895598 9777730 54.9 45.1
1 July 2005 11879897 9743952 54.9 45.1
1 July 2006 11913938 9670427 55.2 44.8
1 July 2007 11877659 9659904 55.1 44.9
1 July 2008 11835328 9669114 55.0 45.0
1 July 2009 11823516 9646443 55.1 44.9
1 July 2010 11798735 9632563 55.1 44.9
Annex 2: Evolution of town and municiplity dimension (no., inhab., % in total)
2008 2010
Total %
in total Inhab. %
in total Total %
in total Inhab. % of total Total 320) 100,0 11835328 100, 0 320 100 11798735 100
Sub / under 3000 6 1.9 15222 0.1 6 1.9 14889 0.1 3000 - 4999 15 4.7 62925 0.5 15 4.7 62039 0.5 5000 - 9999 98 30.6 720660 6.1 98 30.6 719245 6.1 10000 - 19999 100 31.2 1364106 11.5 100 31.2 1363471 11.6 20000 - 49999 57 17.8 1781052 15.1 57 17.8 1774336 15 50000 - 99999 20 6.3 1457895 12.3 20 6.3 1454523 12.3 100000 - 199999 13 4.1 1738331 14.7 13 4.1 1731751 14.7 200000 - 999999 10 3.1 2751156 23.3 10 3.1 2736227 23.2 1000000 şi peste /
and over 1 0.3 1943981 16.4 1 0.3 1942254 16.5
Source: Statistical Yearbook, 2011, NSI, Bucharest.
Annex 3. The main cities in Romania and their populations – year 2010
County City Population in city Population in county % of total county
BUCUREŞTI 1) Bucureşti 1942254 - -
TIMIŞ Timişoara 311428 679695 45.82
IAŞI Iaşi 309631 825773 37.50
CLUJ Cluj-Napoca 305636 691048 44.23 CONSTAN A Constan a 301221 723796 41.62
DOLJ Craiova 298740 702124 42.55
GALA I Gala i 290593 608904 47.72 BRAŞOV Braşov 276914 598313 46.28 PRAHOVA Ploieşti) 227194 812844 27.95
BR ILA Br ila 210245 357614 58.79
BIHOR Oradea 204625 592561 34.53
BAC U Bac u 175546 714641 24,56
ARGEŞ Piteşti 166594 639157 26.06
ARAD Arad 164665 454922 36.20
SIBIU Sibiu 154220 425322 36.26
MUREŞ Târgu Mureş 143939 580228 24.81 MARAMUREŞ Baia Mareş 138182 510482 27.07
BUZ U Buz u 131377 480222 27.36
County City Population in city
Population in county
% of total county
GORJ Târgu Jiu 96396 376179 25.63
TULCEA Tulcea 90553 245899 36.83
DÂMBOVI A Târgovişte 88119 529781 16.63 BISTRI A-N S UD Bistri a 84848 317247 26.75 CARAŞ-SEVERIN Reşi a 82458 320840 25.70
OLT Slatina 77108 462734 16.66
C L RAŞI C l raşi 73005 311898 23.41
VASLUI Vaslui 69880 449524 15.55
ALBA Alba Iulia 68570 372265 18.42 GIURGIU Giurgiu 67510 280125 24.10
HUNEDOARA Deva 66178 461450 14.34
S LAJ Zal u 64035 241014 26.57
COVASNA Sfântu Gheorghe 61341 222434 27.58 IALOMI A Slobozia 51778 286980 18.04 TELEORMAN Alexandria 49259 397990 12.38 HARGHITA Miercurea Ciuc 41410 324890 12.75
ILFOV Bragadiru 10464 321007 3.26
Source: Statistical Yearbook, 2011, NSI, Bucharest.
Annex 4: Urban and total population by age, 2010 (no. of inhab., % of total urban population)
Total % in total Urban % of total
Total 21431298 100.00 11798735 100.00
0-4 1082649 5.05 590270 5.00
5-9 1051871 4.91 515730 4.37
10-14 1106775 5.16 510461 4.33
15-19 1207215 5.63 607622 5.15
20-24 1721709 8.03 1003129 8.50
25-29 1611264 7.52 977441 8.28
30-34 1773161 8.27 1049088 8.89
35-39 1663454 7.76 927324 7.86
40-44 1738891 8.11 1024976 8.69
45-49 1212937 5.66 738144 6.26
50-54 1473751 6.88 928797 7.87
55-59 1435134 6.70 880068 7.46
60-64 1157613 5.40 626669 5.31
65-69 877712 4.10 421006 3.57
70-74 932912 4.35 415770 3.52
75-79 708422 3.31 297495 2.52
80-84 441175 2.06 184437 1.56
85 and over 234653 1.09 100308 0.85
Annex 5: Urban population by participation in economic activity, 2005-2010
2005 2006 2007 2008 2009 2010
thou. persons
Economically active population
Total 9851 10041 9994 9944 9924 9965
Urban 5361 5595 5494 5471 5475 5538
Rural 4490 4446 4500 4473 4449 4427
Employment
Total 9147 9313 9353 9369 9243 9240
Urban 4889 5115 5072 5101 5032 5032
Rural 4258 4198 4281 4268 4211 4208
ILOunemployed
Total 704 728 641 575 681 725
Urban 472 480 422 370 443 506
Rural 232 248 219 205 238 219
percentage
Activity rate
Total 62.4 63.7 63.0 62.9 63.1 63.6
Urban 60.3 62.6 61.6 61.7 62.1 63.1
Rural 65.3 65.2 65.1 64.5 64.6 64.4
Employment rate
Total 57.7 58.8 58.8 59.0 58.6 58.8
Urban 55.0 57.2 56.8 57.5 57.1 57.3
Rural 61.6 61.1 61.5 61.2 60.7 60.9
ILOunemployment rate
Total 7.2 7.3 6.4 5.8 6.9 7.3
Urban 8.8 8.6 7.7 6.8 8.1 9.1
Rural 5.2 5.6 4.9 4.6 5.4 5.0
Source: Statistical Yearbook, 2011, NSI, Bucharest.
Annex 6: Urban employment rate by educational level, 2009-2010 (%)
2009 2010 Total Tertiary Medium Low Total Tertiary Medium Low
Activity rate
Total 63.1 88.0 67.1 46.1 63.6 87.1 67.9 46.3 By sex
Male 70.9 89.1 74.4 55.5 71.5 88.3 75.5 55.5
Female 55.4 86.9 59.0 38.6 55.8 85.9 59.4 38.8
By area
Urban 62.1 88.4 64.4 28.7 63.1 87.7 65.4 28.6
2009 2010 Total Tertiary Medium Low Total Tertiary Medium Low
Employment rate
Total 58.6 84.1 62.2 42.0 58.8 82.4 62.2 43.0 By sex
Male 65.2 85.2 68.7 49.1 65.7 83.6 69.1 50.5
Female 52.0 83.1 55.0 36.3 52.0 81.2 54.6 36.9
By area
Urban 57.1 84.7 59.0 23.4 57.3 83.1 59.1 23.7
Rural 60.7 78.6 68.0 52.0 60.9 76.6 68.0 52.7
ILOunemployment rate
Total 6.9 4.3 7.2 7.5 7.3 5.4 8.3 6.1 By sex
Male 7.7 4.3 7.6 9.9 7.9 5.3 8.4 8.0
Female 5.8 4.3 6.8 4.8 6.5 5.4 8.1 4.1
By area
Urban 8.1 4.2 8.3 18.0 9.1 5.3 9.7 16.7
Rural 5.4 5.8 5.6 5.0 5.0 5.9 6.0 3.8
Source: Statistical Yearbook, 2011, NSI, Bucharest.
Annex 7. Population, at territorial level, by area, on July 1, 2010
Regions Urban Rural Inhabitants / km2
North-West 53.3 46.7 79.5
Center 59.3 40.7 74.0
North-East 43.1 56.9 100.6
South-East 55.1 44.9 78.5
South Muntenia 41.4 58.6 94.6
Bucharest-Ilfov 91.9 8.1 1242.9
South-West Oltenia 47.9 52.1 76.6
West 62.9 37.1 59.8
Source: Statistical Yearbook, 2011, NSI, Bucharest.
Annex 8. Internal migration determined by change of permanent residence, at territorial level
Annex 9. International migration, at territorial level and by sex, in 2010
Immigrants Emigrants Net international
migration Development
region
Total Male Female Total Male Female Total Male Female
TOTAL 7059 4242 2817 7906 2917 4989 -847 1325 -2172
North-West 631 389 242 992 375 617 -361 14 -375 Center 679 392 287 1163 397 766 -484 -5 -479 North-East 1115 650 465 1302 492 810 -187 158 -345 South-East 638 393 245 830 315 515 -192 78 -270 South
Muntenia 341 215 126 602 213 389 -261 2 -263 Bucharest-
Ilfov 2819 1703 1116 1456 574 882 1363 1129 234 South-West
Oltenia 250 153 97 449 148 301 -199 5 -204 West 586 347 239 1112 403 709 -526 -56 -470 Source: Statistical Yearbook, 2011, NSI, Bucharest.
References
1. Allen G. Noble, “Regional Development and Planning for the 21st Century”, New Priorities, New Philosophies.
2. Antonescu D., (2011), Dezvoltarea regional – tendinţe, mecanisme, instituţii , Editura Top Form.
3. Antonescu D., (2011), ″Nouvelles perspectives theoretizues du developpment economique au niveau regional″ (publicat în cadrul bursei post-doctorale), in Éléments de planification
territoriale et développement régional, Cordinateurs: prof. Ioan Ianos, Editura Universitar
(pag. 29-51), ISBN 978-606-591-4.
4. Bairoch, Paul (1988) Cities and Economic Development: From the Dawn of History to the
Present. University of Chicago Press, Chicago.
5. Jozsef B. (2006), “Urban policy and urbanisation in the transition Romania”, http://rrrs.reviste.ubbcluj.ro/arhive/Artpdf/v2n12006/RRRS021200605.pdf.
6. Black, D. and J. V. Henderson (1999b), “A Theory of Urban Growth”, Journal of Political
Economy.
7. Beaujeau-Garnier Jaqueline, Chabot G., 1963, Geografie Urbana, Paris.
8. Cucu V., Candea Melinda, Erdeli G., 1977, “Unele aspecte privind structura teritorial a oraşelor”, Analele Universitatii din Bucuresti, tom XXVI, Bucuresti.
10. Henderson, V. (2002) “Urbanisation in developing countries”, The World Bank Research
Observer.
11. Ianoş I. (2005), Urban Dynamics. Applications on the City and the Romanian Urban System,
Ed. Tehnic , Bucharest, 213 p. (in Romanian with English summary).
12. Ianoş I., Heller W. (2006), Space, Economy and Settlement Systems, Ed. Tehnic , Bucharest, 373 p. (in Romanian with English summary).
13. Oachesu S., “Regional Urban Systems as Functional Regions”, Doctoral School “Simion Mehedinti” Doctoral School - University of Bucharest.
14. Venables, A.J. (2005), “Spatial disparities in developing countries: Cities, regions, and international trade”, Journal of Economic Geography .
15. S geat R., Simileanu V. (2007), “Political-Administrative Decisions, a Pressure Factor for Entrepreneurial Initiatives”, Geographica Timisiensis, vol. XVI, no. 1-2, Timişoara, p. 95-104. 16. S geat R. (2008), Bucharest. Geographical and Geopolitical Considerations, “Revista
Român de Geografie Politic ”, vol. X, no. 1, Oradea, p. 37-56.
17. Uniunea European , “Politica regional – o abordare integrat ”, Panorama Inforegio nr.34, www.ec.europa.eu.
18. Agenda Teritorial a Uniunii Europene 2020. “Spre o Europ inteligent , durabil şi favorabil incluziunii, compus din regiuni diverse”, http://www.mdrt.ro, 2011.
19. ***”Urban Development in Europe, A Survey of National Approaches to Urban Policy in 15 EU Member States, European Urban Knowledge Network”, 2010, www.eukn.org.
20. European Commission, “Promoting Sustainable Urban Development in Europe”, www.ec.europa.eu, 2009.