URBAN DYNAMIC ANALYSIS USING SATELLITE IMAGES AND MULTISOURCE DATA. CASE OF GRAND AGADIR-MOROCCO – BETWEEN 1988 AND 2005
ATIK MOHAMED1, ABDELLAOUI ABDELKADER2
The earthquake of 1960 marked a turning point in the urbanization process of Grand Agadir. Agadir`s reconstruction was launched a few months after the city’s destruction. It was based on a desire to create a new town on a green field in a voluntarily attempt to adopt a modernist model of urbanism. But the following years showed that urban planning in the Grand Agadir faces more a crisis management than an expression of competence. Many issues depend on the urban planning of Grand Agadir. Several actors (including speculators) are involved in developing strategies and very different logics. Although all means of resources (land ownership, financial and human) were mobilized to produce a model city, the mismanagement, the lack of control in urbanization, the difficulty of controlling urban development and the influx of people, coming from the rural exodus and attracted by the advantages of a sedentary life, have determined profound changes in the spatial distribution of inhabitants. This study consists in identifying the spatio-temporal dynamics of the urban space in Grand Agadir; this is a diachronic study which integrates the classification method of maximum likelihood. It aims to monitor the urban dynamics of Grand Agadir and the change detection in order to estimate the socio-spatial mutations. For this we used the satellite imagery “Landsat-TM and ETM” over the period 1988-2005 which was complemented with the cartographic materials and aerial photos. This processing allowed us to produce maps that illustrate the spatial distribution of urban development forms and to show the impact of urban sprawl.
Keywords: urban management; remote sensing; diachronic study.
Introduction
The urban development of Grand Agadir is unique within the region because it is an entirely new city which has just completed its stages of reconstruction after the earthquake of 1960. This particular evolution in the recent decades has resulted in a rapid development of all its cities while registering the highest growth rates in Morocco; recorded at 8.13% for Aït Melloul and at 10.2% for Tikiouine during the interval 1982-1994 while the national average is 2.06% for this period.
1
Labo Cemotev University Versailles Saint-Quentin-en-Yvelines. 2
Since the ’60s of the last century, the demographic, economic, social and cultural mutations that intervened in Grand Agadir have triggered profound changes in the spatial distribution of inhabitants. Because of its position at the crossroads between North and South of Morocco, Grand Agadir underwent a major economic development, which led to a population growth that resulted not only from the natural excess, but also due to a strong immigration of both rural and urban origin.
In the perspective of city planning, the urban landscape of Agadir city reflects a deliberate policy through which the neighborhoods are differentiated by their function, morphology and also by their social composition. The specialization of neighborhoods and the spatial discontinuities are very striking. In this context, our study is based on a thematic approach and on multisource data analysis (of the demographics, the environmental potential, economic activities, urban planning, housing, infrastructure, environment) that allows us to reveal the data, which most often is either numerous or complex, through a synthetic vision and to identify the constraints and advantages of urban development. We are particularly interested in studying the constraints that are specific to urban development and their impacts using diverse thematic cartographic supports and satellite imagery.
These multi-scale materials were used to analyze the mechanisms behind urban development. We also used the satellite imagery Landsat TM and ETM on several dates along with various existing cartographic documents (aerial photographs, topographic maps); these different documents are complemented by several field observations, survey results and other data (demographic, urban and economic). This study consists in the identification and analysis of the urban development and the spatio-temporal dynamics in the Grand Agadir between 1988 and 2005. The results allowed us to provide relevant explanations beyond the standard analysis of the spatial categories “urban”-“suburban” which are too simplistic for the current spatial and social diversity. Therefore it seems essential to understand the relationships, the flows and the interconnections between these two spaces, not to mention the less tangible effects which are induced by the development actions and to analyze a number of issues and processes related to the urban extension.
This paper is structured into three main parts: after a description of the study area and the methodological approach of the satellite data processing, we presented the results and we concluded with a detailed analysis of the urban development (forms, issues, dysfunctions and impacts) in the last section.
1. Study Area
to the north by the massif of the High Atlas. Its latitude is 30 25’ north and the longitude is 9 36’ west (Fig. 1). It is part of the Souss-Massa-Draa which extends over an area of 70,880 km², or 9.9% of the total area of Morocco. This region includes the provinces of Tiznit, Taroudant, Ouarzazate and Zagora.
Grand Agadir covers an area of nearly 145 km², starting from Anza in the north to south of Aït Melloul, including Tikiouine into the east (see Fig. 1). Its structure is composed of several urban units that were promoted, over the previous decades, to the status of municipalities, thus sharing the territorial management of the urban cluster.
Fig. 1. Location map of Grand Agadir: Geographical situation
and morphology
located at 10 km south from Agadir and a municipality to which two dormitory town, Jorf and Tarrast, are attached; Dcheira and Aït Melloul representing two major municipalities, the first, located along the main road number 32, acts as a bedroom community while the second one is positioned on the left bank of wadi Souss, at the intersection of roads from Tiznit and Taroudant. These municipalities account for a total built-up area of 3,000 hectares with a total area of 20,516 hectares and concern a population of about 67,859614 inhabitants, according to the national census of 2004, with a growth rate of around 10%, since 1960. At the morphological level (Fig.1) the western High Atlas of EW direction overlooks the present town and the harbour on the north side by a vertical drop of 200 meters. Its altitude increases eastward to rise over 400 meters at Talkjount which is located above, at 6 km from the Kasba. This mountain, as a whole, takes the form of a plateau lined with an endemic vegetation cover (Ait Hssaine, 2000) which is characteristic for this region and unique in the world (argan trees and thorny euphorbias).
2. Methodology
Our work focused on a thematic approach to detect the change of urban space (Table 1).
Table 1
Data Used in the Study
Type of Data Sources Date Scale/Resolution
Satellite image Landsat TM
Landsat ETM
Feb 9th 1988 march 02 ; april 05
30 m 28.5 m ; 28.5 m
Aerial photo Holding Omran 1994
1994
1 :30,000 1 :17,500
Topo map Urban Agency of Agadir 2003 ; 2005 1 :50,000
Socio demo stat PhD thesis Atik 2009
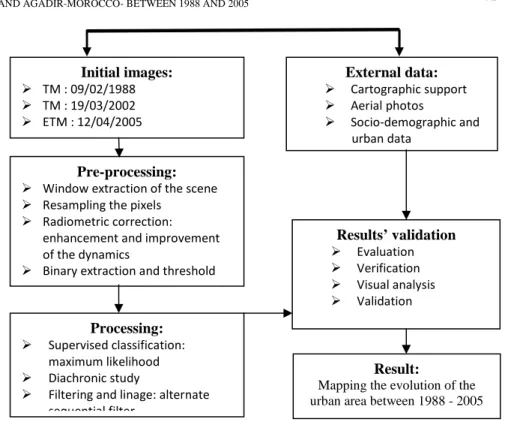
Fig. 2. Flowchart of the methodological approaches tested in the study
2.1. Pre-Processing
It is generally necessary to pre-process the data prior to analysis. The objective is to improve the images` quality in order to enable their interpreting. In this context we conducted a string of classic processing:
Resampling: In order to have a homogeneous and medium spatial
resolution of 28.5 m we used a cubic convolution technique. This sampling function, which uses a bi-cubic approximation of the 16 closest neighbours to the concerned pixel, makes the image to be locally modelled by a polynomial surface (Abdellaoui and Rougab, 1995). In the end, we obtained several spectral plans that will perfectly match at each pixel level, with the reference image (image of year 2005). The accuracy of these transformations varies with each image; in our case the operation produced an average error of calibration (Root Mean
Square Error) of 0.258, which is acceptable (Moller-Jensen, 1990). Enhancement and improvement of the dynamics: The initial image
is not very legible because of the low contrast, considering that most pixels are on a small range of coding scale (0; 255). Increasing the
Initial images:
TM : 09/02/1988 TM : 19/03/2002 ETM : 12/04/2005
Pre-processing:
Window extraction of the scene Resampling the pixels
Radiometric correction: enhancement and improvement of the dynamics
Binary extraction and threshold
External data:
Cartographic support Aerial photos
Socio-demographic and urban data
Processing:
Supervised classification: maximum likelihood Diachronic study
Filtering and linage: alternate sequential filter
Result:
Mapping the evolution of the urban area between 1988 - 2005
Results’ validation
dynamics can already make the different channels more legible and therefore it’s easier to recognize the major themes which are present on the study scene.
Extracting the study area and other basic processing: After
extracting the study area which covers the Grand Agadir and its surroundings, we have defined the area of urban influence by turning our basic images in binary images through codifying their pixels with different values: 1 for urban area and 0 for others. A threshold was performed in order to isolate the urban unit as it is very useful to exclude vegetation and water (sea and river) from urban areas so to reduce the computation time and to avoid any confusion between vegetation, open soil and the constructions.
2.2. Basic Processing
2.2.1. The classification of the urban areas
Classifying the urban areas with the help of satellite images is a complex task, because these images do not exhibit a unique and distinguishable spectral response (Weber, 2001). Many researchers have already presented methods to improve the classification of urban areas using remote sensing data. These methods, based on pixels or objects, are very diverse and vary according to the data that were used and also the study areas on which they are applied. They are also difficult to categorize because there is a mixture of methods that were created to extract information from the images. These approaches include, in the classification process, the incorporation of auxiliary information, for example, spatial data (Harris and Ventura, 1995; Zhang et al., 2002), contextual data (Gong and Howarth, 1990; Shaban and Dikshit, 2001; Weber, 2001; Gluch, 2002, Cabral et al., 2005). Other authors propose the use of indices (Abdellaoui et al. 1997; Abdellaoui, 2009, Zha et al., 2003; Biraud-Burot, 2005), the analysis of spectral composites (Phinn et al., 2002; Lu and Weng, 2004), the use of expert systems (Steranov et al., 2001) or the use of neural networks (Civco and Hurd, 1997; Zhang and Foody, 2001). Some results show that information retrieval based on objects is presented as an attractive alternative to classify images.
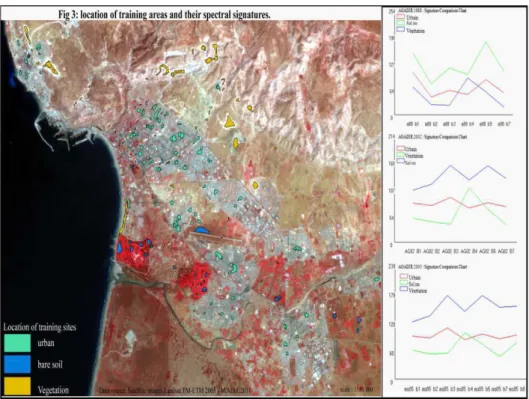
classification (Jensen, 1996). The choice for these areas may involve a certain degree of subjectivity because it is the analyst who determines the training sites and establishes their number, their location and size. To meet the normal distribution, we used for the selection of training sites, the groups obtained in the unsupervised classification with ISOCLUST algorithm. Thus it ensures the selection of homogeneous areas. These thematic classes (urban3, bare soil and vegetation) were defined in order to assess the types of land use which were affected by urban growth. Consequently, these training sites were used to obtain the spectral signatures of these classes (Fig. 3).
Fig. 3. Location of training areas and their spectral signatures
The visual analysis of the classifications for different dates has detected some indications relative to the change from built-up to un-built that doesn’t correspond to the reality of Grand Agadir. Similarly, we observed confusions between built-up and bare soils due to the approximation of the radiometric values between these two classes, the heterogeneity of urban objects and bare soil (roads, quarries, rocks), making it difficult to establish the representing
3
thematic classes. Some apparent changes were produced by the spectral overlap between classes or pixels located at the boundaries. In this sense, the road network, especially the routes which separate the islands of urban expansion, have created a lot of confusion within some pockets of built-up. For example, in the classified image of 2003, these roads have been assigned to the built-up class while in the image of 1988 they have been omitted from this class (maybe because of the vegetation effect). Other changes were produced by significant variation in the vegetation cover, in this case the differences between phenological dates. Taking into account these confusions, the rule of maximum likelihood was repeated several times in order to improve and validate the results and isolate the built-up from the un-built. The training sites were modified during iterations, so as to obtain a threshold of sufficient satisfaction (90% correct classification and a kappa coefficient which should be greater than or equal to 0.8); the selection of the channels permits the exclusion of redundant spectral information resulted from the classification process and thereby to obtain a better discrimination of the classes (Jensen, 1996- Im and Jensen, 2005). The statistic of the transformed divergence (Swain and Davis, 1978 in Jensen, 1996) was used to evaluate the best combination of channels. We obtained the maximum spectral separation using six channels simultaneously (TM1, TM 2, TM 3, TM 4, TM 5, TM 7). Then we reduced the number of channels while maintaining the maximum value of the processed divergence’s statistics in order to reduce the information’s redundancy. This maximum value has remained intact until the use of four channels with 15 different possible combinations. After trying these 15 combinations with the overall accuracy and kappa statistics, we found that it is the combination of channels (1, 4, 5 and 7) which leads to better outcomes for the urban class.
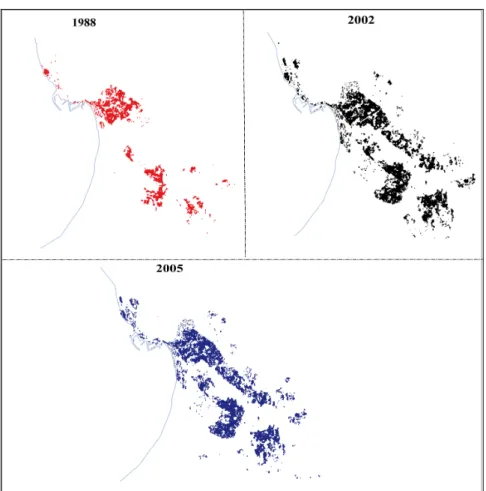
Fig. 4. The urban area in Grand Agadir between 1988 and 2005
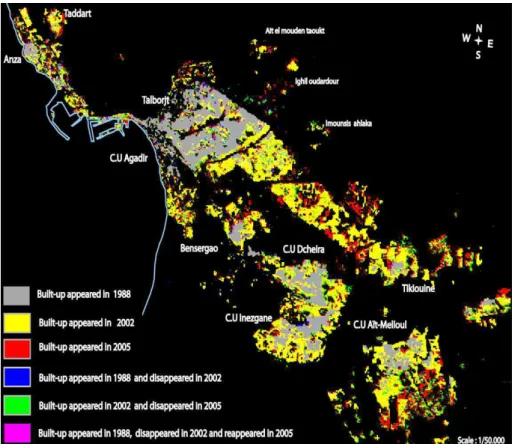
2.2.2. Colored composite image of the urban evolution
d(p) = a(p) [B] + b(p) [V] + c(p) [R]
a(p), b(p) and c(p) represent the values depending on the intensity of the pixel
for the oldest component or the most recent one
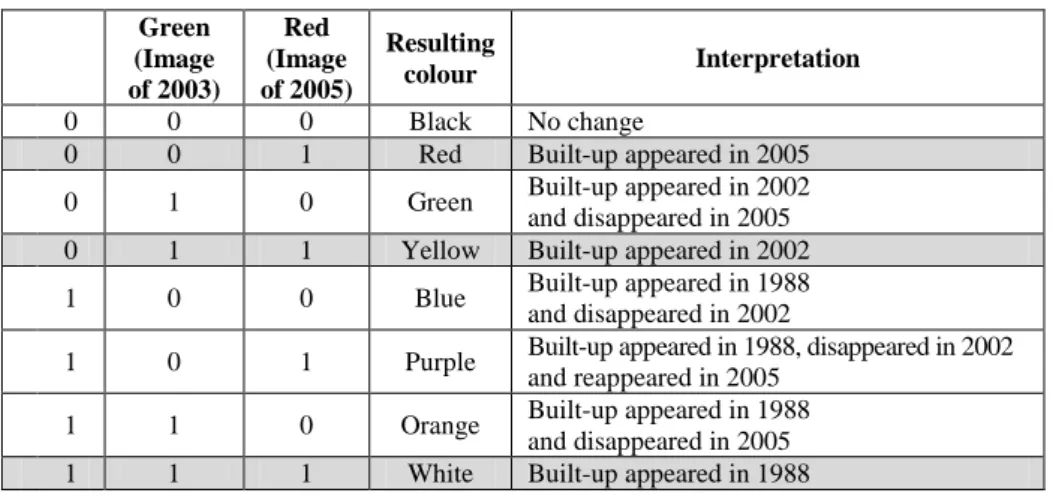
Table 2 summarizes the logic of the possible combination according to
the primary RGB colours which were assigned to each classified image and the intensity’s values of these binary images (0/1).
Table 2
The Logic of the Diachronic Coloured Composite
Green (Image of 2003)
Red (Image of 2005)
Resulting
colour Interpretation
0 0 0 Black No change
0 0 1 Red Built-up appeared in 2005
0 1 0 Green Built-up appeared in 2002
and disappeared in 2005
0 1 1 Yellow Built-up appeared in 2002
1 0 0 Blue Built-up appeared in 1988
and disappeared in 2002
1 0 1 Purple Built-up appeared in 1988, disappeared in 2002
and reappeared in 2005
1 1 0 Orange Built-up appeared in 1988
and disappeared in 2005
1 1 1 White Built-up appeared in 1988
The various processing which were performed made it possible to map the evolution of the urban area and its periphery (Fig. 5).
for the elimination of slums or for changing the form and layout of plots. It was complemented with the launching of the subdivision (the case of Hay El Mohammady subdivision), or the appearance of some buildings on the site of old demolished buildings.
Fig. 5. Chronological evolution of the urban area in Agadir between 1988 and 2005
3. Results and discussion
3.1. Grand Agadir a dispersed agglomeration
from 100,919 ha in 1988 to 206,625 ha in 2005. Between the two dates, the extensive built-up increased by 145,706 ha, representing a growth rate of 60% in 17 years. The area covered by the urban pattern which was studied for the period from 1988 to 2002 is approximately 196,105 ha and for the period from 2002 to 2005 is merely 10,520 ha. These figures were calculated from the digital processing and correspond to 90% of the official records from the Regional Inspectorate of Housing, Urban Development and Spatial Planning (IRHUAE) and of the land holding in Al Omran Souss Massa.
Urban development in Grand Agadir was achieved in a linear fashion along the thoroughfare harbour-airport on about 30 square kilometers with a total area of 159 square kilometres. It includes five urban entities (Agadir, Tikiouine, Inezgane, Dcheira and Aït-Melloul) which are autonomous and individual, of greater or lesser size and articulated relatively to each other and according to their economic and urban vocation as well as their situation along the local route, particularly along the RN 10 and RN 1. This development is determined by two important elements: first, by its physical and natural environment (blocked to the north and east by the natural barrier of the mountain and the Souss Massa National Park to the south, the agglomeration is now expanding on the plain, on each side of the wadi Souss) and secondly, by its economic and demographic dynamics. The profound changes that have occurred in the outlying communities (Tikiouine, Inezgane, Dcheira and Aït-Melloul) have also been subject to a particularly important urban growth: Tikiouine (95.15%), Aït-Melloul (85.13%) or Bensergao (70.63%). With the exception of the city of Agadir where urban development has been achieved in a planned approached (the launching of several subdivisions and an urban project), the outlying communities developed in a spectacular haphazard way.
This great economic dynamism of Agadir is the most important element that explains the demographic and urban development in recent decades. Since the general population census of 1982, the great urban centres which compose Agadir experienced the largest increase in population at the national level. Grand Agadir has seen its population growing at a very high rhythm between 1982 and 2004 from 256,234 to 678,596 inhabitants, or with an average rate of annual growth of 4.5% (while the national average was 3.2% for the same period). The population’s density was established in 2004 to 4,138 inhabitants/km2, in comparison with 3,076 inhabitants/km2 in 1994 and with 1,574 inhabitants/km2 in 1982. It grew by 35% over the past ten years, with the implications of a migration flux that was always important and the obvious attraction for this region. By consequence, Dcheira and Inezgane face the highest density (8,937 and 8,673 inhabitants/km2 respectively) because of their small size, while the municipality of Agadir is the least dense (3,360 inhabitants/km ²).
based on a strong segregation of functions which have shaped a splited space and a poorly connected city, which suffers from the lack of centrality and of attractive convivial places.
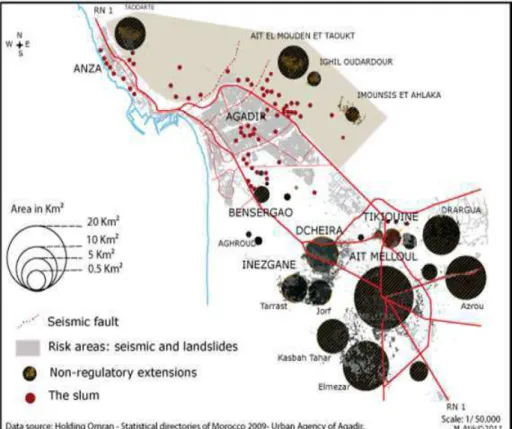
Fig. 6. The illicit urbanization in Agadir in 2004
The analysis of the spatial representation of cities according to their population growth rate between 1960 and 2004, allows us to distinguish two urban forms (Fig. 6):
•The urban built-up space: planned and managed urban area (Agadir) with a concentration of facilities, services and employment in well-defined areas in the city of Agadir at the expense of the rest of the agglomeration. The habitat’s offer is diverse (subdivision, residences).
most dynamic in its growth and redeployment forms, and the most problematic for interventions which are designed for regularization and urban integration. It infects the peripheral bedroom communities (Inezgane, Dcheira and Tikiouine) who are isolated and poorly equipped (weak equipment, inadequate infrastructure).
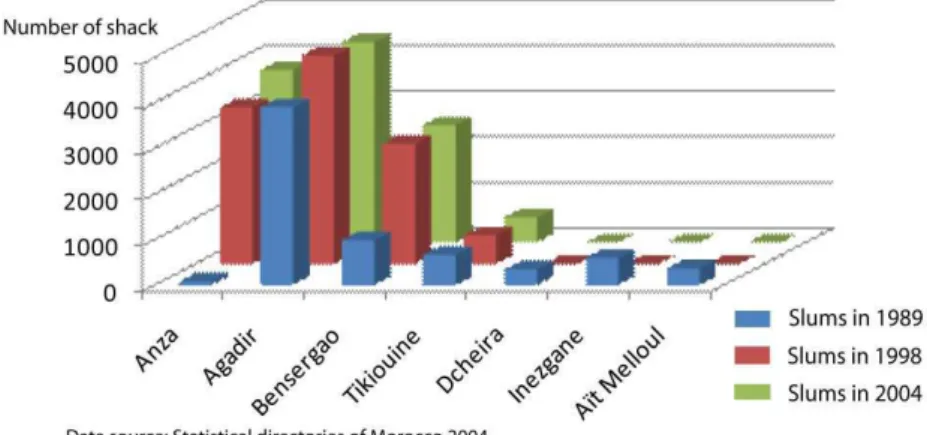
In parallel to the development of regulatory planning in Agadir, there is an accelerated proliferation of both types of substandard housing. Firstly the nuclei of slums that are growing rapidly throughout the urban fabric should be mentionned. According to RGPH (1994), 10,331 shacks were counted, representing nearly 18.3% of the urban population; Agadir is the most affected commune with 4,391 shacks, followed by Anza with 3,784 shacks, Bensergao with 2,579 shacks and finally Tikiouine with 552 shacks (Fig. 7).
Fig. 7. Evolution of the slums in Agadir between 1989-2004
Moreover, the clandestine habitat areas have expanded away from any regulation or planning, leaving them without any infrastructure equipment. The last ones have27 clandestineneighbourhoods (the phenomenon has grown very rapidly in the municipality of Agadir especially in peripheral centers (Anza, Tikiouine, Bensergao), along wadi Souss and main roads in the dormitory cities (Inezgane, Aït Melloul, Dcheira)) with a total area of 2,539 hectares on which resident 36,966 households or about 184,000 inhabitants.
3.2. Urban Dynamics: Impact and Dysfunctions
of vitality, later becomes a handicap. There are a number of spatial disorders as well as social problems which are already visible and others which are starting to cause problems on the medium to long term. A hazardous urbanization leads to generating under-equipped neighbourhoods that are encroaching in certain places on the agricultural or forest areas (located in random areas sometimes). It also threatens the environmental balance and pollutes groundwater by discharging untreated sewage water. It concentrates an urban and/or suburban proletariat which is open to all ideological influences that are latent or sometimes extremist in their simplistic desire to solve complex socio-economic issues by demagogic equations.
3.2.1. A spatial Segregation which Reflects a Facto Urbanism
The discrepancy is obvious between the objectives of the planning documents and urban reality; the comparison between these two indicates that the planning tools play a more supportive and legitimacy role of a reality that transcends them. This causes many problems: an inconspicuous and disoriented urban space, important misused soil surfaces, large and poorly defined public spaces which are difficult and expensive to maintain. The peripheral areas accuse a lack of functional vitality and an urban atmosphere that reminds of “unfinished business” and an urban sprawl which reveals immense spaces without grace, under-equipped and difficult to manage.
Neighbourhoods are differentiated by their function, morphology and also by their social content (Ben Attou, 2005); specialization of neighbourhoods and spatial discontinuities are very striking in Agadir which offers the image of a city which is deeply missing cohesion and unity. The principle of zoning, which was adopted for developing the plan, has created problems of functional linkage, considering that each zone is excluded and isolated from the others.
The very planned and controlled development of Agadir, the high price of housing and land imposed a new problem to the newcomers and low-wage workers who have found it very difficult to locate housing. Most of them were forced to settle in nearby centres (Bensergao, Tikiouine, Inezgane and Aït Melloul) which are excluded in the development plans from any attempt to be integrated in the new town. The isolation and ignorance of the periphery favoured the development in an anarchic and spontaneous way of the housing and the non-regulatory slums since 1970.
3.2.2. Illegal urbanization in the zones of risk and environmental problems
uncontrolled spatial extensions that were experienced by the city had the effect of mutating the formerly existing original small and medium towns in urban agglomerations. The accelerated development couldn therefore not be controlled by the city’s managers. This is why we find ourselves today in the face of degraded public spaces in a poor urban environment, where the built-up is in a poor condition. A major finding emerges when discussing natural resources. There are great destructive effects that were undergone by the argan forest ecosystem in particular. The argan tree (Argania Spinosa) is a tropical species unique to Morocco, which dates back to the Tertiary. This multi-purpose tree (social, economic) that survives at the latitude of Agadir in a desert-like climate is a particularly threatened species today. This phenomenon couldn’t be, in any case, explained by a geographical determinism (prolonged drought, decline in the argan forest area, etc.), but through urban sprawl. According to the existing data, the regression of the argan tree has reached 70% of its range of initial occupancy and its disappearance rate would be of about 600 to 1,000 ha/year (Fig. 6).
In a landscape dominated by flat plains, basins with steep slopes, the phenomenon of flooding represents a serious threat during heavy rains; including the floods that affect urban areas. During the reconstruction phase, wadi Tildi, Tanaout and Lahouar were abandoned, probably for reasons of cost, causing flooding. For financial reasons among others, many prefer to bury their heads in the sand or to use deceptive improvisations. The few existing dams are insufficient and channelling the wadis causes the activation of violent currents that reinforces the topography of the city. With the proliferation of non-regulatory areas, this natural phenomenon is a significant risk that can cause the loss of human lives and material damage. In Agadir, which is passed by four wadis, we find that the banks are often urbanized without any precautions. The main wadi is Lahouar for which not even the presence of crossing works would not be enough, because of their undersized dimensions. This is amplified by the degradation of vegetation cover upstream, sedimenting in the wadi`s beds and their occupancy by buildings and the gradual disappearance of the flood plains (Bailly, 1991) (Fig. 6).
Another problem that arises in this environment is the development of chaotic areas and neighborhoods called “shanty towns” that are often located and constructed in areas exposed at risk (unstable land, sloping areas or floodplains). They represent a great threat to human safety. This is apart from their location on seismic zones that are corresponding to faults of tectonic plates, especially for those of them which are located at the foothills (Fig. 6).
All these problems favour the risk of social conflicts. Poverty and poor living or “existence” conditions are making difficult to meet many basic needs. Consequently we are experiencing a situation of lack in areas with food resources (nutritional imbalance), health services (lack of access to primary care), education services (no schooling) and the growing of poor housing. Another problem which adds is also the total exclusion and inequality that is exerted by the government (lack of action and fight against poverty). All these are the reasons that can cause social dissensions in these neighborhoods and a conflict that may threaten the peace and the social and economic stability. This is an intolerable situation and a real risk to the environment.
In conclusion, the lack of overall planning and participatory approach, have resulted in failures within the Grand Agadir which have weakened the hinterland and have produced an imbalance between the spaces of this agglomeration; the whole at the expense of a diversified natural potential and as a threat to the environment.
Conclusion
The metropolitan area of Agadir has experienced during the 1970-2005 period several strong urban and human pressures under the considerable effects of population and economic growth of the composing centers. This dynamic urban centre starts to pose questions of substance in terms of territorial planning, organization of productive activities and competitiveness. These questions are even more crucial since the emergence of large urban centers is, in the context of globalization, a main determinant of attractiveness. This urbanization is also a powerful vehicle for social transformation and human development of the population. Indeed, by urbanizing, the society is open to new values and multiple mutations. Among the major socio-spatial mutations that the territory of Agadir has experienced in recent years, urbanization has been arguably one of the most striking. If this change has created significant potential for stimulating the economy, equipment and modernization of the city, it also raised many new challenges: infrastructure provision, housing production in sufficient quantity, the accumulation of poverty, degradation of the natural environment, the magnitude of the collective costs in cities, the limits of traditional regulation in urban management.
REFERENCES
Ait Hssaine, A. (2000), „Agadir dans son environnement physique”, in Acte du colloque sur
l’agglomération du grand Agadir, University of Ibnou Zohr; pp. 107-116.
Abdellaoui, A., A. Rougab (1994), „Intégration de données multisources pour l’étude d’un paysage urbain: cas de l’agglomération blidéenne (Algérie)”, in Actes de la 6e Conférence
canadienne sur les SIG, 4-10 june 1994, Ottawa (Ontario), Ressources Naturelles Canada,
vol. 1, pp. 1479-1487.
Abdellaoui, A., A. Rougab (1995), „Caractérisation de la réponse du bâti: application au complexe urbain de Blida (Algérie)”, in Télédétection des milieux urbains et périurbains, Actes des
VIe Journées scientifiques du Réseau Télédétection de l’AUPELF / UREF, 2-5 october 1995,
Liège (Belgium), pp. 75-83.
Abdellaoui, A. (2009), „Potentialité de l’imagerie satellitale moyenne résolution pour le suivi du transport de sable en milieu oasien”, Séminaire international « Dynamiques des paysages
et teledetection: aspects environnementaux et developpement durable », Manouba,
Tunisie, 9-11 june 2009, to appear in conference’s proceedings.
Ackermann, G., O. Tournaire, C. Mering (2004), „Étude de l'extension du bâti sur le littoral sénégalais à partir des paramètres texturaux de Haralick”, Revue Française de
Photogrammétrie et de Télédétection, no 173/174, pp.104-112.
Bailly, A. (1991), „La géographie des risques naturels”, in Bailly et al, Les concepts de la
géographie humaine, 2nd edition, Paris, Masson, 1991, pp.182.
Bianchin, A., L. BRAVIN (2004), „Reproductibilité des procédures d'extraction de l'espace urbain”,
Revue Française de Photogrammétrie et de Télédétection, no 173/174, pp. 93-103.
Ben Attou, M. (2005), „Agadir les contrastes socio-spatiaux d'une ville reconstruite” in „Villes
arabes en mouvement”, Cahier n° 18 du Groupe de Recherche sur le Maghreb et le Moyen-Orient, Laboratoire SEDETCNRS, Publication l'Harmattan, pp. 165-194.
Bres, S., J. M. Jolion, F. Lebourgeois (2003), Traitement et analyse des images numériques, Lavoisier, Hermès, 410 p.
Chopin, F., C. Mering (2004), „Cartographie de la densité du bâti par analyse granulométrique des images de télédétection”, Revue Française de Photogrammétrie et de Télédétection, n° 173/174, pp. 113-122.
Cheref M. (January 1994), „Agadir une ville orpheline de son passé: mesurer le présent, stimuler le futur”, in Acte du colloque sur l’agglomération du grand Agadir, University of Inbnou Zohr; pp. 167-180.
Civco, D., J. Hurd (1997), „Impervious Surface Rnapping for the State of Connecticut”, in
Proceedings of the ASPRS/ACSM Annual Convention, Seattle, Washington, pp. 124-135.
Faure, J. F., A. Tran, A. Gardel, L. Polidori (2004), „Elaboration d'un indice de densité de population et analyse de sa distribution spatiale à Belem (Bresil) et Cayenne (Guyane Française)”,
Revue Française de Photogrammétrie et de Télédétection, no 173/174, pp.135-144; America, Institut de Recherche sur l'Environnement Construit, EPFl, 1994, 31 p.
Gadal, S. (2003), L’identification des formes spatiales de métropolisation par télédétection, Éditions Ératosthène, Lausanne.
Gong, P., J. Howarth (1990), „The Use of Structural Information for Improving Land-Cover Classification Accuracies at the Rural-Urban Fringe”, Photogrammetric Engineering & Remote
Sensing, vol. 56, no l, pp. 67-73.
Harris, P., S. Ventura (1995), „The Integration of Geographic Data with Remotely Sensed Imagery to Improve Classification in an Urban Area”, Photogrammetrie Engineering & Remote
Sensing, vol. 61, no, 8, pp. 993-998.
Im, J., J. R. Jensen (2005), „Change Detection Using Correlation Analysis and Decision Tree Classification,” Remote Sensing of Environment, vol. 99, pp. 326-340.
Jensen, J. R. (1996), „Introductory Digital Image Processing – A Remote Sensing Perspective”, 2nd edition, Prentice Hall, Upper Saddle River (N.J.), 316 p.
Moller-Jensen, L. (1990), „Knowledge-Based Classification of an Urban Area Using Texture and Context Information in Landsat-TM Imagery”, Photogrammetric Engineering and Remote
Sensing, vol. 56, no 6, pp. 899-904.
Puissant, A., C. Weber (2004), „Démarche orientée objets-attributs et classification d'images. THRS”, Revue Française de Photogrammétrie et de Télédétection, no 173/174, pp. 123-134. Soille, P. (1999), Morphological Image Analysis, Springer-Verlag, Berlin-Heidelberg, 316 p. Sietchiping, R. (2003), „Évolution de l'espace urbain de Yaoundé, au Cameroun, entre 1973 et
1988 par télédétection”, Teledetection, vol. 3, no 2-4, pp. 229-236.
Skupinski, G., D. Binh Tran, C. Weber (2009), „Les images satellites Spot multi-dates et la métrique spatiale dans l’étude du changement urbain et suburbain – Le cas de la basse vallée de la Bruche (Bas-Rhin, France)”, Cybergéo, Revue Européenne de Géographie, no 439, 22 p. Stanford, S., M. Phinn, P. Scarth, A. Murray, P. Shy (2002), „Monitoring the Composition of Urban
Environments Based on the Vegetation-Impervious Surface-Soil (VIS) Model by Subpixel Analysis Techniques”, International Journal of Remote Sensing, vol. 23, pp. 4131-4153. Stefanov, W., M. Ramsey, P. Christensen (2001), „Monitoring Urban Land Cover Change: An Expert
System Approach to Land Cover Classification of Semiarid to Arid Urban Centers”,
Remote Sensing of Environment, vol. 77, pp. 173-185.
Voiron, C. (1995), Analyse spatiale et Analyse d’images, Edition Espaces Modes d’Emploi. Weng, Q, D. Lu (2004), „Spectral Mixture Analysis of the Urban Landscape in Indianapolis
Weber, C. (2001), „Remote Sensing Data Used for Urban Delimitation”, in Remote Sensing and
Urban Analysis, sous la direction de J. P. Donnay, M. J. Barnsley and P. A. Longley,
Taylor and Francis, London, pp. 155-167.