Narrow band spectral indexes for chlorophyll determination
in soybean canopies [
Glycine max
(L.) Merril]
Clotilde Pinheiro Ferri1, Antonio Roberto Formaggio1,* and Marlene Aparecida Schiavinato2
1Divisão de Sensoriamento Remoto, Instituto Nacional de Pesquisas Espaciais, CP 515, CEP 12201-970, São José dos Campos, SP,
Brasil;2Departamento de Fisiologia Vegetal, Instituto de Biologia, CP 6109, Universidade Estadual de Campinas, 13083-970, Campinas,
SP, Brasil. *Corresponding author: formag@ltid.inpe.br
Received: 26/03/2004, Accepted: 23/09/2004
Photosynthetic pigments are essential for plant development. Quantifying these pigments in great extensions of agricultural crops is an important objective in remote sensing for agricultural purposes. This information can be used to produce a more accurate estimation of the physiological state of the vegetation, for species discrimination and productivity estimation. The aim of the present study was to (a) evaluate the potential for estimating chlorophyll content of crop canopies, using narrow band spectral indexes, and (b) in this respect compare the performances of NDVI (a multispectral wide band index) and two narrow band vegetation indexes (R750/700and R750/550). Experiments were carried out under greenhouse conditions whereby soybean [Glycine max (L.), Merril] was monitored with a high-resolution spectroradiometer (10 nm at 365-1,126 nm range) during the phenological cycle of the crop. Chlorophyll (a, b and total) contents were determined weekly in the laboratory. A statistical correlation analysis was performed between narrow band spectral indexes against chlorophyll content and r2
coefficients near 0.84 were obtained. For NDVI r2 was around 0.51. These analyses showed that R
750/700and R750/550 ratios are very useful indexes for chlorophyll determination and very effective compared with NDVI (one of the wide band indexes widely used). Thus, it can be stated that hyperspectral remote sensing has great potential for providing a reliable estimate of photosynthetic pigment content at the canopy level through evaluated indexes and other such indexes that might arise. Thus, further studies should be carried out for evaluating other indexes at the canopy level, both in the laboratory and under field conditions, using spectroradiometers and hyperspectral images, aimed at providing information for agricultural purposes.
Key words: canopy chemistry, hyperspectral remote sensing, remote sensing in agriculture, spectroradiometry.
Índices hiperespectrais de vegetação para a determinação do conteúdo de clorofila em dosséis de soja [Glycine max (L.)
Merril]: Os pigmentos fotossintéticos são essenciais ao desenvolvimento das plantas e sua quantificação em grandes extensões de
culturas agrícolas é uma das metas mais importantes do sensoriamento remoto aplicado à agricultura. Essa informação pode ser utilizada para determinar, mais precisamente, o estado fisiológico das plantas, discriminar as espécies plantadas e estimar a produtividade. O presente trabalho teve como objetivos: (a) avaliar o acerto da estimativa do conteúdo de clorofila em dosséis de culturas, usando índices espectrais de bandas estreitas, e (b) comparar os desempenhos do Índice de Vegetação Diferença Normalizada (NDVI) em relação a dois índices de bandas estreitas (R750/700e R750/550). Desenvolveu-se um experimento em condições de casa de vegetação cuja cultura da soja [Glycine max (L.) Merril] foi monitorada, durante o seu ciclo fenológico, com um espectrorradiômetro de alta resolução espectral (10 nm no intervalo de 365 a 1.126 nm). Determinaram-se os conteúdos de clorofila (a, b e total), semanalmente, em laboratório, e calcularam-se correlações estatísticas entre os índices de bandas estreitas e o conteúdo de clorofilas,
obtendo-se coeficiente r2 de 0,84, enquanto para o índice NDVI, obteve-se 0,51. Segundo as análises realizadas, as razões R
750/700 and R750/550 constituem importantes índices para a determinação das clorofilas em dosséis, sendo mais efetivas em comparação ao NDVI, um dos índices de banda larga mais utilizados. Dessa forma, pode-se dizer que os índices avaliados (e outros que possam ser gerados) possuem grande potencial para estimar o conteúdo de pigmentos fotossintéticos em dosséis agrícolas.
Palavras-chave: espectrorradiometria, química de dossel, sensoriamento remoto hiperespectral, sensoriamento remoto em
INTRODUCTION
Chlorophylls are essential for plant development, as they are responsible for the capture of incident solar energy necessary for photosynthesis. With the development of hyperspectral remote sensing in the 1980s, the possibility has arisen to quantify each of these pigments individually in extensive agricultural crop areas (Dawson et al., 1998a,b; Fourty and Baret, 1998; Green et al., 1998; Martin et al., 1998; Dawson et al., 1999; Jago et al., 1999, Kokaly and Clark, 1999; Gitelson et al., 2002). Such information can be used for the determination of the physiological state of the vegetation (detecting stresses), for species discrimination (monitoring phenological characteristics) and for productivity estimation (measurement and interpretation of absorbed photosynthetically active radiation) (Blackburn, 1998a,b). Furthemore, in the last decade, attention has been focused on the utilisation of non-destructive techniques to quantify elements from leaves (Blackburn and Steele, 1999). One possible way to make use of the hyperspectral sensor data for the determination of pigment concentration is to use spectral reflectance indexes. These indexes use narrow spectral bands in the form of addition, ratio or multiplication, and their objective is to minimise interfering effects in the spectral data (for example the soil background and structural factors), thus allowing more specific data for the determination of the photosynthetic components of the vegetation.
The present work was carried out considering the prospect of new sensors of very fine spectral resolution (named hyperspectral sensors), which are already in use or forthcoming (currently used in aircraft and satellites). It is assumed that significant relationships exist between the spectral reflectance of an agricultural crop and its agronomic parameters. The main goal of the present investigation is the evaluation of photosynthetic pigments of the soybean crop through spectral indexes, using both the narrow and wide band spectral data. Thus, experiments were carried out under greenhouse conditions whereby soybean [Glycine max (L.), Merril] plants were monitored at weekly intervals with a high-resolution spectroradiometer, throughout the phenological cycle of the crop.
MATERIAL AND METHODS
The experiments were performed under greenhouse conditions, in the Department of Plant Physiology at the State University of Campinas (UNICAMP), at Campinas, São Paulo, Brazil), in August, 2000, using a totally randomized
statistical design. A precocious soybean cultivar (IAC 17) was planted in trays containing washed vermiculite, and maintained in the greenhouse. When the plants produced fully developed cotyledons (VC stage, according to the phenological scale proposed by Alvares Filho, 1988), the seedlings were transferred to 16 black plastic trays (60 cm x 40 cm x 20 cm), each containing about 40 L of soil. The soil of each tray was prepared from a mixture of 200 L of Black Soil, 400 L of a Ferric Oxisol (“Latossolo Vermelho Eutroférrico” according to the Brazilian Soil Taxonomy, as defined in Embrapa, 1999), 120 L of an Entisol (“Neosolo Quartzarenico” Embrapa, 1999), 80 L of vermiculite and 2 kg of chemical fertilizer NPK (4-14-8). The spacing used in each box between lines and between plants was 8 cm resulting in 40 plants per tray.
Hyperspectral data for soybean were collected at close-range using a Spectron Engineering SE-590 portable spectroradiometer. The system detects and records spectral data in 252 usable bands in the range 365 to 1126 nm. Mean wavelength spacing between midpoints of adjacent bands was about 3 nm. The sensor was configured to acquire eight individual radiance measurements, which were internally averaged and stored as a single data file. The controller was connected to a portable computer, which initiates the scanning procedure, graphically displays the reflectance values of the target, and stores the data. The sensor was positioned at a height of 100 cm above the canopy. The sensor head was then positioned over three different sample locations within each plot and radiant flux was measured. A white Spectralon (Labsphere, 2004) reflectance standard was used to calibrate the spectroradiometer to the total incoming radiant flux. All canopy radiance data were imported into Microsoft’s Excel Spreadsheet software and the bidirectional reflectance factor (%) was calculated as:
Rλ soybean(%) = ( Lλ soybean [µW.cm-2.sr-1.nm-1] ) / ( L λ panel [µW.cm-2 sr-1 cm-1] )*100,
where Lλ soybean is the measured radiance for soybean at wavelength λ; Lλ panel is the measured radiance for the calibration panel at wavelength λ; Rλ soybean is the canopy reflectance (%) for soybean at wavelength λ.
Each week, the following soybean agronomic parameters were determined: (a) plant height (from the stem base to the highest visible node); b) shoot fresh mass and shoot dry mass (obtained in a forced-draught oven at 80oC, for at least 48 h); c)
Meter); d) percentage of green vegetation cover over the soil (obtained by digital photography processed using the SPRING software (INPE, 2000); e) phenological stage, identified during the whole cycle of the crop, according to Alvares Filho (1988); f) colorimetric determination of pigment concentration (chlorophylls a and b and total chlorophylls), using three 25 mg samples per box (to better represent the top of the canopy, ten leaves were harvested from the superior part of ten plants from each box; these leaves were then cut into small disks and weighed to 25 mg). Pigments in the discs were extracted with dimethyl sulfoxide (Hiscox and Israelstam, 1979) and the data obtained from spectrophotometer readings at 470, 646 and 663 nm were used to calculate the concentration (Lichtenthaler, 1987).
Spectral indexes (narrow bands) for the chlorophyll determination at different stages of crop development were calculated according to the spectroradiometric data. The following indexes were analysed: (a) the ratios R750/700and R750/550 (Lichtenthaler et al.,1996); and (b) NDVI, proposed by Rouse et al. (1973). The linear regression analysis (Neter e Wasserman, 1974) was used to analyse the results and establish any existing relationships between the indexes and the data of pigment concentration obtained in the laboratory.
RESULTS AND DISCUSSION
Soybean development in greenhouse conditions: During the phenological development of soybean, data were collected that allowed the analysis of the following parameters: height, shoot fresh mass, shoot dry mass, total leaf area, ratio of leaf area, net assimilation rate, relative growing rate, percent covering and leaf area index. These parameters were used for a growth analysis procedure, carried out according to Beadle (1993), in order to determine crop development under greenhouse conditions. The soybean plants presented normal development under greenhouse conditions, revealing an assimilatory system sufficient and efficient for the production and accumulation of dry material. The work of Ferri (2002) discusses the results of this growth analysis in detail.
Table 1 presents values for chlorophyll obtained during the phenological development of soybean plants and figure 1 shows the spectral behaviour for three different phenological stages of soybean development. These data show that the normal development indicated by the growth analysis is also shown by the spectral graphs obtained during three distinct stages of the crop’s biological cycle. The figures represent three stages of the crop: VC - soybean plant with
developed cotyledons; V5 - soybean plant with five nodes on the main stem bearing fully expanded leaves; and R8 - 95% of the pods having reached ripe pod colour.
Reflectance Ratios R750/700 and R750/550: Hyperspectral remote
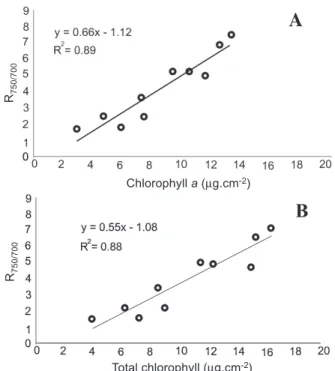
sensing using spectral reflectance indexes that associate two or more narrow spectral bands in the form of a ratio, addition or multiplication may have potential for the determination of chlorophyll in agricultural crop canopies. According to Lichtenthaler et al. (1996), a non-destructive way to determine the chlorophyll content of vegetation canopies is the use of remote sensing techniques, however these determinations will only be accurate when high-resolution spectral radiometry is used. The authors suggested new ratios of two reflectances (R750/700 and R750/550) to determine the chlorophyll concentration in tobacco leaves, having found a high correlation between the spectral variables and the referred pigment (chlorophyll a and total). In the present work, the reflectances at 550 nm, 700 nm and 750 nm (represented by R550, R700 and R750 respectively) presented variations with the increase in chlorophyll concentration during the growth cycle (figure 1) and, when the ratios suggested by Lichtenthaler et al. (1996) (R750/700 and R750/
550) were applied, high values for correlation coefficients were obtained between the ratios and chlorophyll (a and total) (figures 2 and 3).
The results shown above for the ratios R750/700 and R750/
550 are consistent with the results obtained by Lichtenthaler et al. (1996) and Gitelson and Merzlyak (1997). These authors found linear relationships with chlorophyll a content, with determination coefficients higher than 0,90. However,
Table 1. Mean and standard deviation (SD) of chlorophyll a
and b and total chlorophyll during the phenological
development of soybean.
Chlorophyll a Chlorophyll b Total chlorophyll
Mean SD Mean SD Mean SD
Total chlorophyll (µg.cm-2) R7
5
0
/7
0
0
Figure 1. Soybean mean reflectance spectra at three different
phenological stages of crop development.
Figure 2. Mean ratio of linear relationships R750/550 to
chlorophyll a (A) and total chlorophyll (B) content (significant values at 5% probability level).
Total chlorophyll (µg.cm-2)
A
B
Chlorophyll a (µg.cm-2)
Wavelenght (nm)
R
e
fl
e
ct
a
n
ce
(%
)
R7
5
0
/5
5
0
R7
5
0
/5
5
0
Figure 3. Mean ratio of linear relationships R750/700 to
chlorophyll a (A) and total chlorophyll (B) content (significant values at 5% probability level).
Chlorophyll a (µg.cm-2) R7
5
0
/7
0
0
A
B
it is important to point out that they used an integrating sphereand individual leaves, while in the present work the remote sensing data were obtained with a spectroradiometer over the soybean canopy.
The fact that in the present work the focus was on canopies and nevertheless high and significant determination figures were obtained shows that, overall, R750/550 and R750/700 ratios can be considered good indicators of chlorophyll in plant canopies, when narrow band remote sensing techniques are used. This has an obvious application in the study of large areas of agricultural crops that can be monitored by airplanes, satellites or for use in precision farming.
R750/550 and R750/700 compared to NDVI: The NDVI index proposed by Rouse et al. (1973) is a broad-band vegetation index and has largely been employed to determine quantitative
parameters of green phytomass through remote sensing, using wide spectral bands in the red and near infrared generally acquired by multispectral sensors in satellites. On the other hand, with the development of hyperspectral remote sensing, Lichtenthaler et al. (1996) have proposed the use of R750/R550 and R750/R700 ratios, where the reflectance values are those of very narrow bands (1 to 6 nm, depending on the equipment used) of green, red and infrared. Table 2 presents the mean values obtained for the ratios, comparing the reflectance of the experiment performed.
Figure 4 shows the profile of R750/550 and R750/700 together with NDVI indexes at different stages of soybean crop development. As the differences in amplitude for NDVI and for ratios R750/550 and R750/700 are high, the graphical comparison of these parameters required normalisation such that maximum values are transformed to 1.0.
hence proving that such relationships have great potential for the determination of chlorophyll using crop canopies with data collected by air or orbital remote sensors.
Lichtenthaler et al. (1996) suggested the use of R750/700, which is a simple spectral ratio, and figure 5 shows that a good relationship is obtained between this index and chlorophyll a content. The relationships of the indexes R750/
700 and NDVI in relation to chlorophyll a content are compared in figure 5.
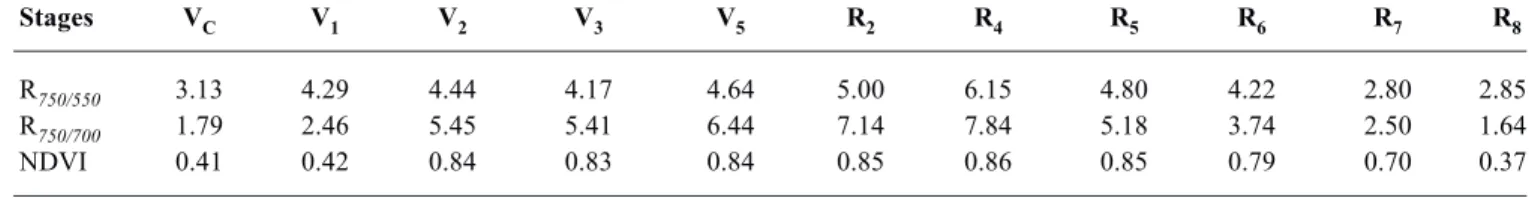
A poor relationship between NDVI values and chlorophyll a content is shown, mainly when the index suggested by Lichtenthaler et al. (1996) is used. Table 2 shows that NDVI values varied from 0,37 to 0,86, a variation of 57 %, while the values of chlorophyll a varied from 3.11 to 18.11
µg.cm-2 (82 %) (table 1). Higher variation for the values of
Table 2.Mean values for R750/550, R750/700 reflectance ratios and for NDVI, at different soybean phenological stages.
Stages VC V1 V2 V3 V5 R2 R4 R5 R6 R7 R8
R750/550 3.13 4.29 4.44 4.17 4.64 5.00 6.15 4.80 4.22 2.80 2.85
R750/700 1.79 2.46 5.45 5.41 6.44 7.14 7.84 5.18 3.74 2.50 1.64
NDVI 0.41 0.42 0.84 0.83 0.84 0.85 0.86 0.85 0.79 0.70 0.37
Figure 5. Mean relationships of the index R750/700 and NDVI
indexes to chlorophyll a content.
Figure 4. Mean R750/550 and R750/700 and NDVI index profiles
at different phenological stages of soybean crop development (normalized curves).
Phenological stage
Chlorophyll a (µg.cm-2)
ratios R750/550 and R750/700 (53.6 % and 75.8 %, respectively), may also be observed. Such variations were also reported by Lichtenthaler et al. (1996), who found much better relationships between the ratios when working with leaves of tobacco. Thus, it is possible to determine chlorophyll a and total chlorophyll concentrations in the vegetation canopy using the ratio Lichtenthaler et al. (1996) idealised for leaves. Indexes R750/550 and R750/700 presented, on average, a better relationship with chlorophyll a content than the NDVI index. In conclusion, soybean plants developed in what might be considered a normal manner, even though cultivated under greenhouse conditions, since growth analysis suggested that the assimilatory system was both sufficient and efficient for the production and accumulation of dry material. From the V3 stage, the spectral responses obtained by the spectroradiometer were already typically those of vegetation. At this point the display of relationships between spectral responses and pigment concentration began, which confirmed the validity of using hyperspectral images to determine phenological stages and other characteristics like crop vigour, health conditions and productivity. Ratios R750/550 and R750/
700 proved to be very useful indexes, and more effective for the determination of chlorophyll a and total chlorophyll, when compared to the NDVI index, one of the most widely used broad band spectral indexes for remote sensing of vegetation. Our work has shown that, when one uses the evaluated narrow band vegetation indexes, it is possible to estimate photosynthetic pigments using spectral reflectance at the canopy level. Other narrow band indexes can be produced and further work must be conducted, both the laboratory and in the field, making use of spectroradiometers and hyperspectral images, in order to evaluate these and other indexes for remote sensing at the vegetation canopy level, evaluating their efficiency and applicability for future agricultural uses. Also, new experiments under similar conditions to those carried out here are also advisable, however with modifications of the conditions of data gathering, such as light and viewing angles, so that the effects
V
e
g
e
ta
ti
o
n
I
n
d
e
xe
s
R750/700
of the environment are minimised. The possibility of using this approach for lignin and cellulose determination is also recommended, since these components are very important in many aspects, in view of the increasing number of reports in the literature which suggest they are likely candidates for hyperspectral remote sensing estimation.
Acknowledgments: We would like to acknowledge FAPESP
for financing this research.
REFERENCES
Alvares Filho A. (1988) Botânica e desenvolvimento. In: Santos OS (ed), A cultura da soja, vol. 1, pp.25-35. Editora Globo, Rio de Janeiro.
Beadle CL (1993) Growth analysis. In: Hall DO, Scurlock JMO, Bolhàr-Nordenkampf HR, Leegood RC, Log SP (eds), Photosynthesis and production in a changing environment: a field and laboratory manual, pp.36-46. Chapman & Hall, London.
Blackburn GA (1998a) Spectral indexes for estimating photosynthetic pigment concentrations: a test using senescent tree leaves. Int. J. Remote Sensing 19:657-675. Blackburn GA (1998b) Quantifying chlorophylls and carotenoids at leaf and canopy scales: an evolution of some hyperspectral approaches. Remote Sensing Environ. 66:273-285.
Blackburn GA, Steele CM (1999) Towards the remote sensing of Matorral vegetation physiology: relationships between spectral reflectance, pigment, and biophysical characteristics of semiarid bushland canopies. Remote Sensing Environ. 70:278-292.
Dawson TP, Curran PJ, Plummer SE (1998a) LIBERTY – modeling the effects of leaf biochemical concentration on reflectance spectra. Remote Sensing Environ. 65:50-60. Dawson TP, Curran PJ, Plummer SE (1998b) The biochemical
decomposition of slash pine needles from reflectance spectra using neural networks. Int. J. Remote Sensing 19:1433-1438.
Dawson TP, Curran PJ, North PRJ, Plummer SE (1999) The propagation of leaf biochemical absorption features in forest canopy reflectance: a theoretical analysis. Remote Sensing Environ. 67:147-159.
EMBRAPA (Empresa Brasileira de Pesquisa Agropecuária). Centro Nacional de Pesquisa de Solos. Sistema brasileiro de classificação de solos. Brasília (D.F.), 1999. 412p. Ferri CP (2002) Utilização da reflectância espectral para
estimativa de pigmentos fotossintéticos em dosséis de soja [Glycine max (L.) Merril]. São José dos Campos, Instituto
Nacional de Pesquisas Espaciais (INPE / MCT). PhD thesis. 173 p.
Fourty T, Baret F (1998) On spectral estimates of fresh leaf biochemistry. Int. J. Remote Sensing 19:1283-1297. Gitelson A, Merzliak MN, Lichtenthaler HK (1996) Detection
of red edge position and chlorophyll content by reflectance measurements near 700nm. J. Plant Physiol. 148:501-508. Gitelson A, Merzliak MN (1997) Remote estimation of chlorophyll content in higher plant leaves. Int. J. Remote Sensing 18:2691-2697.
Gitelson AA, Zur Y, Chivknnova OB, Merzliak MN (2002) Assessing carotenoid content in plant leaves with reflectance spectroscopy. Photochem. Photobiol. 75:272-281.
Green RO, Eastwood ML, Sature CM, Chrien TG, Aronsson M, Chippendale BJ, Faust JÁ, Pauri BE, Chovit CJ, Solis M, Olah MR, Williams O (1998) Imaging spectroscopy and the airborne visible/infrared imaging spectrometer (AVIRIS). Remote Sensing Environ. 65:227-248. Hiscox JD, Israelstam GF (1979). A method for the extration
of chlorophyll from leaf tissue without maceration. Can. J. Bot. 57:1332-1334.
INPE (Instituto Nacional de Pesquisas Espaciais). SPRING 3.4: Sistema de Processamento de Informações Georreferenciadas. São José dos Campos (SP), 2000. CD-ROM.
Jago RA, Cutler MEJ, Curran PJ (1999) Estimating canopy chlorophyll concentration from field and airborne spectra. Remote Sensing Environ. 68:206-216.
Kokaly RF, Clark RN (1999) Spectroscopic determination of leaf biochemistry using banddepth analysis of absorption features and stepwise multiple linear regression. Remote Sensing Environ. 67:267-287.
Labsphere Inc. http://www.labsphere.com/, consulted in april/2004.
Lichtenthaler HK (1987) Chlorophylls and carotenoids: pigments of photosynthetic biomembranes. Methods Enzymol. 148:350-382.
Lichtenthaler HK, Gitelson AA, Lang M (1996) Non-destructive determination of chlorophyll content of leaves of a green and an aurea mutant of tabacco by reflectance measurements. J. Plant Physiol. 148:483-493.
Martin ME, Newman SD, Aber JD, Congalton RG (1998) Determining forest species composition using high spectral resolution remote sensing data. Remote Sensing Environ. 65:249-254.
Neter J, Wasserman W (1974) Applied linear Statistical Models: regression, analysis of variance, and experimental designs. Illinois: Richard D. Irwin. 842p.