Arquivos de Ciências do Mar
CONVERSION OF COMMERCIAL CATEGORIES OF
THE SOUTHERN BROWN SHRIMP, Farfantepenaeus
subtilis, INTO LENGTH AND WEIGHT FREQUENCIES
OFF THE BRAZILIAN AMAZON COAST
Conversão das categorias comerciais do camarão-rosa,
Farfantepenaeus subtilis
, em frequências de comprimento e
peso na Costa Amazônica do Brasil
1 Instituto Sócio Ambiental e Recursos Hídricos, Universidade Federal Rural da Amazônia, Av. Presidente Tancredo Neves, 2501, Belém, PA 66077-830.
2 Programa de Pós-Graduação em Biologia Ambiental, Universidade Federal do Pará, Alameda Leandro Ribeiro, s/n, Bragança, PA 68600-000.
3 Instituto de Estudos Costeiros, Universidade Federal do Pará, Alameda Leandro Ribeiro, s/n, Bragança, PA 68600-000.
4 Programa de Pós-Graduação em Ciência e Tecnologia de Alimentos, Universidade Federal do Pará, Rua Augusto Corrêa, 01, Belém, PA 66075-110.
* Corresponding author. E-mail: juniorivan@hotmail.com
Ivan Furtado-Junior1*, Fernando Araújo Abrunhosa2, Francisco Carlos Alberto Fonteles
Holanda3, Victor José Amazonas Soares4
ABSTRACT
This study aims to establish keys for the conversion of weight commercial categories of the southern brown shrimp,
Farfantepenaeus subtilis, into length and weight frequency classes off the Brazilian Amazon Coast. Data on shrimp
length were obtained by sampling the fisheries from Belém, northern Brazil, from May to August, 2008 and from November, 2011 to June, 2012. Data on shrimp weight were obtained during 20 months between 2010 and 2012. The use of conversion keys enables obtaining the total length and weight frequency distributions of shrimp for a specific period,
and the distribution for the total annual catch through a simple extrapolation. Length frequency distribution is the basis
for virtual population analysis and for the assessment of fish stocks.
Keywords: shrimp, weight categories, conversion keys, length distribution, weight distribution.
RESUMO
Este estudo objetiva estabelecer chaves para conversão das categorias comerciais de peso do camarão-rosa,
Farfantepenaeus subtilis, para classes de frequência em comprimento e peso na costa amazônica do Brasil. Os dados de
comprimento do camarão foram obtidos por amostragem nas indústrias de pesca de Belém, norte do Brasil, de maio a agosto de 2008, e de novembro de 2011 a junho de 2012. Os dados de peso se referem a um período de 20 meses entre 2010 e 2012. Com o uso das chaves de conversão pode-se obter a distribuição da frequência total do comprimento e do peso das capturas para o período considerado e, através de uma simples extrapolação, a distribuição para o total das capturas. A distribuição de frequências de comprimento é a base para a Análise de População Virtual e avaliações do estoque pesqueiro.
INTRODUCTION
The southern brown shrimp, Farfantepenaeus subtilis is the main species of the Penaeidae family found off the Brazilian Amazon Coast. The commercial fishing for shrimp species belonging to this family is a common activity in the tropical and subtropical regions of the world, and it is highly profitable in countries where industrial fishing has expanded since the 1950s (Isaac et al., 1992).
In northern Brazil, shrimp fishing at an industrial scale began in 1969 when fishing companies based at Belém, State of Pará, started operating a small national fleet of 6 vessels which had reached 50 units by 1978 (IBAMA, 1997).
Fish sampling during unloading is a classic problem for fishery statistics, since the main goal of sampling a landing is to estimate shrimp composition by size which is amenable to be converted into an age structure. In addition, age-length keys can be made available by means of the various methods of growth study, among which stand out the electronic ELEFAN and modal progression techniques.
The amount of data (gathered) on the southern brown shrimp caught off northern Brazil has increased significantly in recent years. In addition to data on shrimp production and fishing effort, fisheries can provide valuable data on monthly catches, and on how they were processed and converted into weight-derived commercial groups.
This study aimed to establish keys for the conversion of the commercial categories into length and weight groups of the southern brown shrimp caught off the Brazilian Amazon Coast.
MATERIAL AND METHODS
The data analyzed involved the frequency distribution of tail length in centimeters for each commercial category. These data were obtained by land sampling in fisheries from Belém, between May and August 2008 and between November 2011 and June 2012 (Table I). The data for the U-10 category were estimated using the method of Charlier and Babb-Echteld (1999) and converted into full-length values.
The data on the mean weight frequency for each commercial category were collected randomly during the 20-month period between 2010 and 2012, and enabled the sampling of 6,854 2-kg shrimp boxes (Table I).
Table I - Commercial categories of the southern brown shrimp,
Farfantepenaeus subtilis, caught off the Brazilian Amazon Coast.
Commercial categories Tail weight range (g) Length of the sampled 2-kg boxes Number of tails measured Number of the sampled 2-kg boxes 11/15 29.3 – 43.3 5 270 5 16/20 22.1 – 29.2 30 2410 602 21/25 17.8 – 22.0 30 3010 926 26/30 14.9 – 17.7 30 3948 1178 31/40 11.2 – 14.8 30 4686 1286 41/50 9 – 11.1 30 5987 1168 51/60 7.5 – 8.9 30 7728 912 61/70 6.5 – 7.4 30 8534 689 71/90 5 – 6.4 30 10855 143 91/110 4.2 – 4.9 30 12956 30
Samplings on tail length (TL) for each commercial category were converted to total length (L) based on the equation L = 1.591 x TL+0.2908 and grouped into (0.5-mm) length groups.
The mean sample size S was calculated using the equation: S = 453.6 x A / P, in which A is the amount of shrimp in each sampling box, P is the weight in grams, and 453.6 g is the mass equivalent to 1 lb, which is the standard value for the international classification of commercial shrimp categories. Samplings of the mean tail weight (TW) of each commercial category were converted into total weight (W) based on the equation W = 1.5106 x
TW – 0.0398 and sorted out into 2-g weight groups. The results of the length and weight frequency distributions were organized into two conversion keys; the first key comprised the percentage of animals for each commercial category converted into length groups in cm, and the second key comprised the percentage of animals for each commercial category converted into weight groups in grams.
RESULTS AND DISCUSSION
The data analyzed herein were collected aiming to assess the commercial fishing activities of the southern brown shrimp, F. subtilis, off the Brazilian Amazon Coast; therefore, they were grouped regardless of sex because shrimp heads are removed onboard, and the fish industry does allow their being sorted out as male and female during processing and classification of commercial categories.
collectively, thereby enabling the establishment of more adequate control measures.
Table II shows the values obtained for the biometry of the southern brown shrimp tails by commercial category in the processing industry of Belém. During the sampling period, it was not possible to obtain samples of the commercial category U-10, which comprises larger animals with tail weight greater than 43.3 g because this category is rare during the fishing season, yet it occurs in quite a few seasons, which justifies the use of statistical method for its estimate.
Since 1985, the Fishing Department of the Ministry of Agriculture, Livestock, and Fishing (LVV) of Suriname has maintained a systematic sampling program for the shrimp commercial categories that are processed for exportation. This program aims to establish size frequency distributions in each category according to species and sex, in addition to the total catch during unloading and the combined analyses of the results (Charlier & Babb-Echteld, 1999). Therefore, this program allowed the use of the data collected for
F. subtilis along with the data from fishing activities performed off the Brazilian Amazon Coast.
Table II - Frequencies observed by length groups for each commercial category of the southern brown shrimp, Farfantepenaeus subtilis, caught off the Brazilian Amazon Coast.
Length group (cm)
Commercial categories
11-15 16-20 21-25 26-30 31-40 41-50 51-60 61-70 71-90 91-110
6.1-6.5 0 0 0 0 0 0 0 0 0 1
6.6-7.0 0 0 0 0 0 0 0 0 0 5
7.1-7.5 0 0 0 0 0 0 0 0 0 14
7.6-8.0 0 0 0 0 0 0 0 0 3 176
8.1-8.5 0 0 0 0 0 0 0 0 23 226
8.6-9.0 0 0 0 0 0 0 0 0 47 1017
9.1-9.5 0 0 0 0 0 0 2 6 134 2405 9.6-10.0 0 0 0 0 0 0 18 78 275 4825 10.1-10.5 0 0 0 0 0 0 34 422 2044 3538 10.6-11.0 0 0 0 0 1 23 222 1106 4280 675 11.1-11.5 0 0 0 0 9 237 1736 3716 3468 65 11.6-12.0 0 0 0 0 9 729 2742 2232 450 8 12.1-12.5 0 0 0 0 13 1135 1966 694 120 3 12.6-13.0 0 0 0 3 197 1797 915 218 11 0 13.1-13.5 0 0 0 55 447 1221 71 49 0 0 13.6-14.0 0 0 9 180 840 530 19 13 0 0 14.1-14.5 0 0 62 730 1371 266 3 0 0 0 14.6-15.0 0 6 161 1156 1062 35 0 0 0 0 15.1-15.5 0 35 511 1293 659 14 0 0 0 0 15.6-16.0 0 233 859 390 138 0 0 0 0 0 16.1-16.5 0 606 717 83 40 0 0 0 0 0 16.6-17.0 1 710 533 56 0 0 0 0 0 0 17.1-17.5 3 482 89 2 0 0 0 0 0 0 17.6-18.0 5 251 60 0 0 0 0 0 0 0 18.1-18.5 103 83 9 0 0 0 0 0 0 0
18.6-19.0 75 3 0 0 0 0 0 0 0 0
19.1-19.5 59 1 0 0 0 0 0 0 0 0
19.6-20.0 20 0 0 0 0 0 0 0 0 0
20.1-20.5 4 0 0 0 0 0 0 0 0 0
270 2410 3010 3948 4786 5987 7728 8534 10855 12958 18.74 16.74 16.00 14.93 14.29 12.74 11.90 11.41 10.80 9.70 0.56 0.62 0.67 0.63 0.77 0.70 0.54 0.58 0.52 0.57 18.67 16.71 15.97 14.91 14.27 12.72 11.89 11.40 10.79 9.69 18.81 16.76 16.02 14.95 14.32 12.76 11.91 11.42 10.81 9.71 Convention: frequency (n), mean length (L), standard deviation (s2), and confidence limits for
the mean lengths ( L1 and L2 ).
n
In dealing with sea-exploited species, such as
F. subtilis, the share of the catch meant for the local and export markets is usually classified into several categories based on the number of shrimp per pound, a practice which is quite similar worldwide (Gulland and Rosenberg, 1992).
This classification indicates that better estimates can be made about the size composition at (landing) with minimum or no extra efforts. Considering that most shrimp collections are processed in the fisheries and the proportions of each size category (counts per pound) are known, much information is available regarding shrimp size (even though) the size was not measured.
The conversion of commercial categories into full-length frequencies is achieved through the use of conversion keys (Tables III and IV) that present the distribution of size frequencies in each
commercial category as the mean number of animals per kg for each group of total length (Table III) and the relative values (Table IV).
The distribution of the total length frequency for the period considered was obtained by simply adding up the corresponding partial distributions for each commercial category. In cases where there is subestimation of land sampling, a simple extrapolation of the partial distribution for the total annual catch must be performed (Garcia & Le-Reste, 1981).
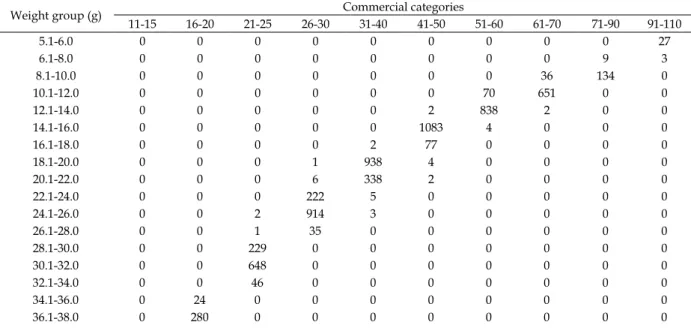
Table V shows data on the tail weight of the southern brown shrimp for the most common commercial categories in fisheries in Belém.
Alternatively, in cases where low accuracy in the category classification occurs, the distribution of weight frequencies for each commercial category can be obtained by using the key for weight percentage (Table VI).
Table III - Conversion key for the commercial categories of full-length tails of the southern brown shrimp, Farfantepenaeussubtilis,
caught off the Brazilian Amazon Coast (average number per kg). Length
group (cm)
Average number of animals per kg in each commercial category
U-10* 11-15 16-20 21-25 26-30 31-40 41-50 51-60 61-70 71-90 91-110
6.1-6.5 0 0 0 0 0 0 0 0 0 0 0.017
6.6-7.0 0 0 0 0 0 0 0 0 0 0 0.083
7.1-7.5 0 0 0 0 0 0 0 0 0 0 0.233
7.6-8.0 0 0 0 0 0 0 0 0 0 0.050 2.933
8.1-8.5 0 0 0 0 0 0 0 0 0 0.383 3.767
8.6-9.0 0 0 0 0 0 0 0 0 0 0.783 16.950
9.1-9.5 0 0 0 0 0 0 0 0.033 0.100 2.233 40.083 9.6-10.0 0 0 0 0 0 0 0 0.300 1.300 4.583 80.417 10.1-10.5 0 0 0 0 0 0 0 0.567 7.033 34.067 58.967 10.6-11.0 0 0 0 0 0 0.017 0.383 3.700 18.433 71.333 11.250 11.1-11.5 0 0 0 0 0 0.150 3.950 28.933 61.933 57.800 1.083 11.6-12.0 0 0 0 0 0 0.150 12.150 45.700 37.200 7.500 0.133 12.1-12.5 0 0 0 0 0 0.217 18.917 32.767 11.567 2.000 0.050 12.6-13.0 0 0 0 0 0.050 3.283 29.950 15.250 3.633 0.183 0 13.1-13.5 0 0 0 0 0.917 7.450 20.350 1.183 0.817 0 0 13.6-14.0 0 0 0 0.150 3.000 14.000 8.833 0.317 0.217 0 0 14.1-14.5 0 0 0 1.033 12.167 22.850 4.433 0.050 0 0 0 14.6-15.0 0 0 0.100 2.683 19.267 17.700 0.583 0 0 0 0 15.1-15.5 0 0 0.583 8.517 21.550 10.983 0.233 0 0 0 0 15.6-16.0 0 0 3.883 14.317 6.500 2.300 0 0 0 0 0 16.1-16.5 0 0 10.100 11.950 1.383 0.667 0 0 0 0 0 16.6-17.0 0 0.100 11.833 8.883 0.933 0 0 0 0 0 0 17.1-17.5 0 0.300 8.033 1.483 0.033 0 0 0 0 0 0
17.6-18.0 0 0.500 4.183 1.000 0 0 0 0 0 0 0
18.1-18.5 1.125 10.300 1.383 0.150 0 0 0 0 0 0 0
18.6-19.0 8.250 7.500 0.050 0 0 0 0 0 0 0 0
19.1-19.5 10.875 5.900 0.017 0 0 0 0 0 0 0 0
19.6-20.0 2.625 2.000 0 0 0 0 0 0 0 0 0
20.1-20.5 0.125 0.400 0 0 0 0 0 0 0 0 0
Total 23.00 27.00 40.17 50.17 65.80 79.77 99.78 128.80 142.23 180.92 215.97
Convention: Estimates were based on the study by Charlier and Babb-Echteld (1999).
Table IV - Conversion key for the commercial categories of full-length tails of the southern brown shrimp, Farfantepenaeus subtilis,
caught off the Brazilian Amazon Coast (relative values).
Length group (cm) Percentage of the full-length tails in each commercial category
U-10* 11-15 16-20 21-25 26-30 31-40 41-50 51-60 61-70 71-90 91-110
6.1-6.5 0 0 0 0 0 0 0 0 0 0 0.01
6.6-7.0 0 0 0 0 0 0 0 0 0 0 0.04
7.1-7.5 0 0 0 0 0 0 0 0 0 0 0.11
7.6-8.0 0 0 0 0 0 0 0 0 0 0.03 1.36
8.1-8.5 0 0 0 0 0 0 0 0 0 0.21 1.74
8.6-9.0 0 0 0 0 0 0 0 0 0 0.43 7.85
9.1-9.5 0 0 0 0 0 0 0 0.03 0.07 1.23 18.56
9.6-10.0 0 0 0 0 0 0 0 0.23 0.91 2.53 37.24
10.1-10.5 0 0 0 0 0 0 0 0.44 4.94 18.83 27.30 10.6-11.0 0 0 0 0 0 0.02 0.38 2.87 12.96 39.43 5.21 11.1-11.5 0 0 0 0 0 0.19 3.96 22.46 43.54 31.95 0.50 11.6-12.0 0 0 0 0 0 0.19 12.18 35.48 26.15 4.15 0.06 12.1-12.5 0 0 0 0 0 0.27 18.96 25.44 8.13 1.11 0.02 12.6-13.0 0 0 0 0 0.08 4.12 30.02 11.84 2.55 0.10 0 13.1-13.5 0 0 0 0 1.39 9.34 20.39 0.92 0.57 0 0 13.6-14.0 0 0 0 0.30 4.56 17.55 8.85 0.25 0.15 0 0 14.1-14.5 0 0 0 2.06 18.49 28.65 4.44 0.04 0 0 0 14.6-15.0 0 0 0.25 5.35 29.28 22.19 0.58 0 0 0 0 15.1-15.5 0 0 1.45 16.98 32.75 13.77 0.23 0 0 0 0 15.6-16.0 0 0 9.67 28.54 9.88 2.88 0 0 0 0 0 16.1-16.5 0 0 25.15 23.82 2.10 0.84 0 0 0 0 0 16.6-17.0 0 0.37 29.46 17.71 1.42 0 0 0 0 0 0 17.1-17.5 0 1.11 20.00 2.96 0.05 0 0 0 0 0 0
17.6-18.0 0 1.85 10.41 1.99 0 0 0 0 0 0 0
18.1-18.5 5.18 38.15 3.44 0.30 0 0 0 0 0 0 0
18.6-19.0 36.13 27.78 0.12 0 0 0 0 0 0 0 0
19.1-19.5 47.07 21.85 0.04 0 0 0 0 0 0 0 0
19.6-20.0 11.23 7.41 0 0 0 0 0 0 0 0 0
20.1-20.5 0.40 1.48 0 0 0 0 0 0 0 0 0
Total 100 100 100 100 100 100 100 100 100 100 100
Convention: Estimates were based on the study by Charlier and Babb-Echteld (1999).
Table V - Frequencies observed per weight group for each commercial category of the southern brown shrimp, Farfantepenaeus subtilis, caught off the Brazilian Amazon Coast.
Weight group (g) Commercial categories
11-15 16-20 21-25 26-30 31-40 41-50 51-60 61-70 71-90 91-110
5.1-6.0 0 0 0 0 0 0 0 0 0 27
6.1-8.0 0 0 0 0 0 0 0 0 9 3
8.1-10.0 0 0 0 0 0 0 0 36 134 0
10.1-12.0 0 0 0 0 0 0 70 651 0 0
12.1-14.0 0 0 0 0 0 2 838 2 0 0
14.1-16.0 0 0 0 0 0 1083 4 0 0 0
16.1-18.0 0 0 0 0 2 77 0 0 0 0
18.1-20.0 0 0 0 1 938 4 0 0 0 0
20.1-22.0 0 0 0 6 338 2 0 0 0 0
22.1-24.0 0 0 0 222 5 0 0 0 0 0
24.1-26.0 0 0 2 914 3 0 0 0 0 0
26.1-28.0 0 0 1 35 0 0 0 0 0 0
28.1-30.0 0 0 229 0 0 0 0 0 0 0
30.1-32.0 0 0 648 0 0 0 0 0 0 0
32.1-34.0 0 0 46 0 0 0 0 0 0 0
34.1-36.0 0 24 0 0 0 0 0 0 0 0
38.1-40.0 0 238 0 0 0 0 0 0 0 0
40.1-42.0 0 57 0 0 0 0 0 0 0 0
42.1-44.0 0 3 0 0 0 0 0 0 0 0
44.1-46.0 2 0 0 0 0 0 0 0 0 0
46.1-48.0 3 0 0 0 0 0 0 0 0 0
5 602 926 1178 1286 1168 912 689 143 30 46.35 38.14 30.62 24.66 19.68 15.40 12.46 10.45 8.69 5.41
0.46 1.35 0.88 0.78 0.64 0.50 0.37 0.29 0.39 0.48 45.95 38.03 30.56 24.61 19.65 15.37 12.43 10.43 8.63 5.24 46.75 38.25 30.67 24.70 19.72 15.42 12.48 10.47 8.75 5.59
Convention: Frequencies (n), mean weight (W ), standard deviation ( s2 ), and confidence limits for the mean weights (W
1 and W 2 ). s2
W1 W2 W n
Table VI - Conversion key for the commercial categories of tails in total weight of the southern brown shrimp, Farfantepenaeus subtilis, caught off the Brazilian Amazon Coast.
Weight group (g) Percentage of the total weight for each commercial category
11-15 16-20 21-25 26-30 31-40 41-50 51-60 61-70 71-90 91-110
5.1-6.0 0 0 0 0 0 0 0 0 0 90.00
6.1-8.0 0 0 0 0 0 0 0 0 6.29 10.00
8.1-10.0 0 0 0 0 0 0 0 5.22 93.71 0
10.1-12.0 0 0 0 0 0 000 7.68 94.48 0 0
12.1-14.0 0 0 0 0 0 0.17 91.89 0.29 0 0
14.1-16.0 0 0 0 0 0 92.72 0.44 0 0 0
16.1-18.0 0 0 0 0 0.16 6.59 0 0 0 0
18.1-20.0 0 0 0 0.08 72.94 0.34 0 0 0 0
20.1-22.0 0 0 0 0.51 26.28 0.17 0 0 0 0
22.1-24.0 0 0 0 18.85 0.39 0 0 0 0 0
24.1-26.0 0 0 0 77.59 0.23 0 0 0 0 0
26.1-28.0 0 0 0.11 2.97 0 0 0 0 0 0
28.1-30.0 0 0 24.73 0 0 0 0 0 0 0
30.1-32.0 0 0 69.98 0 0 0 0 0 0 0
32.1-34.0 0 0 4.97 0 0 0 0 0 0 0
34.1-36.0 0 3.99 0 0 0 0 0 0 0 0
36.1-38.0 0 46.51 0 0 0 0 0 0 0 0
38.1-40.0 0 39.53 0 0 0 0 0 0 0 0
40.1-42.0 0 9.47 0 0 0 0 0 0 0 0
42.1-44.0 0 0.50 0 0 0 0 0 0 0 0
44.1-46.0 40.00 0 0 0 0 0 0 0 0 0
46.1-48.0 60.00 0 0 0 0 0 0 0 0 0
Total 100 100 100 100 100 100 100 100 100 100
In view of potential changes in the classification systems, it is necessary to monitor the frequency distributions for each category regularly (Garcia & Le-Reste, 1981).
CONCLUSIONS
The use of conversion keys of commercial categories for the distribution of full-length and total weight frequencies enables the assessment of the total frequency of length and weight of the catches during the considered period and the distribution for the total annual catch through a simple extrapolation. In addition, these conversion methods reduce the
sampling effort to acquire information related to the total catch processed by category in the industries.
REFERENCES
Aragão, J.A.N. Dinâmica populacional e avaliação do
estoque do camarão rosa (Farfantepenaeus subtilis
Pérez-Farfante, 1967) na plataforma continental amazônica
brasileira. Tese de Doutorado, Programa de Pós-Graduação em Ciências da Engenharia Ambiental, Universidade de São Paulo, 243 p., São Carlos, 2012.
CFRAMP/FAO/DANIDA Stock Assessment Workshop
on the Shrimp and Groundfish Fisheries on the Guiana-Brazil shelf, 201 p., Rome, 1999.
Garcia, S.M. & Le-Reste, L. Life cycles, dynamics, exploitation and management of coastal penaeid shrimp stocks. FAO Fish. Tech. Pap., Rome, n. 203, p. 1-215, 1981.
Gulland, J.A. & Rosenberg, A.A. A review of length-based approaches to assessing fish stocks. FAO Fish. Tech.
Pap., Rome, n.323, p. 1-100, 1992.
IBAMA. Camarão norte e piramutaba: relatórios reuniões dos grupos permanentes de estudo. IBAMA,
Coleção Meio Ambiente, Série Estudos de Pesca, Brasília, n.10, p.1-148, 1997.
Isaac, V.J., Dias-Neto, J. & Damasceno, F.G. Camarão-rosa da costa norte: biologia, dinâmica e administração pesqueira. IBAMA, Coleção Meio Ambiente, Série