Antioxidant activity of Portuguese honey samples: Different contributions
of the entire honey and phenolic extract
Isabel C.F.R. Ferreira
*, Edmur Aires, João C.M. Barreira, Letícia M. Estevinho
CIMO/Escola Superior Agrária, Instituto Politécnico de Bragança, Campus de Santa Apolónia, Apartado 1172, 5301-855 Bragança, PortugalThe antioxidant activity of Portuguese honeys was evaluated considering the different contribution of entire samples and phenolic extracts. Several chemical and biochemical assays were used to screen the antioxidant properties of entire honeys with different colour intensity and phenolic extracts: reducing power, 2,2-diphenyl-1-picrylhydrazyl (DPPH) radical-scavenging capacity, and inhibition of lipid perox-idation using theb-carotene linoleate model system and the thiobarbituric acid reactive substances (TBARS) assay. The amounts of phenols, flavonoids, ascorbic acid,b-carotene, lycopene and sugars present in the samples were also determined. The highest antioxidant contents and the lowest EC50values for
antioxidant activity were obtained in the dark honey. An analysis of variance was carried out to evaluate the influence of the colour intensity and extraction method in the antioxidant properties and phenolic contents. A discriminant analysis was also performed, giving satisfactory results once the six samples were clustered in six individual groups obtained through the definition of two discriminant analysis dimensions.
1. Introduction
Honey is nectar collected from many plants and processed by honey bees (Apis mellifera). This natural product is widely appreci-ated as the only concentrappreci-ated form of sugar available worldwide (FAO, 1996) and is also used as a food preservative (Cherbuliez & Domerego, 2003).
Honey has been reported to contain about 200 substances (complex mixture of sugars, but also small amounts of other con-stituents such as minerals, proteins, vitamins, organic acids, flavo-noids, phenolic acids, enzymes and other phytochemicals) and is considered to be an important part of traditional medicine (White, 1979). It has been used in ethnomedicine since the early humans, and in more recent times its role in the treatment of burns, gastro-intestinal disorders, asthma, infected and chronic wounds, skin ul-cers, cataracts and other eye ailments has been ‘‘rediscovered” (Castaldo & Capasso, 2002; Marcucci, 1995; Molan, 1992; Orhan et al., 2003). This beneficial role is partially attributed to honeys antibacterial activity. However, since some of these diseases are a consequence of oxidative damage, it seems that part of the ther-apeutic properties of honey is due to its antioxidant capacity. Addi-tionally, the presence of hydrogen peroxide, as well as minerals (particularly copper and iron), in honey, may lead to the generation of highly reactive hydroxyl radicals as part of the antibacterial
system (McCarthy, 1995; Molan, 1992); thus, it is evident that mechanisms must be available in honey to control the formation and removal of these reactive oxygen species. Furthermore, honey, as a source of antioxidants, has been proven to be effective against deteriorative oxidation reactions in food, caused by light, heat and some metals (McKibben & Engeseth, 2002), such as enzymatic browning of fruit and vegetables (Chen, Mehta, Berenbaum, Zangerl, & Engeseth, 2000), lipid oxidation in meat (Gheldof & Engeseth, 2002; McKibben & Engeseth, 2002; Nagai, Inoue, Kanamori, Suzuki, & Nagashima, 2006), and inhibit the growth of foodborne pathogens and food spoilage organisms (Mundo, Padil-la-Zakour, & Worobo, 2004; Taomina, Niemira, & Beuchat, 2001). Overall, honey serves as a source of natural antioxidants (Al-Mamary, Al-Meeri, & Al-Habori, 2002; Aljadi & Kamaruddin, 2004; Antony, Han, Rieck, & Dawson, 2000; Beretta, Granata, Ferre-ro, Orioli, & Facino, 2005; Gheldof, Wang, & Engeseth, 2002; Küçük et al., 2007; Nagai, Sakai, Inoue, Inoue, & Suzuki, 2001; Vit, Soler, & Tomas-Barberan, 1997), which play an important role in food preservation and human health by combating damage caused by oxidising agents e.g., oxygen, namely reducing the risk of heart dis-ease, cancer, immune-system decline, cataracts, different inflam-matory processes, etc. (The National Honey Board, 2003).
2004; Baltrušaityte, Venskutonis, & Cˇeksteryt, 2007; Bertoncelj, Doberšek, Jamnik, & Golob, 2007; Gheldof, Wang, & Engesetg, 2001; Gheldof et al., 2002; Schramm et al., 2003; The National Honey Board, 2003), and more than 150 polyphenolic compounds, including flavonoids, flavonols, phenolic acids, catechins, and cin-namic acid derivatives. In the literature, several studies for the identification and quantification of antioxidant components of honeybee products have been reported (Buratti, Benedetti, & Cosio, 2007; Ferreres, Tomas-Barberan, Soler, & Garcia-Vigera, 1994; Gheldof et al., 2002).
Many methods for determining the antioxidative activity in honey have been used, e.g., determination of total phenolic content (Beretta et al., 2005), radical formation and following scavenging as in 2,2-diphenyl-1-picrylhydrazyl (DPPH) and superoxide radical-scavenging activity measurements (Aljadi & Kamaruddin, 2004; Chen et al., 2000; Gheldof & Engeseth, 2002; Gheldof et al., 2002; Gülçin, Büyükokurog˘lu, Oktay, & Küfreviog˘lu, 2003; Kefalas, Gotsiou, & Chougoui, 2001; Meda, Lamien, Romito, Millogo, & Nacoulma, 2005; Nagai et al., 2001; Taomina et al., 2001), the fer-ric-reducing/antioxidant power (FRAP) assay (Aljadi & Kamarud-din, 2004) and enzymatic or non-enzymatic measurements of lipid peroxidation inhibition (Chen et al., 2000; McKibben & Engeseth, 2002; Nagai et al., 2001).
Although it has already been demonstrated that honey has anti-oxidant activity and different antianti-oxidant compounds, nothing is reported about the different contributions of the entire honeys and their phenolic extracts to those properties. Accordingly, in this work, the antioxidant properties of the entire samples, and pheno-lics extracts were evaluated through several chemical and biochemical assays: DPPH (2,2-diphenyl-1-picrylhydrazyl) radi-cal-scavenging activity, reducing power, inhibition ofb-carotene bleaching and inhibition of lipid peroxidation in pig brain tissue through formation of thiobarbituric acid reactive substances (TBARS). This is also the first study reporting antioxidant activity of Portuguese honey, particularly from a region with high amounts of this natural product (Northeast Portugal).
2. Materials and methods
2.1. Samples
Three unifloral honeys, to the extent of natural limitations, were obtained in Northeast Portugal (Parque Natural de Montesinho) from experienced producers. The type and region of the honey samples, as well as the family, scientific, common and local names of the plants that form the basic flora of the honey samples, are shown inTable 1. The three samples were obtained in June 2007, and the tests were performed within 2 months following collec-tion. Upon receipt, honeys were centrifuged and stored at 21°C in the dark until used.
2.2. Standards and reagents
All the solvents were of analytical grade purity: methanol and diethyl ether were supplied by Lab-Scan (Lisbon, Portugal). The standards used in the antioxidant activity assays: BHA (2-tert -bu-tyl-4-methoxyphenol), TBHQ (tert-butylhydroquinone),L-ascorbic
acid,
a
-tocopherol, gallic acid and (+)-catechin were purchasedfrom Sigma (St. Louis, MO, USA). 2,2-Diphenyl-1-picrylhydrazyl (DPPH) was obtained from Alfa Aesar (Ward Hill, MA, USA). The standard butylated hydroxytoluene (BHT) was purchased from Merck (Darmstadt, Germany). All other chemicals were obtained from Sigma Chemical Co. (St. Louis, MO, USA). Water was treated in a Milli-Q water purification system (TGI Pure Water Systems, USA).
2.3. Colour analysis
Honey samples were heated to 50°C to dissolve sugar crystals, and the colour was determined by spectrophotometric (AnalytikJ-ena 200-2004) measurement of the absorbance of a 50% honey solution (w/v) at 635 nm. The honeys were classified according to the Pfund scale after conversion of the absorbance values: mm Pfund = 38.70 + 371.39Abs (White, 1984).
2.4. Phenolics extraction
The honey sample (10 g) was mixed with acid water (pH 2 with HCl; 0.02 M), until it was totally fluid, after which it was filtered through cotton to remove any solid particles. The filtrate was poured into a column (352 cm) with Amberlite XAD-2 (Fluka
Chemie; porosity 9 nm, particle size 0.3–1.2 mm; 150 g). The phe-nolic compounds were retained in the column whilst sugars and other polar compounds were eluted with the aqueous solvent. The column was washed with the acid solution (pH 2 with HCl, 100 ml) and then with distilled water (100 ml). The phenolic
fraction was eluted with methanol (100 ml) and dried under
re-duced pressure (40°C). The residue was redissolved in methanol to a known final concentration.
2.5. Bioactive compounds quantification
Phenols, flavonoids, ascorbic acid, carotenoids and sugars were determined according to procedures previously described by us (Barros et al., 2007).
For phenolic compounds determination, 1 ml of sample was mixed with 1 ml of Folin and Ciocalteu’s phenol reagent. After 3 min, 1 ml of saturated sodium carbonate solution was added to the mixture and adjusted to 10 ml with distilled water. The reac-tion was kept in the dark for 90 min, after which the absorbance was read at 725 nm. Gallic acid was used to calculate the standard curve (0.01–0.08 mM;Y= 2.3725X+ 0.0021; R2= 0.1000) and the results were expressed as mg of gallic acid equivalents (GAEs) per kg of honey.
For flavonoid contents determination, the sample (250
l
L) was mixed with 1.25 ml of distilled water and 75l
L of a 5% NaNO2solution. After 5 min, 150
l
L of a 10% AlCl3H2O solution wasadded. After 6 min, 500
l
L of 1 M NaOH and 275l
L of distilled water were added to the mixture. The solution was mixed well and the intensity of pink colour was measured at 510 nm. (+)-Cat-echin was used to calculate the standard curve (0.022–0.34 mM;Y= 0.9990X 0.0497;R2= 0.9961) and the results were expressed as mg of (+)-catechin equivalents (CEs) per kg of honey.
For acid ascorbic determination, the sample (100 mg) was ex-tracted with 10 ml of 1% metaphosphoric acid for 45 min at room temperature and filtered through Whatman No. 4 filter paper.
Table 1
Characterisation of the monofloral honey samples.
Honey sample Family Scientific name Common name Local name Region
Light Laniaceae Rosmarinus officinalis Rosemary Rosmaninho Gimonde
Ambar Boraginaceae Echium vulgare Viper’s bugloss Erva viperina Bragança
The filtrate (1 ml) was mixed with 9 ml of 2,6-dichlorophenolindo-phenol and the absorbance was measured within 30 min at 515 nm against a blank. The content of ascorbic acid was calcu-lated on the basis of the calibration curve of authenticL-ascorbic
acid (0.020–0.12 mg/ml; Y= 3.2453X 0.0703; R2= 0.9963) and the results were expressed as mg of ascorbic acid/kg of honey.
For carotenoids determination, the sample (100 mg) was vigor-ously shaken with 10 ml of acetone–hexane mixture (4:6) for 1 min and filtered through Whatman No. 4 filter paper. The absor-bance of the filtrate was measured at 453, 505 and 663 nm. Con-tents of b-carotene and lycopene were calculated according to the following equations: lycopene (mg/100 ml) = 0.0458 A663+ 0.372 A505 0.0806 A453; b-carotene (mg/100 ml) = 0.216
A663 0.304 A505+ 0.452 A453. The results were expressed as mg
of carotenoid/kg of honey.
For reducing sugars quantification the DNS (dinitrosalicylic acid) method and glucose was used to calculate the standard curve (0.25–1.50 mg/ml;Y= 0.0009X 0.1809;R2= 0.9942); the results were expressed as g of reducing sugars/kg of honey.
2.6. Antioxidant activity
2.6.1. DPPH radical-scavenging activity
Various concentrations of water honey solutions or phenolic ex-tracts (0.3 ml) were mixed with 2.7 ml of methanolic solution con-taining DPPH radicals (610 5mol/l). The mixture was shaken
vigorously and left to stand for 60 min in the dark (until stable absorption values were obtained). The reduction of the DPPH radical was determined by measuring the absorption at 517 nm (Hatano, Kagawa, Yashura, & Okuda, 1988). The radical-scavenging activity (RSA) was calculated as a percentage of DPPH discolour-ation using the equdiscolour-ation: % RSA = [(ADPPH AS)/ADPPH]100,
whereASis the absorbance of the solution when the sample extract
has been added at a particular level andADPPHis the absorbance of
the DPPH solution. The extract concentration providing 50% of rad-icals scavenging activity (EC50) was calculated by interpolation
from the graph of RSA percentage against extract concentration. BHA and
a
-tocopherol were used as standards.2.6.2. Reducing power
Various concentrations of water honey solutions or phenolic ex-tracts (2.5 ml) were mixed with 2.5 ml of 200 mmol/l sodium phosphate buffer (pH 6.6) and 2.5 ml of 1% potassium ferricyanide. The mixture was incubated at 50°C for 20 min. After 2.5 ml of 10% trichloroacetic acid (w/v) was added, the mixture was centrifuged at 1000 rpm for 8 min (Centorion K24OR-2003 refrigerated centri-fuge). The upper layer (5 ml) was mixed with 5 ml of deionised water and 1 ml of 0.1% of ferric chloride, and the absorbance was measured spectrophotometrically at 700 nm: higher absorbance indicates higher reducing power (Oyaizu, 1986). The extract con-centration providing 0.5 of absorbance (EC50) was calculated by
interpolation from the graph of absorbance at 700 nm against ex-tract concentration. BHA and
a
-tocopherol were used as standards.2.6.3. Inhibition ofb-carotene bleaching
The antioxidant activity of water honey solutions or phenolic extracts was evaluated by theb-carotene linoleate model system. A solution ofb-carotene was prepared by dissolving 2 mg ofb
-car-otene in 10 ml of chloroform. Two millilitres of this solution were pipetted into a 100 ml round-bottom flask. After the chloroform was removed at 40°C under vacuum, 40 mg of linoleic acid, 400 mg of Tween 80 emulsifier, and 100 ml of distilled water were added to the flask with vigorous shaking. Aliquots (4.8 ml) of this emulsion were transferred into different test tubes containing 0.2 ml of different concentrations of the water honey solutions or phenolic extracts. The tubes were shaken and incubated at 50°C
in a water bath. As soon as the emulsion was added to each tube, the zero time absorbance was measured at 470 nm using a spectro-photometer. Absorbance readings were then recorded at 20-min intervals until the control sample had changed colour. A blank, de-void ofb-carotene, was prepared for background subtraction ( Mi-Yae, Tae-Hun, & Nak-Ju, 2003). Lipid peroxidation (LPO) inhibition was calculated using the following equation: LPO inhibition = (b -carotene content after 2 h of assay/initial b-carotene con-tent)100. The extract concentration providing 50% antioxidant
activity (EC50) was calculated by interpolation from the graph of
antioxidant activity percentage against extract concentration. TBHQ was used as standard.
2.6.4. Inhibition of lipid peroxidation using thiobarbituric acid reactive substances (TBARS)
Brains were obtained from pigs (Sus scrofa) with a body weight of150 kg, dissected and homogenised with a Polytron in ice-cold
Tris–HCl buffer (20 mM, pH 7.4) to produce a 1:2 (w/v) brain tissue homogenate which was centrifuged at 3000gfor 10 min. An aliquot (0.1 ml) of the supernatant was incubated with the water honey solutions or phenolic extracts (0.2 ml) in the presence of FeSO4
(10
l
M; 0.1 ml) and ascorbic acid (0.1 mM; 0.1 ml) at 37°C for 1 h. The reaction was stopped by the addition of trichloroacetic acid (28% w/v, 0.5 ml), followed by thiobarbituric acid (TBA, 2%, w/v, 0.38 ml), and the mixture was then heated at 80°C for 20 min. After centrifugation at 3000gfor 10 min to remove the pre-cipitated protein, the colour intensity of the malondialdehyde (MDA)–TBA complex in the supernatant was measured by its absorbance at 532 nm (Ng, Liu, & Wang, 2000). The inhibition ratio (%) was calculated using the following formula: Inhibition ratio (%) = [(A B)/A]100%, where A and B were the absorbance ofthe control and the sample solution, respectively. The extract con-centration providing 50% lipid peroxidation inhibition (EC50) was
calculated by interpolation from the graph of antioxidant activity percentage against extract concentration. BHA was used as standard.
2.7. Statistical analysis
The assays were carried out in triplicate and the results are ex-pressed as mean values and standard deviation (SD). The statistical differences represented by letters (Tables 2 and 3) were obtained through one-way analysis of variance (ANOVA) followed by Tu-key’s honestly significant difference post hoc test with
a
= 0.05, coupled with Welch’s statistic. Discriminant function analysis was done to determine which variables discriminate between the six naturally occurring groups (ELH, PLH, EAH, PAH, EDH and PDH). These treatments were carried out using SPSS v. 16.0 program.3. Results and discussion
inhibition ofb-carotene bleaching (by neutralising the linoleate-free radical and other linoleate-free radicals formed in the system which at-tack the highly unsaturatedb-carotene models), and inhibition of
lipid peroxidation in brain tissue (measured by the colour intensity of MDA–TBA complex).
From the analysis ofTable 2we can conclude that all the sam-ples revealed good lipid peroxidation inhibition measured in the TBARS assay (EC50 values lower than 2.5 mg/ml and lower than
the values obtained in the other antioxidant activity assays). Dark honey presented, in all the assays, better antioxidant activity (low-er EC50values) than the other honey samples (ambar and light). In
fact, the increase of the colour intensity seems to be related to an increase in the antioxidant properties and in the phenolic contents (Table 3). The entire dark honey (EDH, 727.77 mg/kg) and its phe-nolic extract (PDH, 204.24 mg/kg) revealed the highest phephe-nolic content, followed by the amber sample, and the light honey with the lowest values (226.16 mg/kg for the entire honey, ELH, and 132.17 mg/kg for the phenolic extract, PLH;Table 2).
A significantly higher phenolic content was observed in the en-tire samples when compared with their phenolic extracts obtained after separation with amberlite and elution with methanol. Pheno-lic compounds include different subclasses (flavonoids, phenoPheno-lic acids, stilbenes, lignans, tannins and oxidised polyphenols) dis-playing a large diversity of structures, some of which may escape the usual methodologies of analysis, commonly carried out by HPLC (high performance liquid chromatography) coupled to dis-tinct detection devices. Various reasons for this exist, such as the existence of isomers, difficulty for chromatographic separation of some compounds, lack of commercial standards, or the structure has not yet been elucidated (Georgé, Brat, Alter, & Amiot, 2005). The method of Folin–Ciocalteu’s is, therefore, largely used to eval-uate total phenolics despite all the interferences of this assay since the reagent (mixture of phosphotungstic acid and phosphomolib-dic acid) also reacts with other non-phenolic reducing compounds
leading to an overvaluation of the phenolic content. For instance, ascorbic acid is a widespread reducing agent that can interfere in the Folin–Ciocalteu reaction. Other reducing substances such as some sugars and amino acids could also interfere. (Georgé et al., 2005). In fact, the honey samples contain some of these com-pounds as well as other antioxidants (Table 4) that can lead to an increase in the absorbance values and to positive errors in the determination of phenolics by the Folin–Ciocalteu method. From the analysis ofTable 4we can also conclude that dark honey con-tain the highest concentrations of other antioxidants such as flavo-noids (587.42 mg/kg), ascorbic acid (145.80 mg/kg) andb-carotene (9.49 mg/kg), which can also contribute to the better antioxidant properties observed in this sample. No significant statistical differ-ence between the sugar contents in the different honeys was ob-served. All the samples presented a very high percentage of sugars (75%) as was already expected because these compounds
are the most abundant nutrients in honey (Mendes, Proença, Ferre-ira, & FerreFerre-ira, 1998).
The better scavenging activity and lipid peroxidation inhibition showed by the phenolic extracts in comparison to the entire hon-eys proved once more, that other substances than phenols might be present in the entire samples. This fact is also supported by the higher correlation coefficients obtained for the phenolic ex-tracts (Table 3). Only in the case of the reducing power assay was there higher EC50values (lower reducing power) for the
phe-nolic extracts in comparison to the entire honeys (Table 2). This is probably due to the presence of sugars in the entire samples which have good reducing capacity (e.g. glucose and fructose) and, therefore, contribute to higher reducing power values than the values obtained in the phenolic extracts.
In order to determine which variables discriminate between the six naturally occurring groups (ELH, PLH, EAH, PAH, EDH and PDH) a discriminant function analysis was carried out, following the stepwise method. In stepwise discriminant function analysis, the
Table 2
Total phenolics (mg/kg) and EC50values (mg/ml) obtained for the antioxidant activity of the honey samples (mean ± SD;n= 3). In each column different letters mean significant
differences (p< 0.05).
Samples Phenolics DPPH scavenging activity Reducing power b-Carotene bleaching inhibition TBARS assay
Light honey Entire (ELH) 226.16 ± 0.22 c 168.94 ± 19.20 a 48.95 ± 1.61 d 75.51 ± 0.04 a 2.47 ± 0.03 a
Phenolic extract (PLH) 132.17 ± 0.05 f 90.78 ± 5.10 c 94.11 ± 1.95 a 23.61 ± 2.85 c 0.96 ± 0.02 d
Ambar honey Entire (EAH) 406.23 ± 17.22 b 130.49 ± 1.38 b 17.95 ± 0.60 e 39.25 ± 0.17 b 1.92 ± 0.05 b
Phenolic extract (PAH) 168.44 ± 1.99 e 88.53 ± 18.26 c 80.48 ± 0.20 b 12.01 ± 0.96 d 0.71 ± 0.01 e
Dark honey Entire (EDH) 727.77 ± 0.23 a 106.67 ± 2.48 bc 13.26 ± 0.20 f 37.03 ± 0.01 b 1.75 ± 0.04 c
Phenolic extract (PDH) 204.24 ± 0.63 d 84.98 ± 1.19 c 73.50 ± 0.03 c 12.13 ± 1.38 d 0.58 ± 0.02 f
Table 3
Correlations established between phenolics and antioxidant activity EC50values.
Antioxidant activity assay Entire honey Phenolic extract
Equation R2 F p Equation R2 F p
DPPH scavenging activity y= 0.118x+ 188.980 0.915 10.741 0.188 y= 0.080x+ 101.637 0.982 56.042 0.084
Reducing power y= 0.064x+ 55.96 0.714 2.502 0.359 y= 0.286x+ 130.8 0.967 30.065 0.115
b-Carotene bleaching inhibition y= 0.068x+ 81.65 0.649 1.852 0.403 y= 0.159x+ 42.78 0.746 2.936 0.336
TBARS assay y= 0.001x+ 2.645 0.802 4.061 0.293 y= 0.005x+ 1.646 0.966 29.014 0.117
Table 4
Other antioxidant compounds present in the honey samples (mean ± SD;n= 3). In each column different letters mean significant differences (p< 0.05).
Samples Flavonoids (mg/kg) Ascorbic acid (mg/kg) b-Carotene (mg/kg) Lycopene (mg/kg) Reducing sugars (g/kg)
Light honey 123.62 ± 0.17 c 140.01 ± 0.05 c 9.32 ± 0.01 a 6.55 ± 0.01 a 753.23 ± 22.47 a
Ambar honey 342.70 ± 1.72 b 143.86 ± 1.16 b 8.64 ± 0.06 b 6.19 ± 0.00 b 725.89 ± 5.81 a
model of discrimination is built step by step. At each step, all vari-ables are reconsidered to find which one will contribute most to the discrimination between groups. That variable will then be in-cluded in the model, restarting the process. The values ofFto enter (3.84) andFto remove (2.71) are the guidelines of the stepwise procedure. A variable is entered into the model if itsF-value is greater than theF-enter value and its removed if theF-value is less than theF-remove value.F-enter must be greater thanF-remove, and both values must be positive. TheF-value for a variable indi-cates its statistical significance in the discrimination between groups. Discriminant analysis defines an optimal combination of varieties in a way that the first function furnishes the most general discrimination between groups, the second provides the second most, and so on (Benitez, Nogales, Campos, & Ruano, 2006).Table 5shows the results from applying the algorithm for selecting hon-ey samples according with colour intensity and extraction method. Wilk’s Lambda is a variable selection method for stepwise discrim-inant analysis that chooses variables for entry into the equation on the basis of how much they lower Wilk’s Lambda. At each step, the variable that minimises the overall Wilk’s Lambda is entered.
Tolerance is the proportion of a variable’s variance not ac-counted by other independent variables in the equation. If it is low, it will contribute little information to the model and might cause problems.
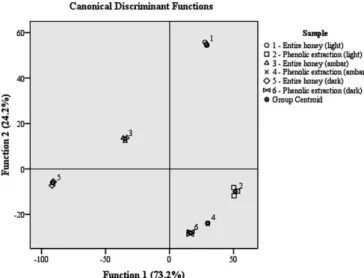
The discriminant analysis (DA) defined four dimensions, but only the first two explained 97.5% of the observed variance, so only they were considered in the canonical analysis (Fig. 1). The first DA dimension separates mainly EDH and EAH from the other samples (means of the canonical variance: EDH = 91.142, EAH = 34.756, ELH = 28.621, PLH = 51.197, PAH = 29.787 and PDH = 16.294), and was more strongly correlated with reducing power and phenolic content. This result confirmed that there is a direct correlation be-tween phenolic content and colour intensity. The second DA dimension reveals the separation of ELH, PLH and PDH (means of
the canonical variance: ELH = 54.925, PLH = 9.032 and PDH = 28.078), and proved to be more accurately correlated withb -car-otene bleaching inhibition and TBARS formation inhibition.
Overall, it can be concluded that the samples submitted to phe-nolic extraction clustered proximately being well separated from the entire honeys (Fig. 1). The proximity of all the extracted sam-ples indicate that a methanolic extraction after separation in Amberlite led to more reliable and accurate antioxidant activity re-sults in a non-honey type dependent manner. The use of the whole extract instead of individual antioxidants allows advantage to be taken of additive and synergistic effects of different phenolic com-pounds present in the samples. This effect is more easily seen in the phenolic extracts than in the entire honey, once the extracted compounds should be structurally related and therefore, responsi-ble for similar biological properties.
Acknowledgement
The authors are grateful to Foundation for Science and Technol-ogy (PTDC/AGR-ALI/68284/2006 project) for financial support of this work.
References
Aljadi, A. M., & Kamaruddin, M. Y. (2004). Evaluation of the phenolic contents and antioxidant capacities of two Malaysian floral honeys. Food Chemistry, 85, 513–518.
Al-Mamary, M., Al-Meeri, A., & Al-Habori, M. (2002). Antioxidant activities and total phenolics of different types of honey.Nutrition Research, 22, 1041–1047. Antony, S. M., Han, I. Y., Rieck, J. R., & Dawson, P. L. (2000). Antioxidative effect of
Maillard reaction products formed from honey at different reaction times. Journal of Agricultural and Food Chemistry, 48, 3985–3989.
Baltrušaityte, V., Venskutonis, P. R., & Cˇeksteryt, V. (2007). Radical scavenging activity of different floral origin honey and beebread phenolic extracts.Food Chemistry, 101, 502–514.
Barros, L., Calhelha, R. C., Vaz, J. A., Ferreira, I. C. F. R., Baptista, P., & Estevinho, L. M. (2007). Antimicrobial activity and bioactive compounds of Portuguese wild edible mushrooms.European Food Research and Technology, 225, 151–156. Benitez, E., Nogales, R., Campos, M., & Ruano, F. (2006). Biochemical variability of
olive–orchard soils under different management systems.Applied Soil Ecology, 32, 221–231.
Beretta, G., Granata, P., Ferrero, M., Orioli, M., & Facino, R. M. (2005). Standardization of antioxidant properties of honey by a combination of spectrophotometric/ fluorimetric assays and chemometrics.Analytica Chimica Acta, 533, 185–191. Bertoncelj, J., Doberšek, U., Jamnik, M., & Golob, T. (2007). Evaluation of the phenolic
content, antioxidant activity and colour of Slovenian honey.Food Chemistry, 105, 822–828.
Buratti, S., Benedetti, S., & Cosio, M. S. (2007). Evaluation of the antioxidant power of honey, propolis and royal jelly by amperometric flow injection analysis.Talanta, 71, 1387–1392.
Castaldo, S., & Capasso, F. (2002). Propolis, an old remedy used in modern medicine. Fitoterapia, 73, S1–S6.
Chen, L., Mehta, A., Berenbaum, M., Zangerl, A. R., & Engeseth, N. J. (2000). Honeys from different floral sources as inhibitors of enzymatic browning in fruit and vegetable homogenates. Journal of Agricultural and Food Chemistry, 48, 4997–5000.
Cherbuliez, T., & Domerego, R. (2003).L’apitherapie, Médecine des abeilles. Editions Amyris.
Crane, E. (1975).Honey: A comprehensive survey. New York, USA: Crane Russak and Company.
FAO (1996). Value-added products from beekeeping. FOA Agricultural Services Bulletin. Rome, Italy: FAO.
Ferreres, F., Tomas-Barberan, F. A., Soler, C., & Garcia-Vigera, C. (1994). A simple extractive technique for honey flavonoid HPLC analysis.Apidologie, 25, 21–30. Georgé, S., Brat, P., Alter, P., & Amiot, M. J. (2005). Rapid determination of
polyphenols and vitamin C in plant-derived products.Journal of Agricultural and Food Chemistry, 53, 1370–1373.
Table 5
The four most important parameters defined for discrimination between honey samples and extraction method considering antioxidant activity and phenolic content.
Wilks’ Lambda F-Remove (2.71) p-Level Tolerance 1-Tolerance (R2)
Phenolics 0.0000 686.5187 0.0000 0.5875 0.4125
TBARS assay 0.0000 35.8342 0.0000 0.5712 0.4288
Reducing power 0.0000 183.8875 0.0000 0.8052 0.1948
b-Carotene bleaching inhibition 0.0000 40.9027 0.0000 0.8676 0.1324
Gheldof, N., & Engeseth, N. J. (2002). Antioxidant capacity of honeys from various floral sources based on the determination of oxygen radical absorbance capacity and inhibition of in vitro lipoprotein oxidation in human serum samples.Journal of Agricultural and Food Chemistry, 50, 3050–3055.
Gheldof, N., Wang, X., & Engesetg, N. (2001). Characterization of the antioxidants in honeys from different floral sources.Presented at Annual Meeting, Institute of Food Technologists, Dallas, USA, 11–14 June.
Gheldof, N., Wang, X. H., & Engeseth, N. J. (2002). Identification and quantification of antioxidant components of honeys from various floral sources. Journal of Agricultural and Food Chemistry, 50, 5870–5877.
Gülçin, I., Büyükokurog˘lu, M. E., Oktay, M., & Küfreviog˘lu, Ö. I. (2003). Antioxidant and analgesic activities of turpentine ofPinus nigraArn Subsp. pallsiana (Lamb.) Holmboe.Journal of Ethnopharmacology, 86, 51–58.
Hatano, T., Kagawa, H., Yashura, T., & Okuda, T. (1988). Two new flavonoids and other constituents in licorice root: Their relative astringency and radical scavenging effects.Chemical Pharmaceutical Bulletin, 36, 2090–2097. Ioyrish, N. (1974).Bees and people. Moscow, USSR: MIR Publisher.
Kefalas, P., Gotsiou, P., & Chougoui, N. (2001).Contribution to the identification of Greek honey. International Honey Commission. Athens Meeting.
Küçük, M., Kolaylı, S., Karaog˘lu, S., Ulusoy, E., Baltacı, C., & Candan, F. (2007). Biological activities and chemical composition of three honeys of different types from Anatolia.Food Chemistry, 100, 526–534.
Marcucci, M. C. (1995). Propolis: Chemical composition, biological properties and therapeutic activity.Apidologie, 26, 83–99.
McCarthy, J. (1995). The antibacterial effects of honey: Medical fact or fiction? American Bee Journal, 135, 341–342.
McKibben, J., & Engeseth, N. J. (2002). Honey as a protective agent against lipid oxidation in ground turkey.Journal of Agricultural and Food Chemistry, 50, 592–595.
Meda, A., Lamien, C. E., Romito, M., Millogo, J., & Nacoulma, O. G. (2005). Determination of the total phenolic, flavonoid and proline contents in Burkina Fasan honey, as well as their radical scavenging activity.Food Chemistry, 91, 571–577.
Mendes, E., Proença, E., Ferreira, I., & Ferreira, M. A. (1998). Quality evaluation of Portuguese honey.Carbohydrate Polymers, 37, 219–223.
Mi-Yae, S., Tae-Hun, K., & Nak-Ju, S. (2003). Antioxidants and free radical scavenging activity of Phellinus baumii (Phellinus of Hymenochaetaceae) extracts. Food Chemistry, 82, 593–597.
Molan, P. C. (1992). The antibacterial activity of honey. 1: The nature of antibacterial activity.Bee World, 73, 5–28.
Mundo, M. A., Padilla-Zakour, O. I., & Worobo, R. W. (2004). Growth inhibition of foodborne pathogens and food spoilage organisms by select raw honeys. International Journal of Food Microbiology, 97, 1–8.
Nagai, T., Inoue, R., Kanamori, N., Suzuki, N., & Nagashima, T. (2006). Characterization of honey from different floral sources. Its functional properties and effects of honey species on storage of meat.Food Chemistry, 97, 256–262.
Nagai, T., Sakai, M., Inoue, R., Inoue, H., & Suzuki, N. (2001). Antioxidative activities of some commercially honeys, royal jelly, and propolis.Food Chemistry, 75, 237–240.
Ng, T. B., Liu, F., & Wang, Z. (2000). Antioxidative activity of natural products from plants.Life Sciences, 66, 709–723.
Orhan, F., Sekerel, B. E., Kocabas, C. N., Sackesen, C., Adaliog˘lu, G., & Tuncer, A. (2003). Complementary and alternative medicine in children with asthma. Annals of Allergy, Asthma, and Immunology, 90, 611–615.
Oyaizu, M. (1986). Studies on products of browning reactions: Antioxidative activities of products of browning reaction prepared from glucosamine. Japanese Journal of Nutrition, 44, 307–315.
Prior, R. L., Wu, X. L., & Schaich, K. (2005). Standardized methods for the determination of antioxidant capacity and phenolics in foods and dietary supplements.Journal of Agricultural and Food Chemistry, 53, 4290–4302. Schepartz, A. I. (1966). Honey catalase: Occurrence and some kinetic properties.
Journal of Apiculture Research, 5, 167–176.
Schramm, D. D., Karim, M., Schrader, H. R., Holt, R. R., Cardeti, M., & Keen, C. L. (2003). Honey with high levels of antioxidants can provide protection to healthy human subjects. Journal of Agricultural and Food Chemistry, 51, 1732–1735.
Taomina, P. J., Niemira, B. A., & Beuchat, L. R. (2001). Inhibitory activity of honey against foodborne pathogens as influenced by the presence of hydrogen peroxide and level of antioxidant power. International Journal of Food Microbiology, 69, 217–225.
The National Honey Board (2003). Honey-Health and therapeutic qualities. Lashley Street Longmont, <http://www.nhb.org>.
Vit, P., Soler, C., & Tomas-Barberan, F. A. (1997). Profiles of phenolic compounds of Apis mellifera and Melipona spp. honeys from Venezuela. Zeitschrift fur Lebensmittel-Untersuchung und-Forschung A, 204, 43–47.
White, J. W. (1979). Composition of honey. In E. Crane (Ed.),Honey: A comprehensive survey(pp. 157–158). London: Heinemann.