O PAPEL DA INOVAÇÃO PARA ALAVANCAR O DESENVOLVIMENTO REGIONAL Fábio de Oliveira Paula
Professor Assistente na Pontífica Universidade Católica do Rio de Janeiro (PUCRIO) Rio de Janeiro, RJ, Brasil
Email: fabioop@iag.puc-rio.br Jorge Ferreira da Silva
Professor Titular na Pontífica Universidade Católica do Rio de Janeiro (PUCRIO) Rio de Janeiro, RJ, Brasil
Email: shopshop@iag.puc-rio.br
ABSTRACT RESUMO
Innovation exerts a central influence on the economy in every level: firm, industry, region, country and globally. Academics in business management have extensively explored the importance of the development of innovation for the firm, as well as for the industry. Studies at the regional level, in their turn, are more scarce. The primary goal of this paper is to verify the influence of product and process innovations introduced by the firms in a region on its economic development, considering as regions the states of Brazil. Using least square panel regression, we found that process innovation influences GDP growth positively after five years, corroborating the hypothesis that the effect of innovation is positive and takes some time to be perceived, with process innovation being faster than product innovation.
A inovação exerce uma influência central na economia em todos os níveis: empresa, indústria, região, país e globalmente. Acadêmicos em gestão de
negócios têm explorado extensivamente a
importância do desenvolvimento de inovação para a empresa, bem como para a indústria. Estudos em nível regional, por sua vez, são mais escassos. O objetivo principal deste trabalho é verificar a influência das inovações de produto e processo introduzidas
pelas empresas de uma região em seu
desenvolvimento econômico, considerando como regiões os estados do Brasil. Utilizando least squares
panel regression, descobrimos que a inovação de
processo influencia positivamente o crescimento do PIB após cinco anos, corroborando a hipótese de que o efeito da inovação é positivo e leva algum tempo para ser percebido, com a inovação do processo sendo mais rápida do que a inovação de produto.
Keywords: Product Innovation. Process Innovation.
Regional Development. Economic Development. GDP Growth.
Palavras-chave: Inovação de Produto. Inovação de
Processo. Desenvolvimento Regional. Desenvolvimento Econômico. Crescimento do PIB.
INTRODUCTION
The influence of innovation, especially product and process innovation, on firms’ performance has been widely investigated by the business literature (CHENG; HUIZINGH, 2014; FAEMS; VAN LOOY; DEBACKERE, 2005). The uncertainty of the environment, in which future changes may not be predicted, imposes firms to innovate in order to compete efficiently (GOERZEN, 2007; TEECE, 2007). New industries emerge while old ones disappear by the effect of disruptive innovations that are usually introduced by new entrants that end up taking incumbents out of the market (CHRISTENSEN, 2013). However, the benefits of innovation for one firm individually or a group of firms does not automatically promote growth in the whole industry’s performance or regional development. Although this relationship seems intuitive, the fact that new entrants are growing while old incumbents are perishing may promote a raise or a decay on local income. Besides possibly promoting a decline in local income, another possible negative consequence is that process innovations may cause automation that destroys jobs and raises unemployment. These facts make clear the importance to study the effects of the introduction of innovation by the firms on the regional level. This importance is potentiated nowadays by the growing relevance given to business sustainability, which corresponds to a vision that firms have a social role to contribute for society, and not only generating an attractive return for its shareholders.
Nevertheless, observable facts allow supposing the existence of a direct relationship between innovation and regional development. The Brazilian projected 2017 nominal GDP per capita is $10,309 (STATISTICS TIMES, 2018), positioning the country as the 65th among all countries worldwide. This position is similar to the Brazilian place in the 2016 Global Innovation Index ranking (GII), which is 69th (DUTTA; LAVINN; WUNSH-VINCENT, 2016). On the other hand, the 23 leaders of the GII ranking are among the 30 countries with higher projected 2017 nominal GDP per capita with an average of $51,135 (STATISTICS TIMES, 2018). A similar pattern in the relationship between the GII and GDP per capita may be observed for the other countries of the list. Despite this apparent correlation between innovation and GDP per capita, causality is not easily identified as a country may become innovative as a result of an increase in its wealth (ORIHATA, 2001). Therefore, this relationship should be more deeply investigated to check if this correlation and causality exist.
Inequality among country regions is very high in Brazil. The state of São Paulo has a GDP per capita almost four times higher than the state of Maranhão; R$43,695 versus R$11,366 according to IBGE (2017). If innovation is a trigger for regional development, understanding this relationship may bring lessons that may help the Government and policy formulators to propose public policies to boost innovation and economic growth in all parts of Brazil. To achieve this goal, we try to answer the following research question: What is the impact of the level of introduction of product and process innovation by the firms in the economic development of the Brazilian states?
To answer the research question presented above, this paper formulated two hypotheses investigating the relationships between the introduction of product and process innovation and GDP growth (which is the proxy used for economic development). Using panel data from 15 Brazilian states, this empirical study found that the introduction of process innovation by the firms of a state together is more effective in promoting GDP growth than product innovation in a shorter period. This study contributes to the literature as prior studies were
more focused in developed countries and, to the best of our knowledge, did not focus on investigating the relationship between innovation and GDP growth with different lags (in this study, we investigated time-lags from one to five years) to capture the maturation of the innovations introduced.
This paper is structured as follows: first, we present the literature review, in which the research hypotheses are formulated; next, the methodology section contains a description of the data, of the sample selection and variables, and explains the statistical method. It is followed by the description of the results and a discussion. Finally, we present the conclusions, with academic and managerial implications, limitations and suggestions for future research.
LITERATURE REVIEW
According to several authors, the introduction of innovation by local firms is one of the main factors to promote regional development and economic growth (AHLSTROM, 2010; DOMENECH; ESCAMILLA; ROIG-TIERNO, 2016; HOWELLS, 2005; KISELITSA; SHILOVA; LIMAN, 2017; PORTER, 2003; SHEFER; FRENKEL, 2005). This relationship was observed in empirical studies of several developing countries such as Poland, Hungary, Romania, Greece, Bulgaria (JEMALA, 2017) and Russia (KISELITSA et al., 2017). This relationship was supported even in studies analyzing some of the lowest developed and innovative regions, such as some African countries (Van Aardt Smit, 2017). In a study with several European nations, Brécard et al. (2006) found that R&D investments initially drive economic growth, but in a more advanced phase, the actual generation of innovation is the primary driver through gains of productivity and competitiveness. Gumbau Albert (2017) found that some regions of Spain with a high presence of more technology-intensive start-ups felt more the effects of innovation on economic performance than some regions with low technology-intensive start-ups. Similar findings were achieved by Heidenreich (2009) in a study of 270 regions from 27 European countries. Moutinho et al. (2015), in an empirical study of 158 regions from 18 European countries, identified that technological capacity enhancement, which is strongly related to the innovation capacity of the whole region, is effective for reducing unemployment without threatening sustainable economic development. Trinh (2017) stated that economic growth (measured as GDP growth) is improved by capital (physical and human) accumulation and technological innovation. Technological innovation would shift up the capital accumulation versus GDP growth curve, allowing that, among two regions with the same capital accumulation level, the one with a higher technological innovation rate would have higher GDP growth.
Although the relationship between innovation rates and economic growth seems intuitive, some arguments may indicate the opposite. More innovative firms in a region may take some less innovative firms out of the market (CHRISTENSEN, 2013), provoking the loss of some jobs and of sources of tax collection for the government. Process innovations that promote the automation of the production process may destroy jobs inside the firm. However, some reasons account for the existence a positive balance in this tradeoff. Innovation allows the creation of new firms and expansion of old ones (SCHEFER; FRENKEL, 2005). Product innovation enables the introduction of new products into more markets (GALINDO; MÉNDEZ, 2014), which create new demands or fill demand gaps (BEUGELSDIJK, 2010), allowing to increase revenues. Process innovation increases workers’ productivity (TERJESEN; PATEL, 2017), and transforms fixed costs into variable costs, enabling cost reduction (MOUTINHO et al., 2015). And both types of innovation allow the accumulation of
knowledge (BEUGELSDIJK, 2010). These facts make innovative firms “more competitive…create more jobs, pay higher wages and more taxes” (RUTTEN; BOEKEMA, 2007, p. 1843) than less innovative firms, bringing more return regarding regional economic growth. Also, as firms do not compete only inside their regions, but with firms of other parts of the nation or even have global competitors, firms that may go out of the market are not necessarily from the same area. These factors indicate that the more innovative the firms of a region are, the more developed the region tends to be.
Innovation performance of firms increases with a balance between high internal R&D investment, highly educated human resources and an active collaboration with different types of partners, e.g., suppliers, competitors, clients, universities and the government (PAULA; SILVA, 2017). The combination of all these factors promotes knowledge creation and economic growth not only for the focal firm but for all the actors, many of them located close to each other and forming a complex regional innovation network – RIN (RUTTEN; BOEKEMA, 2007). According to Rutten and Boekema, RINs organize the innovation development inside the region and stimulates the conversion of innovation developed by local firms into regional development. This relationship is observed because innovation developed inside RINs influence the emergence of new industries in the region (GJELSVIK, 2018), which brings new businesses, new jobs and new sources of tax collection for the local government (AHLSTROM, 2010). Besides, innovative efforts made by firms embedded in the regional social network and through intense collaboration improve innovation performance of the network as a whole and foment the emergence of a more trained and well-paid labor force, stimulating regional growth (ETZKOWITZ; KLOFSTEN, 2005).
According to Domenech et al. (2016), an innovative region has innovative firms, innovation enablers and have a high innovation performance. An innovative region has the capacity of moving across different technologies and renew itself when it is necessary (ETZKOWITZ; KLOFSTEN, 2005). It also generates a creative and innovative atmosphere that stimulates the discovery of new opportunities and favors the emergence of entrepreneurs capable of transforming knowledge into innovation and contribute to economic growth (CAPELLO; LENZI, 2016). The mechanism that allows this contribution is the knowledge spillover that occurs from the firm or the network of firms that invested intensely on R&D for the local industries they compete and for the region as a whole. It expands the opportunities related to technology and leverages the capacity to recognize and exploit new business opportunities in general (MOUTINHO et al., 2015). One common way innovative regions organize itself and its RIN is by clusters specialized in one or some closely related industrial sector (GIULIANI; BELL, 2005). This concentration in related industrial sectors enhances growth (HOWELL, 2005). In South America, we have the innovative wine industrial clusters in Chile (GIULIANI; BELL, 2005), and in Mendoza, Argentine (LAZZARINI, 2015). Both are more successful than other wine clusters in the continent because of their integration, knowledge diffusion throughout the network and, in consequence, innovative capacity.
The capacity of a region to benefit from innovation have a cumulative nature (HOWELLS, 2005). It may be related to the proper cumulativeness of innovation capabilities of firms, which are developed by an accumulation of experiences and knowledge from generating simpler innovations and improving gradually the complexity until they can develop more radical and profitable innovations (BELL; FIGIEIREDO, 2012). It causes a delay between the innovation introduction and economic results for both product and process innovation. At the same time, product and process innovations are of complementary nature (UTTERBACK;
ABERNATHY, 1975), as radical product innovations that create a new market or fill a market gap have a maturation process that requires cost reduction for gaining scale. Thereby, the introduction of both types of innovation is necessary, although process innovation is viewed as less glamorous (KEUPP; PALMIE; GASSMANN, 2011), and is less focused by Brazilian firms than product innovation. The Utterback and Abernathy cycle indicate that radical product innovation comes first and process innovations are more incident in later and more mature phases of the new product lifecycle, in which the product will bring more return to the firm. Considering all innovations introduced in a region, we may expand this conclusion to a higher level of analysis and consider that the set of process innovations developed by the firms in a region are related to economic growth in a shorter period, compared with the set of product innovations.
H1: The level of product innovations introduced by local firms have a positive influence on the medium and
long-term regional economic development.
H2: The level of process innovations introduced by the local firms have a positive influence on the medium and
long-term regional economic development. This effect is perceived faster in the case of process innovation than in the case of product innovation.
METHOD
The empirical analysis used data of innovation from the aggregated tables of PINTEC - Brazilian Innovation Survey (IBGE, 2016), conducted by IBGE (Brazilian Institute of Geography and Statistics), which investigates innovation activities undertaken by firms and based on innovation concepts proposed by the Oslo Manual (OECD, 2005). GDP data was also gathered from IBGE (IBGE, 2017). The panel data was set up with the data corresponding the percentage of firms that introduced product and process innovation by state from all PINTEC surveys (2000, 2003, 2005, 2008, 2011, and 2014). The states with information on the aggregated tables of PINTEC were Amazonas, Bahia, Ceará, Distrito Federal, Espírito Santo, Goiás, Mato Grosso, Minas Gerais, Pará, Paraná, Pernambuco, Rio de Janeiro, Rio Grande do Sul, Santa Catarina, and São Paulo. We decided to exclude Distrito Federal as it the federal capital city and has characteristics of an outlier. Not all states are covered in PINTEC, and not all of the covered ones have data in the six versions of the survey. For that reasons, our panel had a total of 63 observations. The statistical techniques utilized to run the model treat this type of absence of data in the panel. GDP growth by state, on the other hand, could be obtained for every year.
The dependent variable of the study is GDP growth (calculated using GDP in USD) from one year compared to the last one (GDP_Grw), representing the economic development rate of the state in one year. Several authors argue that economic growth is an essential mechanism for improving people’s life quality (Ahlstrom, 2010), which reinforces the choice of GDP growth as a proxy for economic development. As will be described next, the model tests GDP growth with five different time-lags. from year + 1 to year + 5. It means that the innovation data from PINTEC 2000, for example, will be tested with GDP growth of 2001 compared to 2000, up to GDP growth of 2005 compared to 2004. When the innovation data do not have the corresponding
GDP growth for some of the time-lags, it will not be used in the regression. It is the case, for instance, of PINTEC 2014, which have GDP growth available only for year + 1 and year + 2.
The dependent variables consist in the percentage of the total of PINTEC’s respondent firms that introduced a product or process innovation that were new to the Brazilian market in three years, being the year of the research and the two previous ones (Inov_Prod/Tot and Inov_Proc/Tot). As control variable, we used the GDP growth of the previous year compared to the GDP growth used as dependent variable.
For estimating GDP_Grw from year + 1 to year + 5, we run five separate models, one for the GDP_Grw of each year. The equation used for the estimation may be written as follows, with i varying from 1 to 5 for each model:
(I) GDP_Grwy+i = βa0 + βa1* GDP_Grwy+i-1 + βa2 * Inov_Prod/Tot + βa3 * Inov_Proc/Tot + ℇ
Using the Least Squares (LS) method, we tested a pooled regression model, cross-section and period fixed effects and cross-section and period random effects for all equations. The adjusted R2 was better with period fixed effects in all of them. Wald tests, to check if all dummies representing the fixed effects are zero, followed by Hausmann tests (HAUSMANN, 1978), to verify the presence of random effects, also confirmed that period fixed effects were more appropriate for our data. Durbin-Watson tests were also conducted to verify autocorrelations of residuals and rejected the hypothesis of their presence.
RESULTS
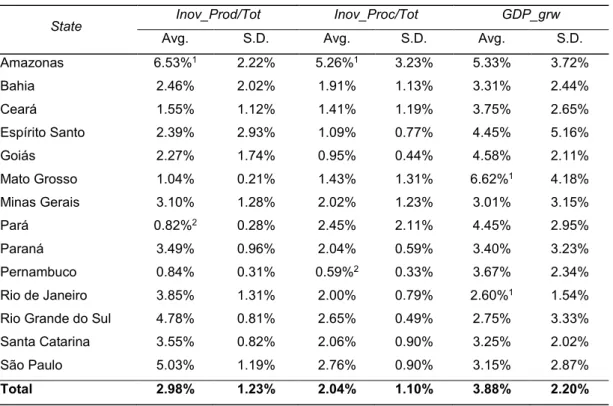
Table 1 presents some characteristics of the sample. It shows the average and standard deviations of Inov_Prod/Tot, Inov_Proc/Tot by state in the six surveys, and of GDP_grw from 2000 to 2014. The state that scored higher and lower in each variable was also highlighted. The average proportion of firms that introduced product innovation in all states is 2.98%. On its turn, the average percentage of firms that introduced process innovation is 2.04%, a little more than two-thirds compared to product innovation. The average GDP growth from 2000 to 2014 was 3.88%, slightly higher than the average GDP growth of the country in the period, which was 3.37% This difference occurs as not all Brazilian states are available in our sample and the average of 3.88% is not weighted by the total population of each state.
Amazonas has the higher proportion of introduction of process and product innovation on average (Inov_Prod/Tot of 6.53% and Inov_Proc/Tot of 5.26%). It is possibly an effect of several multinationals installed in the region and its suppliers because of the taxes advantages guaranteed by its capital (Manaus) status as a Free Economic Zone, which has a concentration of TV, audio and video, cell phones, computers and motorcycles’ manufacturers (SUFRAMA, 2018). On the opposite are North and Northeast states such as Pará with Inov_Prod/Tot of 0.82%, being in the last position in this indicator, and Pernambuco with Inov_Proc/Tot of 0.59%. Considering GDP growth, the state of Mato Grosso has the highest average (6.62%), while Rio de Janeiro is in the last position, with 2.60% on average.
Table 1: Characteristics of the sample
State Inov_Prod/Tot Inov_Proc/Tot GDP_grw
Avg. S.D. Avg. S.D. Avg. S.D.
Amazonas 6.53%1 2.22% 5.26%1 3.23% 5.33% 3.72% Bahia 2.46% 2.02% 1.91% 1.13% 3.31% 2.44% Ceará 1.55% 1.12% 1.41% 1.19% 3.75% 2.65% Espírito Santo 2.39% 2.93% 1.09% 0.77% 4.45% 5.16% Goiás 2.27% 1.74% 0.95% 0.44% 4.58% 2.11% Mato Grosso 1.04% 0.21% 1.43% 1.31% 6.62%1 4.18% Minas Gerais 3.10% 1.28% 2.02% 1.23% 3.01% 3.15% Pará 0.82%2 0.28% 2.45% 2.11% 4.45% 2.95% Paraná 3.49% 0.96% 2.04% 0.59% 3.40% 3.23% Pernambuco 0.84% 0.31% 0.59%2 0.33% 3.67% 2.34% Rio de Janeiro 3.85% 1.31% 2.00% 0.79% 2.60%1 1.54%
Rio Grande do Sul 4.78% 0.81% 2.65% 0.49% 2.75% 3.33%
Santa Catarina 3.55% 0.82% 2.06% 0.90% 3.25% 2.02%
São Paulo 5.03% 1.19% 2.76% 0.90% 3.15% 2.87%
Total 2.98% 1.23% 2.04% 1.10% 3.88% 2.20%
1State with the highest score in the variable 2State with the lowest score in the variable
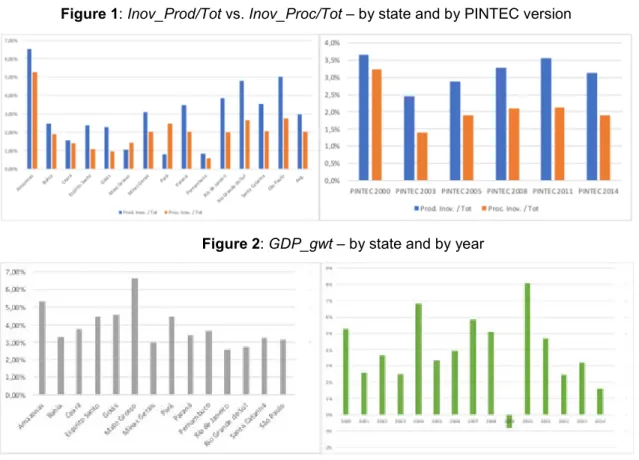
Figure 1 shows the bar diagrams of the percentage of product and process innovation introduction among the firms by state and by version of the PINTEC survey. It is clear that product innovation (blue bars) has a higher prevalence than process innovation (orange bars). In the diagram by PINTEC version, one may also notice that the in the first survey (from 2000), the introduction of product and process innovation was higher than in the subsequent periods. It followed by a decrease in 2003 (mainly process innovation), and after 2003, there is an increasing tendency. Figure 2 shows the bar diagrams of GDP growth by state and by year from 2000 to 2014. The behavior of GDP growth by year seems random, but always positive (with the exception of 2009, that followed the 2008 global crisis), however, since 2010, in which the growth of GDP was significant, up to 2014, a decreasing tendency seems to prevail.
Figure 3 shows the tendency curves of the average of all states in the sample of the variables Inov_Prod/Tot, Inov_Proc/Tot, and GDP_grw. Inov_Prod/Tot tendency seems almost steady in all surveys, from 2000 to 2014, increasing slightly through the period. On the other hand, Inov_Proc/Tot and GDP_grw are decreasing through time. It may indicate a possible correlation between these two variables.
Figure 1: Inov_Prod/Tot vs. Inov_Proc/Tot – by state and by PINTEC version
Figure 2: GDP_gwt – by state and by year
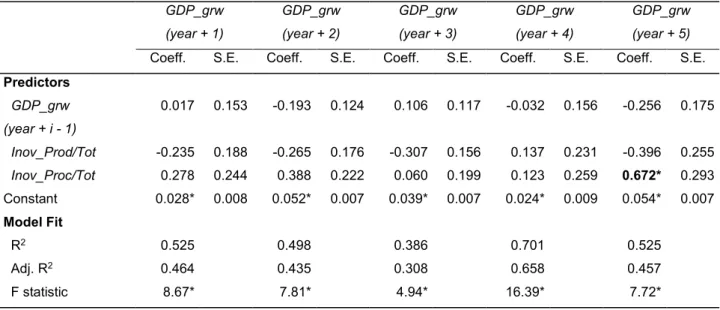
However, the similar slopes of the tendency curves of Inov_Proc/Tot and GDP_grw and the different slope from the tendency curve of Inov_Prod/Tot of does not allow us to infer anything about the hypotheses as they consider the existence of a time-lag between the introduction of innovation and growth. The panel LS tests the hypotheses as they make five regressions with future GDP_grw as the dependent variable with different time-lags: from one to five years. The results of the regressions rejected hypothesis 1, which proposed that the highest the proportion of firms that introduce product innovation, the higher the future regional growth. None of the five regressions indicated a significant relationship of Inov_Prod/Tot and GDP_grw in up to five years for p < 0.05.
Hypothesis 2, in its turn, was supported. This hypothesis proposed that the highest the proportion of firms that introduce produces innovation, the higher the future regional growth; and that the effect of process innovation comes faster than product innovation. The regression estimating GDP_grw with a five years’ time-lag found a positive and significant influence of Inov_Proc/Tot (0.672 for p < 0.05), indicating that the effect of a stronger introduction of process innovation by firms on regional growth starts to be perceived in five years. As the impact of product innovation could not be observed in this period, we may infer that it takes longer than the effect of process innovation, if observed at some point.
Figure 3: Variables’ tendencies (Total sample)
Table 2: Panel Regression (GDP_gwt from year+1 to year+5)
GDP_grw (year + 1) GDP_grw (year + 2) GDP_grw (year + 3) GDP_grw (year + 4) GDP_grw (year + 5)
Coeff. S.E. Coeff. S.E. Coeff. S.E. Coeff. S.E. Coeff. S.E.
Predictors GDP_grw (year + i - 1) 0.017 0.153 -0.193 0.124 0.106 0.117 -0.032 0.156 -0.256 0.175 Inov_Prod/Tot -0.235 0.188 -0.265 0.176 -0.307 0.156 0.137 0.231 -0.396 0.255 Inov_Proc/Tot 0.278 0.244 0.388 0.222 0.060 0.199 0.123 0.259 0.672* 0.293 Constant 0.028* 0.008 0.052* 0.007 0.039* 0.007 0.024* 0.009 0.054* 0.007 Model Fit R2 0.525 0.498 0.386 0.701 0.525 Adj. R2 0.464 0.435 0.308 0.658 0.457 F statistic 8.67* 7.81* 4.94* 16.39* 7.72* * p < 0.05 DISCUSSION
The results of the empirical analysis supported the affirmative that the level of introduction of process innovation by firms in a region brings a faster return regarding economic growth than the level of introduction of product innovation. The regression showed that the effect of the percentage of firms that introduced process innovation in three years in a region has a positive impact on GDP growth after five years. Although the effect of product innovation was not perceived within five years, this may be an indication that the Utterback and
-1% 1% 3% 5% 7% 9% 2001 2002 2003 2004 2005 2006 2007 2008 2009 2010 2011 2012 2013 2014 Ano
Abernathy cycle (UTTERBACK; ABERNATHY, 1975) effectively occurs and in many cases. Product innovations would be followed by process innovations that improve the new products efficiency and decreases its costs. After around five years after start improving the new products and services through process innovation, performance effects start to be felt by the firms. The new products and services, now with a reasonable price, quality, and which had time to mature and be known in the market, gain market share and increases the firms’ revenues. Aggregating this results by the region in which the firms are located, this process influences GDP growth. But not only process innovation is relevant to this process. The previous introduction of innovative products and services were necessary to demand those process innovations. Although not observable in the empirical analysis, these results indicate that, in a time-lag longer than five years, the level of introduction of product innovation by the firms of a region may also influence its GDP growth.
Another reason why only the effect of process innovation is perceived may be because a part of the process innovations introduced is not for improving the production process of radical product innovations introduced by the regional firms. They are necessary adaptations of the production process of firms that copied or licensed innovative products from other firms (mostly foreign firms) and are making only simple adjustments. These firms are still at the beginning of the innovation learning curve, not yet able to develop more effective product innovations (BELL; FIGIEIREDO, 2012; KIM, 1997). However, they had to introduce process innovations on the plant floor to adapt their production processes for absorbing the production of these new copied or licensed products. It takes some time to make these adaptations and have an acceptable cost of production and quality. At the same time, the copied or licensed product launched needs time and market efforts to be known and gain market share. Therefore, it is more than expected that process innovations influence economic performance within some years (five years, as observed), even if these process innovations were not a consequence of the previous introduction of product innovations.
CONCLUSION
This paper analysis supported partially the studies that propose that innovation have a positive influence on regional development (e.g., AHLSTROM, 2010; DOMENECH et al., 2016; HOWELLS, 2005; KISELITSA et al., 2017; PORTER, 2003; SHEFER; FRENKEL, 2005). In the case of the Brazilian states, the results indicated that the level of introduction of process innovation influenced GDP growth positively with a time-lag of five years, while no influence was found for the level of introduction of product innovation. It is consistent with the hypothesis that suggests that process innovation promote faster results than product innovation not only in the level of the firm but also considering the set of firms at the regional level. The process innovations introduced may be a consequence of product innovations that launched new products or services to the market, which demanded improvements in quality and its production processes. If it is the case, product innovations may also influence GDP growth at the regional level in a longer term, although this hypothesis could not be tested in this empirical study. Another possibility is that the process innovations developed were a consequence of necessary improvements in the production process of firms that copied or licensed new products and services from other firms (mainly foreign). In these cases, nothing indicates that product innovation will influence GDP growth. The introduction of a mix of both types of process innovations may also
occur for the set of firms in a region, making the influence of process innovation stronger but without withdrawing the possibility of a following effect of product innovation.
This study has several limitations. First, the various PINTEC surveys ask if the firm introduced innovation (product or process) in a three-year period or not. It does not consider the possibility of a firm to develop a lot of different innovations of each type, which indeed would increase the regional level of innovativeness. It was not also possible to measure if the firm introduced product and process innovation in the same period, which would give more information about the possibility of occurrence of the Utterback and Abernathy cycle. Another limitation is that we had information about 14 of the 26 states of Brazil (not considering Distrito Federal), and not all of them were covered by all the six PINTEC surveys. The last limitation is that GDP growth is not the only dimension of economic development existent, and other variables could be used to form a more complete frame.
Even with the limitations, this study has interesting theoretical and practical implications. The theoretical implications were already analyzed in the discussion section and at the beginning of this conclusion. As practical implications, we may highlight that the government programs which incentive innovation should have two foci. The first should be on the development of process innovation, which is not strongly focused in Brazil and brings faster results. The second should be on encouraging product innovators to improve its technological learning to be competitive in global markets (LAZZARINI, 2015). It is the only way the government incentives can be temporary, and the firms can go further by themselves, contributing to regional economic development effectively.
REFERÊNCIAS
AHLSTROM, D. Innovation and Growth: How Business Contributes to Society. The Academy of Management Perspectives, v. 24, n. 3, p. 11–24. 2010.
BEUGELSDIJK, S. (2010). Entrepreneurial culture, regional innovativeness and economic growth. In Entrepreneurship and culture (p. 129-154). Springer, Berlin, Heidelberg. 2010.
BRÉCARD, D.; FOUGEYROLLAS, A.; LE MOUEL, P.; LEMIALE, L.; ZAGAMÉ, P. (2006). Macro-economic consequences of European research policy: Prospects of the Nemesis model in the year 2030. Research Policy, v. 35, n. 7, p. 910-924. 2006.
CAPELLO, R.; LENZI, C. (2016). Innovation modes and entrepreneurial behavioral characteristics in regional growth. Small Business Economics, v. 47, n. 4, p. 875-893. 2016.
CHENG, C. C.; HUIZINGH, E. K. (2014). When is open innovation beneficial? The role of strategic orientation. Journal of Product Innovation Management, v. 31, n. 6, p. 1235-1253. 2014.
CHRISTENSEN, C. The innovator's dilemma: when new technologies cause great firms to fail. Harvard Business Review Press. 2013.
DOMENECH, J.; ESCAMILLA, R.; ROIG-TIERNO, N. Explaining knowledge-intensive activities from a regional perspective. Journal of Business Research, v. 69, n. 4, p. 1301–1306. 2016.
DUTTA, S.; LAVINN, B.; WUNSCH-VINCENT, S. The global innovation index 2016: Winning with global innovation. Johnson Cornell University. 2016.
ETZKOWITZ, H.; KLOFSTEN, M. The innovating region: toward a theory of knowledge‐based regional development. R&D Management, v. 35, n. 3, p. 243-255. 2005.
FAEMS, D.; VAN LOOY, B.; DEBACKERE, K. Interorganizational collaboration and innovation: Toward a portfolio approach. Journal of Product Innovation Management, v. 22, n. 3, p. 238-250. 2005.
GIULIANI, E.; BELL, M. The micro-determinants of meso-level learning and innovation: evidence from a Chilean wine cluster. Research Policy, v. 34, n. 1, p. 47–68. 2005.
GJELSVIK, M. Universities, innovation and competitiveness in regional economies. International Journal of Technology Management, v. 76, n. 1-2, p. 10-31. 2018.
GOERZEN, A. Alliance networks and firm performance: The impact of repeated partnerships. Strategic Management Journal, v. 28, n. 5, p. 487-509. 2007.
GUMBAU ALBERT, M. Entrepreneurship, innovation and regional performance: application for the Spanish regions. Entrepreneurship & Regional Development, v. 29, n. 3-4, p. 271-291. 2017.
HEIDENREICH, M Innovation patterns and location of European low-and medium-technology industries. Research Policy, v. 38, n. 3, p. 483-494. 2009
HOWELLS, J. Innovation and regional economic development: A matter of perspective? Research Policy, v. 34, n. 8, p. 1220–1234. 2005.
INSTITUTO BRASILEIRO DE GEOGRAFIA E ESTATÍSTICA - IBGE. PINTEC – Pesquisa de Inovação. Retrieved from: http://www.pintec.ibge.gov.br/. Accessed in: 20 January 2016.
___ . Contas Regionais do Brasil. Retrieved from:
https://cidades.ibge.gov.br/brasil/ma/pesquisa/10060/60147?tipo=ranking&indicador=60148. Accessed in: 12 October 2017.
JEMALA, M. New research study on technology patents progress in developing EU countries. International Journal of Agile Systems and Management, v. 10, n. 2, p. 116-136. 2017.
KEUPP, M. M.; PALMIE, M.; GASSMANN, O. The strategic management of innovation: A systematic review and paths for future research. International Journal of Management Reviews, v. 14, p. 367-390. 2011.
KISELITSA, E. P.; SHILOVA, N. N.; LIMAN, I. A. Regional Features of the Innovative Activity Formation as a Determining Factor in the Development of the Russian Economy. Academy of Strategic Management Journal, v. 16, n. 1, p. 96-109. 2017.
LAZZARINI, S. Strategizing by the government: Can industrial policy create firm-level competitive advantage? Strategic Management Journal, v. 36, n. 1, p. 97–112. 2015.
MOUTINHO, R.; AU-YONG-OLIVEIRA, M.; COELHO, A.; PIRES MANSO, J. The role of regional innovation systems (RIS) in translating R&D investments into economic and employment growth. Journal of Technology Management & Innovation, v. 10, n. 2, p. 9-23. 2015.
ORGANIZATION FOR ECONOMIC CO-OPERATION AND DEVELOPMENT - OECD. Oslo Manual-Guidelines for Collecting and Interpreting Innovation Data. OECD Publishing: Paris,. 2005.
ORIHATA. MOTOKAZU. National economic maturity and product innovation: the case of Japan." International Journal of Entrepreneurship and Innovation Management, v. 1, n. 1, p. 111-124. 2001.
PAULA, F.O.; SILVA, J. F. Innovation performance of Italian manufacturing firms: The effect of internal and external knowledge sources. European Journal of Innovation Management, v. 20, n. 3, p. 428-445. 2017.
PORTER, M. E. The Economic Performance of Regions. Regional Studies, v. 37, n. 6-7, p. 549–578. 2003.
RUTTEN, R.; BOEKEMA, F. Regional social capital: Embeddedness, innovation networks and regional economic development. Technological Forecasting and Social Change, v. 74, n. 9, p. 1834–1846. 2007.
STATISTICS TIMES. List of Countries by Projected GDP per capita. Retrieved from:
http://statisticstimes.com/economy/countries-by-projected-gdp-capita.php. Accessed in: 07 February, 2018.
SHEFER, D., & FRENKEL, A. R&D, firm size and innovation: An empirical analysis. Technovation, v. 25, n. 1, p. 25–32. 2005.
SUPERINTENDÊNCIA DA ZONA FRANCA DE MANAUS – SUFRAMA. O que é o Projeto ZFM? Retrieved from: http://www.suframa.gov.br/zfm_o_que_e_o_projeto_zfm.cfm. Accessed in: -7 February, 2018.
TEECE, D. J. Explicating dynamic capabilities: the nature and microfoundations of (sustainable) enterprise performance. Strategic Management Journal, v. 28, n. 13, p. 1319-1350. 2007.
TERJESEN, S.; PATEL, P. C. In search of process innovations: The role of search depth, search breadth, and the industry environment. Journal of Management, v. 43, n. 5, p. 1421-1446. 2017.
TRINH, T. H. A primer on GDP and economic growth. International Journal of Economic Research, v. 14, n. 5, p. 13-24. 2017.
UTTERBACK, J. M.; ABERNATHY, W. J. A dynamic model of process and product innovation. Omega, v. 3, n. 6, p. 639-656. 1975.
VAN AARDT SMIT, A. Does the lack of innovation impact the competitiveness of businesses and poverty levels of african countries? International Journal of Economic Research, v. 14, n. 12, p. 275-285. 2017.