Lockdown 101: Managing economic lockdowns in an epidemic
1Countries worldwide have implemented lockdown measures to contain the covid-19 pandemic. After more than three months of restrictions to economic activities in many countries, the question has turned to the best ways to lift lockdowns while keeping the epidemic in check. Here I use basic economic principles to shed light on the key tradeoffs. A central message is that there is no“health vs.economics” dichotomy. Rather, some degree of lockdown is typically optimal in crises like this, balancing its economic costs against its health benefits. Moreover, the optimal lockdown is dynamic, changes over time and eventually becomes more lenient, although the path is not necessarily monotonic.
Keywords: Pandemic, covid-19, optimal policies JEL codes: H0, I100, I180
Lockdown 101: Gerenciando lockdowns econômicos em uma pandemia
Países em todas as partes do mundo implementaram medidas de lockdown para conter a pandemia da covid-19. Após mais de três meses de restrições a atividades econômicas em muitos países, a principal pergunta agora é sobre as melhores formas de sair do lockdown e ao mesmo tempo manter a epidemia controlada. Neste artigo, eu uso princípios econômicos básicos para esclarecer os principais tradeoffs. Uma mensagem central é que não existe uma dicotomia “saúde vs. Economia”. Ao contrário, algum grau de lockdown é tipicamente ótimo em crises como essa, equilibrando custos econômicos e benefícios para a saúde. Além disso, o lockdown ótimo é dinâmico, mudando no tempo e em algum momento se tornando mais leniente, embora o caminho não seja necessariamente monotônico.
Palavras-chave: pandemia, covid-19, políticas ótimas Código JEL: H0, I100, I180
1DOI: https://doi.org/10.21874/rsp.v71i0.4879 ISSN: 0034-9240 | E-ISSN: 2357-8017
Submitted: July 13, 2020. Published: July 13, 2020.
Emanuel Ornelas1 1 São Paulo School of Economics-FGV, São Paulo, SP, Brazil
Lockdown 101: Gerenciando lockdowns económicos en una pademia
Países de todo el mundo han implementado medidas de lockdown para contener la pandemia del covid-19. Después de más de tres meses de restricciones a las actividades económicas en muchos países, la pregunta principal ahora es sobre las mejores formas de salir del lockdown y al mismo tiempo controlar la epidemia. En este artículo, uso principios económicos básicos para aclarar los principales tradeoffs. Un mensaje central es que no existe una dicotomía“salud versus economía”. Por el contrario, cierto grado de bloqueo puede ser excelente en crisis como esta, equilibrando los costos económicos y los beneficios para la salud. Además, el bloqueo óptimo es dinámico, cambia con el tiempo y en algún momento se vuelve más complaciente, aunque el camino no es necesariamente monótono.
Palabras clave: pandemia, covid-19, políticas óptimas Código JEL: H0, I100, I180
1. Introduction
Since January 2020, numerous countries and regions of the world have adopted measures of mandatory closures of economic activities— “lockdowns”— to fight the covid-19 epidemic. The severity of those measures has varied enormously across countries, across regions within countries, as well as over time. They are mediated by other health and economic measures, which depend on state capacity and affect the desirability and the stringency of the lockdowns. Some policymakers seem to have gotten it about right, but many have not.
This short article is an updated and extended version of Ornelas (2020), written in March, when the world was only starting to implement lockdowns. The exceptions were the earlier experience in Wuhan, China, with a nearly full lockdown in January, and the approach followed by a few Asian countries, of which South Korea is probably the best example, of partial or localized closures since the beginning of the virus outbreak in early February, guided by a strict policy of testing-tracing-isolation (TTI). Then, after the world observed, in shock, the tragedy unfolding in Italy and Spain since late February, lockdown policies became widespread during the subsequent month.
Here, I outline the key tradeoffs policymakers should consider when managing lockdowns in an epidemic. The analysis relies on basic economic principles. While some of the conclusions are fairly straightforward, others are subtler. Not all seem to have been understood by most governments.
Two caveats are in order. First, the problem is inherently dynamic, but my analysis is static. Fully dynamic models have been developed in the last months, integrating, in different ways, standard epidemiologic models into an economic structure.2 Those models, often designed for quantitative analysis, can be very useful. The cost is that some key elements of the problem are difficult to formalize and therefore may be left out.3Here, instead, I try to capture the key elements in the simplest possible manner, in a way that can be explained to first-year undergraduate students4—a lockdown 101 discussion—but can (hopefully) be useful for professional economists, too. To overcome the static nature of the framework, I rely on well-known facts about
2 See, for example, Alvarez et al. (2020), Fajgelbaum et al. (2020), Gonzalez-Eiras and Niepelt (2020) and
Hellwig et al. (2020).
3 See, for example, the discussion in Avery et al. (2020).
4 As has happened successfully in my own department—I thank Bernardo Guimaraes for running the “test
epidemiologic dynamics and argue about the parallel economics dynamics to carry out comparative statics that seek to “mimic” the dynamic nature of the problem.
The second caveat is that the analysis is best viewed from the perspective of countries that do not have an effective TTI system in place. Strictly speaking, one could interpret their approach in my framework, as I indicate later, but the analysis is not designed to capture the precise, targeted nature of their interventions. Instead, the analysis here applies more aptly to the approaches followed by most of Europe, North America, and almost all developing economies, which relies on blunter lockdown measures.
The main takeaways of the analysis are:
(1) At the peak of a serious epidemic, a near-full lockdown is better than nothing in unprepared countries. However, the lockdown should not be long-lasting, with its duration being determined by its marginal (health) benefits and (economic) costs.
(2) Activities to be suspended in the lockdown should be ordered from those that yield higher health benefits and impose lower economic costs to those that have the opposite effect; in serious cases, as with covid-19, initially a large number of activities will need to be suspended in unprepared countries.
(3) The optimal extent of lockdown measures changes over time and eventually decreases, but does not drop to zero quickly.
(4) Better health measures to cope with the epidemic allow for more lenient lockdown policies. (5) Measures that ease the economic pain during the lockdown pave the way for stricter lockdown policies.
(6) The economic and health costs of the epidemic will be higher for developing economies than for rich ones, even though it is generally ambiguous which should have stricter lockdown policies. (7) When the government is unable to use an effective TTI system and the capacity of the health system is likely to bind, the optimal lockdown policy is such that it just prevents the collapse of the health system.
This article proceeds as follows. In the next section, I consider the choice between the two extreme scenarios of a full lockdown or of no restriction to economic activities. There, the variable that changes over time is time. In section 3, I consider instead the optimal extent of a lockdown in a given period but take into account the time-related issues established in section 2. In section 4, I discuss how other health and economic policies affect the optimal stringency and duration of a lockdown policy. In section 5, I discuss how country characteristics affect the optimal lockdown policies, with special focus on the differences between developed and developing economies.
Finally, in section 6, I show how the analysis changes when hospital capacity binds. Section 7 concludes.
2. The desirability of a full lockdown
The problem caused by an epidemic is that it makes some people sick and ends up killing some of them. This, of course, is costly for the society. The shutdown of some economic activities—that is, the implementation of lockdown policies—lowers that cost, by containing the spread the virus, reducing the number of infections and allowing the health system to treat those infected (as well as those that require health services unrelated to the epidemic) better. On the other hand, it hurts the economy, because it averts mutually beneficial economic activities that would otherwise take place.5
A lockdown policy has two components, its stringency (the extent of economic activities that are shut down by decree) and the duration in which it is kept in place. A social planner wants to minimize the aggregate costs of the epidemic, mediated by the lockdown, to the society. Thus, its problem can then be described as
, ( , ) + ( , ),
where HC(.) denotes total health cost and EC(.) denotes total economic costs from the policy, l indicates the stringency of the policy and d its duration. Both l and d have opposite effects on HC and EC, increasing the latter while decreasing the former.6
As it turns out, a more intuitive formulation uses the inverse of HC, which we call the health benefit (HB) of a lockdown. In that case, the problem of the social planner can be written as
, ( , ) − ( , ).
We characterize this problem in steps. First, in this section, we consider the desirability of imposing a full lockdown (L) of the economy. In that case, the problem boils down to the optimal duration of a full lockdown.
5Naturally, the epidemic also has direct economic costs, on top of those created by the lockdown, as sick and
dead people leave the workforce and numerous others change their behavior in response to the threat of the virus. Accounting form that would not change my qualitative conclusions, however.
6 Economic costs are easily measured in terms of income foregone. Health costs can be easily measured in
terms of the number of people that get sick or the number of people who die. However, to compare the two we need a common measurement unit. I sidestep this problem by simply assuming that the two can be measured in the same unit. I acknowledge that this is a delicate and subtle issue, but note that it is common practice in economics. Although a variety of methods has been used, the most common is probably through the calculation of the statistical value of a life. See, for example, Hall and Jones (2007).
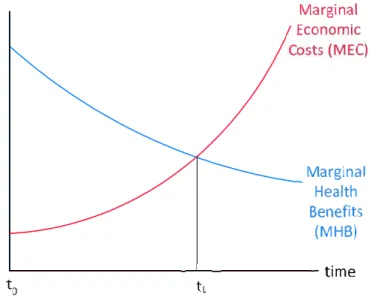
An elemental, but often forgotten, point is that the benefits and costs of L change over time. At the peak of an epidemic, stopping human interaction has a very large health benefit, as it halts contagion (completely, in the case of perfect enforcement) and prevents additional overloads to a collapsed heath system. After L is in place for a while, however, those benefits fall, as the health situation becomes more manageable. That is, the marginal health benefit (MHB) of L decreases with its duration.
At the same time, the economic cost of L increases over time. As Baldwin (2020) puts it, we are used to having (partial) lockdowns during weekends and national holidays, but those have little cost, because we know they last just a few days. However, maintaining L for longer periods imposes increasing costs on society, as firms go bankrupt, individuals are laid off and, ultimately, consumption levels drop sharply and continuously. That is, the marginal economic cost (MEC) of L increases with its duration.
Figure 1 illustrates this point. During regular times, MHB(L, 0) < MEC(L, 0) at t0, and therefore nobody even discusses the possibility of a full lockdown.7 However, at the peak of an epidemic for which countries were ill prepared to handle, as with covid-19, MHB(L, 0) > MEC(L, 0) at t0, so at first having L is better than not having it. That changes with time, however, as the health situation becomes more manageable and the economic cost increases. Eventually, it becomes better to lift L and restore economic activities.8 The optimal duration is represented by
d*(L) = tL- t0 in the figure, which is the duration that equalizes MHB(L, d*) and MEC(L, d*).
7 Observe that having MHB < MEC at t
0 does not mean that a full lockdown would not save lives in normal
times. For example, crime drops dramatically and car accidents are eliminated with a full (and enforceable) lockdown, just to mention two of the main causes of death worldwide, especially in developing countries. Still, societies agree that it is worthwhile to bear the cost of those daily deaths to avoid the economic costs from preventing them.
8Enforcement of L is also likely to decrease with its duration. This tends to lower both its economic
Figure 1: Optimal duration of a full-lockdown policy
Source: Elaborated by the authors.
My first conclusion is therefore very simple:
Result 1: At the peak of an epidemic, a full (or near-full) lockdown is better than nothing in countries that were unprepared for it. However, the lockdown should not be long lasting, and its duration should be determined by its marginal (health) benefits and (economic) costs.
This is, however, too simplistic, because it presents the problem as dichotomous: either to have a blanket lockdown L or no restriction at all on economic activities. As with the vast majority of public policies, the optimal policy is often interior, not at the corner.
3. The optimal level of lockdown over time
Let us consider, then, the more realistic possibility of partial lockdowns. That is, consider a variable l that goes from 0 (no restrictions on economic activities, as in, say, 2019) to L (full lockdown, where people do not interact with each other outside their homes and most economic activities stop). Now, to keep the analysis simple, instead of considering the benefits and costs of a full lockdown over time, let us consider the benefits and costs of different degrees of lockdowns at specific points in time.
When l is very close to zero, the health benefits from increasing l are greatest, because it would have the greatest impact on reducing contagion. Once l gets very close to L, however, the
additional health benefits from increasing l are small, as there are already very few people interacting with each other and the virus is spreading at a very low rate. Hence, the MHB decreases with l.
Conversely, when l is very close to zero, the economic costs of increasing l are small, because it will not disrupt any key activity. However, as l gets very close to L, the additional economic costs from increasing l are huge, because some essential economic activities will need to be shut. Hence, the MEC increases with l.
Implicit in the discussion above about how MHB and MEC change with l is the assumption that there is an optimal order in which activities are ordered as l moves from 0 to L. This is key: a progressive lockdown must first affect the activities that generate least economic costs and most health benefits. Obviously, designing a perfect ordering is a daunting activity, especially because societies have very little experience in doing that.9 Nevertheless, it is relatively easy to place several activities near the two extremes with much controversy.
For example, office work that can be carried out online should be one of the first, because it imposes very small economic costs and generates some health benefit, as people do not mingle in the office. Large live events should also be one of the first, because preventing them generates large health benefits, even if the economic costs are far from negligible. Moreover, the activities involving those in the high-risk group (for covid-19, the elderly and those with comorbidities) should be the first to be averted. Near the other extreme, we should have activities for which their prohibition would cause large economic costs and small health benefits (e.g., trash collection, news provision, grocery stores and, most obviously, health services, which would cause a negative MHB).
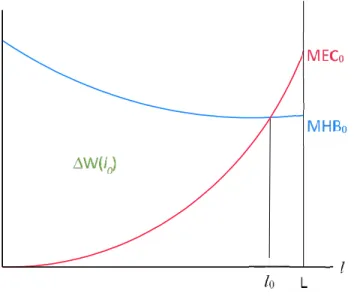
Figure 2 illustrates this discussion at the peak of the epidemic crisis. At that moment, the case for an almost-complete lockdown is strong, in line with what the previous dichotomous analysis suggests. Even then, a full lockdown would not be optimal, as we want to keep essential services and production of essential products (food, medicines) active. However, the optimal l is probably relatively high initially, as the figure indicates (l0).
My second conclusion is therefore also very simple:
Result 2: The activities to be suspended should be ordered from those that yield higher health benefits and impose lower economic costs to those that have the opposite effect; the optimal level of lockdown then equalizes marginal health benefit to marginal economic cost.
9 This explains the variation in the definition of “essential and semi-essential activities” across countries. For
Figure 2: Optimal lockdown policy tends to be severe at the peak of the pandemic
Source: Elaborated by the authors
Typically, the solution will be interior during an epidemic, reflecting the suspension of some activities. Especially when the epidemic is very serious, and governments are unprepared to deal with it, as with covid-19, initially a large number of activities will need to be suspended, including some that cause significant economic harm.
At the optimal level of lockdown, l0, the welfare gain to the society, relative to not having any such restrictions, is the area between MHB0 and MEC0 from l [0, l0], indicated by ΔW(l0). Naturally, any measure of lockdown that is strictly positive but below l0also brings welfare relative to doing nothing, but not as much as l0. For example, if l =l’ < l0, increasing l a bit yields a relatively small economic cost but a relatively large benefit in terms of preventing illnesses and deaths.
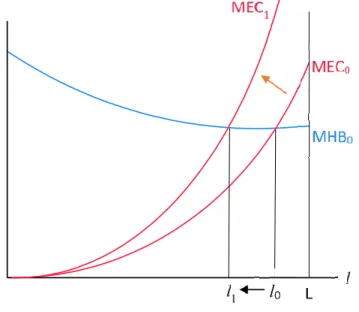
Now, as l0 remains in place for a while, the curves change, as suggested by Figure 1. In particular, the MEC curve will shift up for any level of l. At the same time, once the epidemic is better controlled, the MHB curve should shift down. However, in its raises stages that curve could be going up for “exogenous” reasons—that is, following the contagion dynamics of the epidemic.
Figure 3 illustrates those changes. For the sake of clarity, it simply assumes that l0is such that it just offsets those exogenous forces at first, so that MHB remains unchanged in the next period. In that case, because of the shift in the MEC curve, the new level of the optimal l, l1, is lower than l0. That is, because economic costs increase over time, restrictions on economic activity should be relaxed somewhat (say, some retail stores employing low-income workers may be partially allowed to reopen).
This does not need to be the case. If the exogenous dynamics of the epidemic is such that the MHB curve moves up very quickly, as in its early days, the optimal policy may be an even stricter lockdown in period 1 than in period 0. However, epidemics eventually run their courses and come to an end, even if left untreated. Thus, the MHB curve will eventually shift down, and so will the optimal l, with economic restrictions being lifted accordingly.
Nevertheless, it will typically take time to bring l back to zero. This reinforces the point that the solution is not dichotomous. Suspension of some economic activities is optimal until the epidemic is completely controlled. The optimal time-path is typically smooth and long-lasting, with restrictions being lifted over time.
Figure 3: Optimal lockdown policy becomes more lenient over time
Source: Elaborated by the authors
This also has implications for the dynamics of the epidemic: the goal of the restrictions on economic (and social) activities is not to eliminate the epidemic quickly, but to keep its health costs aligned with the adjacent economic costs of the restrictions.10 Thus, increases in cases, as has often happened in countries that appear to have brought the epidemic under control, are not a
10 A handful of countries, of which the most prominent is New Zealand, actually envisaged to eliminate the
virus from their territory. This is, however, very difficult (and costly) to accomplish and to maintain, because it requires imposing a nearly total ban on international travel until the rest of the world achieves herd immunity or a vaccine becomes widely available. Indeed, after declaring victory against the new corona virus in early June, New Zealand detected some new cases from residents returning from abroad.
reason to think that “their system is not working.” Instead, that is a consequence of an optimal monitoring of the epidemic, which should not aim to eliminate it at once.
My third conclusion is, therefore, more subtle:
Result 3: The optimal extent of lockdown changes over time and eventually decreases, but does not drop to zero quickly. Instead, it manages the health-economic tradeoff over time.
As mentioned in the introduction, the problem is inherently dynamic, since the position of the two curves in a point in time depends on the policy of the previous period, as well as on the exogenous epidemiological forces. What figures 2 and 3 do, by illustrating different points in time, is to mimic that dynamics from an intuitive standpoint. It is obviously incomplete, but hopefully instructive enough to drive home the qualitative message that a truly dynamic model would deliver.
4. Policies that keep the MHB and MEC curves low
Rightly so, much of the debate in the last five months has been about the best health policies to contain the spread of the epidemic and prevent collapses in health systems. These include keeping the vulnerable people isolated, widespread testing and subsequent monitoring, with isolation also of those tested positive and of their contacts (and of the contacts of their contacts), building of hospital beds, production of medical equipment to treat the ill, etc. Despite the direct economic costs of such measures, they pale next to the economic costs of lockdowns.
In my setup, health measures to contain the spread of the virus and better prepare the health system to cope with the ill can be interpreted as policies that push the MHB curve down. Clearly, as can be seen from Figure 2, if the MHB curve shifts down, it will, at any point in time, reduce the severity of the optimal lockdown. Thus, not only they bring about a direct health benefit, they also allow for an indirect economic benefit by permitting a more lenient lockdown policy (and yes, they also require a direct economic cost to be put in place).
This yields my fourth conclusion:
Result 4: Better health measures to fight the epidemic allow for a more lenient lockdown policy, therefore curbing their economic costs.
The part of the current debate that is not on health policies is on the best economic policies during the crisis. Most of them go in the direction of, in the words of Baldwin and Weder di Mauro (2020a), “keeping the lights on” until the epidemic is controlled. They include policies to preserve employment, to avoid bankruptcies, to expand credit to firms and consumers, etc.11Typically, they
aim to (1) prevent current disruptions in the economic system from becoming permanent, and to (2) mitigate the welfare cost to the most vulnerable people.
In my setup, those policies can be interpreted as measures that push down the MEC curve, as they make a lockdown less painful in the short run and lower its long-run deleterious effects. Clearly, if the MEC curve shifts down, it will, at any point in time, increase the severity of the optimal lockdown. That is, by easing their costs, those policies allow for stricter lockdowns, which will help contain the epidemic more quickly and effectively (and yes, they require a hefty direct economic cost to be put in place).
This yields my fifth conclusion:
Result 5: Measures that ease the economic pain during the fight against the epidemic pave the way for stricter lockdown policies, thus bringing larger health benefits.
5. Country characteristics that affect the MHB and MEC curves
The MEC and MHB curves vary significantly across regions/countries depending on their socio-economic characteristics.
Starting with the MHB curve, it can be very different depending on cultural traits and the demographics of the country, even for a given stage of the epidemic. For example, if it is common for different generations to live together, or if the elderly share of the population is high, then the MHB curve will be relatively high—compare, say, Italy and Germany. This implies that, for otherwise similar countries in terms of development, one with a high share of elderly who tend to live with younger relatives (Italy), will need stricter lockdown policies than another with the opposite characteristics (Germany).
Even more critical is the structure of the health system of the country. Much of the attention so far has been on rich countries, which, as a group, were affected earlier by the epidemic than developing economies. Those countries have relatively solid health systems in place. In developing countries, however, access to health care is more restricted and its quality is lower. Therefore, the MHB curve tends to be much higher in developing economies than in rich ones. That, in itself, would push for stricter lockdown policies.
However, we must also look at how levels of development affect the MEC curve. It will be relatively low where individuals have access to liquid savings and the government can, directly and indirectly (through incentives for the private sector), keep incomes and payments flowing, limiting bankruptcies and layoffs during the peak of the crisis. On the other hand, in countries where few households have savings, the informal sector (which tends to be more affected) is large, and the government is unable to provide much help to keep incomes and payments flowing,
the MEC will be much higher. As we have seen, the government handouts and employment maintenance schemes in the U.S. and in the E.U., for example, have been indeed vastly larger than what governments in developing countries have been able to provide.12
Taken together, we have that both curves will be higher in developing countries. The impact on the optimal lockdown policy is therefore ambiguous. It will depend on how good/bad the health system is relative to the economic system. In places where the health system is better equipped to cope with the epidemic than the economic system is to cope with the restriction of activities, a more lenient lockdown would be advisable. The opposite would happen otherwise.
Now, what is clear is that, for developing countries, both the economic and health costs of the epidemic will much higher than for rich countries. The curves will intersect at a higher level both because the economy is ill suited to sustain a lockdown and because the health system is ill suited to deal with an epidemic. The optimal lockdown policy trades off those two costs optimally, but the outcome is nevertheless dire. As it happened, the pandemic reached most developing economies later then it reached the rich ones. This lag implies that it is still too early to compare the outcome in the two groups of countries. Being affected later does have the benefit of learning from best (and worst) practices observed in the first affected countries. Nevertheless, the drama we have seen in some parts of Europe and the U.S. may be dwarfed by what can still happen in poorer countries affected by the epidemic.13
Thus, my sixth conclusion is:
Result 6: It is generally ambiguous whether the optimal lockdown policy should be stricter in rich or in developing economies. Regardless, the latter will suffer more than the former with the pandemic, economically and health-wise.
6. Hospital capacity
One of the reasons why the MHB is downward sloping is the finite capacity of the health system. As observed in several places, if the epidemic reaches a point where there are no intensive care units, or no respirators, or simply no hospital beds available, then the death rate
12 For example, in the U.S., a large share of the recipients of the weekly US$ 600 transfer by the federal
government to the unemployed experienced an increase in their available income after losing their jobs during the pandemic.
13 Early on in the pandemic, there was an expectation that a warmer climate could make the covid-19
pandemic weaker. In that case, the MHB curve for developing countries with warmer temperatures would be lower, implying weaker lockdown policies and lower overall health and economic costs. That expectation/hope has not materialized, however, and there has not been yet any evidence that temperature has a meaningful impact on the reproductive speed and the strength of the virus.
from covid-19 skyrockets. In addition, lack of hospital capacity also implies more deaths from other causes, simply because those patients cannot be properly treated.
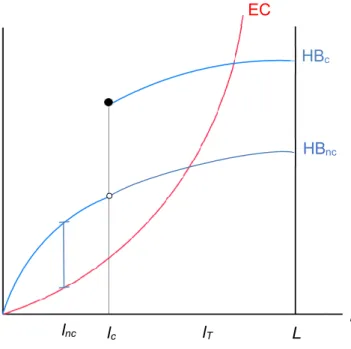
All that implies that MHB is likely to be particularly steep around the point where the health system is about to reach its capacity and collapse. Thus, unlike depicted in Figure 2, a better representation of this constraint needs to account for a discontinuity in the MHB curve. That discontinuity in the MHB curve stems from a discontinuity in the original HB curve (in levels), as depicted in Figure 4.
Figure 4: Optimal lockdown policy with a capacity constraint in the health system; curves in levels
Source: Elaborated by the authors
When looking at the HB and EC curves in levels, the optimal lockdown policy maximizes the difference between them. If there were no capacity constraints, as represented by curve HBnc, then the optimal policy is the relatively lenient lnc. Now, when accounting for capacity constraints in the health system, HB is best represented by curve HBc, which is identical to HBnc for l ϵ [0, lc), but jumps at lc. In that case, the best policy is the stricter lc, which is set just to prevent the collapse of the health system, which would represent a sharp fall in the benefits of the lockdown (that is, a large increase in the health toll of the pandemic).
In the few countries that have put in place an effective TTI system, the health system is never in danger of collapsing, so their relevant HB curve in HBnc. For them, lockdowns will be
EC HBc HBnc lnc l lc lT L
generally lighter and adjust to the new levels of the MHB and MEC curves, as seen before. For most other countries, which have been unable to implement an effective TTI system, the best solution will often be simply to restrict economic activities so that the health system does not collapse. This means that optimal lockdown policies will follow mostly the changes over time of the HBccurve alone. That is, governments should simply adjust l so that hospital/ICU utilization is below 100%. Or more realistically, after taking into account uncertainty about the exact progression of the epidemic, governments should attempt to keep hospital/ICU utilization between, say, 80%-90% of its capacity.
Here, an important observation is in order. For the non-TTI countries, establishing an initially very tough lockdown policy, like lT in the figure, can be very harmful in the long run. From a static point of view, it imposes excessive economic cost on the society. From a dynamic point of view, the longer it stays in place, the higher it pushes the EC (and MEC) curve, as we have seen. Moreover, with a tough and early lockdown, the HB curve hardly moves over time, because transmission is strongly contained. But the epidemiological process is such that it first needs to expand before it comes down, when a larger fraction of the population becomes immune to the virus—that is, as society approaches herd immunity. The result is that, with lT, the epidemic remains tightly controlled but the economic costs shoot up. Eventually, EC becomes so high that it makes lTunsustainable. A policy of lowering l is then put in place, but by then the economic cost curve in Figure 4 has already become much higher and steeper. The consequence is that it becomes more expensive for the society to maintain lc—conceivably, in some cases even the optimal policy may prescribe l < lc, if for example more people start to die from hunger than from lack of hospital treatment in a collapsed health system.
The upshot is that an excessive lockdown policy at the start of the epidemic can be very harmful in the long run. While the policy may appear extraordinarily effective in its early stages, because economic costs are still bearable and few people are getting sick, it wastes scarce hospital capacity from a dynamic perspective. When the epidemic actually takes off, society can barely cope with the economic cost of an even longer lockdown.14
Policies like that have been observed in several countries, from India to the Philippines to Argentina, and in regions within countries, where lockdown policies have been roughly homogenous despite vast heterogeneity in terms of the evolution of the epidemic, from Italy and
14 The assessment of a seemingly excessive lockdown policy at the onset of the epidemic is different if the
country/region uses that initial period to improve its preparedness to tackle the virus. For example, that period could be used to prepare an effective TTI system and to increase hospital capacity. Indeed, that was part of the official narrative in many places that adopted early lockdown policies. Unfortunately, those promises have rarely been
Spain to Brazil and the U.S. In the last two countries, although lockdown policies have been largely in the hands of mayors and state governors, the first round of lockdown policies took place about the same time throughout the countries, even though the epidemic was in full course in some areas (e.g., New York and Sao Paulo), but only starting to develop in others (e.g., California and Minas Gerais). The latter were broadly lauded by their early and strong intervention, which resulted (inevitably) in very low death rates initially. However, unless an effective covid-19 treatment is found soon, the long-run health and economic costs in those regions may end up being greater than in regions that managed to keep hospital utilization high but below capacity throughout the first months of the crisis (as in São Paulo, though not in New York, to return to the previous examples).
Hence, my seventh and last conclusion is:
Result 7: When the government is unable to keep the epidemic in check through an effective TTI system and the capacity of the health system is likely to bind, the best lockdown policy is the one that just prevents the collapse of the health system. More lenient policies make the health cost of the epidemic shoot up in the short run. Stricter policies make the economic and the (long-run) health costs of the epidemic unnecessarily high.
7. Conclusion
The debate about the desirability of an economic lockdown to deal with the covid-19 pandemic is often dichotomist: to have it or not. That is misleading. The optimal lockdown policy is very likely an intermediate one. For countries caught off guard with the current epidemic (i.e., most of them), a severe form of lockdown is optimal when the epidemic takes hold of the country. After an initial period, that policy should become more lenient, but should remain in place for as long as the epidemic poses a threat to society, although in increasingly milder forms. That is, a return to the 2019-level of economic and social freedom will probably take several months. The last restrictions to be lifted should be the activities that cause little economic harm if performed remotely and those that would cause most harm to society’s health by allowing a wider spread of the virus.
Importantly, the stringency of the lockdown, its duration, and the underlying economic and health costs depend critically on the capacity of the economic system to navigate through a period of suspended economic activities without compromising its structure and on the measures that improve the ability of the health system to cope with the epidemic. In particular, if the epidemic threatens a collapse of the health system, the best lockdown policy will be the one that just prevents such an outcome.
Naturally, to provide precise answers to those questions we need a quantitative dynamic model, as for example in Atkenson (2020), Eichenbaum et al. (2020) and Krueger et al. (2020). Nevertheless, the qualitative conclusions of this article should be useful to students as well as to economists who are not engaged in the research of “covid economics,” but are interested in grasping the main tradeoffs involved in the management of lockdowns. More ambitiously, it may also be useful as a guideline for future models and, more importantly, for current policymakers that need to make decisions before those models are fully developed.
References
Alvarez, F, D Argente and F Lippi (2020). “A Simple Planning Problem for COVID-19 Lockdown.” NBER Working Paper 26981.
Avery, C, W Bossert, A Clark, G Ellison and S Ellison (2020).“Policy Implications of Models of the Spread of Coronavirus: Perspectives and Opportunities for Economists.” CESifo Working Paper 8293.
Atkeson, A (2020). “What will be the economic impact of COVID-19 in the US? Rough estimates of disease scenarios.” NBER Working Paper 26867.
Baldwin, R (2020). “The supply side matters: Guns versus butter, COVID-style.” VoxEU.org, March 22, 2020.
Baldwin, R and B Weder di Mauro (2020a). “Introduction.” In Baldwin, R and B Weder di Mauro (eds.), Economics in the Time of COVID-19, a VoxEU.org eBook, CEPR Press.
Baldwin, R and B Weder di Mauro (eds.) (2020b). Economics in the Time of COVID-19, a VoxEU.org eBook, CEPR Press.
Eichenbaum, M, S Rebelo and M Trabandt (2020). “The macroeconomics of epidemics.” NBER Working Paper 26882.
Fajgelbaum, P, A Khandelwal, W Kim, C Mantovani and E Schaal (2020). “Optimal Lockdown in a Commuting Network.” NBER Working Paper 27441.
Gonzalez-Eiras, M and D Niepelt (2020).“On the Optimal ‘Lockdown’ during an Epidemic.” CESifo Working Paper 8240.
Hall, R and C Jones (2007).“The Value of Life and the Rise in Health Spending.” Quarterly Journal
Hellwig C, T Assenza, F Collard, M Dupaigne, P Feve, S Kankanamge and N Werquin (2020). “The Hammer and the Dance: Equilibrium and Optimal Policy during a Pandemic Crisis.” CEPR DP14731.
Krueger, D, H Uhlig and T Xie (2020). “Macroeconomic Dynamics and Reallocation in an Epidemic.” CEPR DP14607.
Ornelas, E (2020). “Managing economic lockdowns in an epidemic.” VoxEU.org, March 28, 2020. Emanuel Ornelas
https://orcid.org/0000-0001-8330-8745
PhD in Economics at the University of Wisconsin. Professor at the São Paulo School of Economics – Getúlio Vargas’ Foundation (FGV).