PREDICTIVE ANALYTICS VIA GAUSSIAN PROCESSES AND
STATISTICAL AUDIT VIA GAUSSIAN MIXTURES IN
BUSINESS INTELLIGENCE SYSTEMS
BRUNO HERNANDES AZENHA PILON
DISSERTAC
¸ ˜
AO DE MESTRADO EM ENGENHARIA EL´
ETRICA
DEPARTAMENTO DE ENGENHARIA EL´
ETRICA
Bras´ılia, Abril de 2015
UNIVERSIDADE DE BRAS´ILIA FACULDADE DE TECNOLOGIA
DEPARTAMENTO DE ENGENHARIA EL´ETRICA
PREDICTIVE ANALYTICS VIA GAUSSIAN PROCESSES AND
STATISTICAL AUDIT VIA GAUSSIAN MIXTURES IN
BUSINESS INTELLIGENCE SYSTEMS
BRUNO HERNANDES AZENHA PILON
ORIENTADOR: JO ˜AO PAULO CARVALHO LUSTOSA DA COSTA COORIENTADOR: JUAN JOS´E MURILLO-FUENTES
DISSERTAC¸ ˜AO DE MESTRADO EM ENGENHARIA EL´ETRICA
UNIVERSIDADE DE BRAS´ILIA
FACULDADE DE TECNOLOGIA
DEPARTAMENTO DE ENGENHARIA EL ´ETRICA
PREDICTIVE ANALYTICS VIA GAUSSIAN PROCESSES AND
STATISTICAL AUDIT VIA GAUSSIAN MIXTURES IN
BUSINESS INTELLIGENCE SYSTEMS
BRUNO HERNANDES AZENHA PILON
DISSERTAC¸ ˜AO DE MESTRADO SUBMETIDA AO DEPARTAMENTO DE ENGENHARIA
EL´ETRICA DA FACULDADE DE TECNOLOGIA DA UNIVERSIDADE DE BRAS´ILIA COMO
PARTE DOS REQUISITOS NECESS ´ARIOS PARA A OBTENC¸ ˜AO DO GRAU DE MESTRE
EM ENGENHARIA EL´ETRICA.
Banca Examinadora
Prof. Jo˜ao Paulo C. Lustosa da Costa, Dr. (ENE-UnB)
Orientador
Prof. Rafael Tim´oteo de Sousa J´unior, Dr. (ENE-UnB)
Examinador interno
Cristiano Rocha Heckert, Dr. (MP)
Examinador externo
FICHA CATALOGR ´AFICA
PILON, BRUNO HERNANDES AZENHA
Predictive Analytics via Gaussian Processes and Statistical Audit via Gaussian Mixtures in Business Intelligence Systems.
[Distrito Federal] 2015.
xvi, 69p., 297mm (ENE/FT/UnB, Mestre, Engenharia El´etrica, 2015). Disserta¸c˜ao de Mestrado – Universidade de Bras´ılia.
Faculdade de Tecnologia. Departamento de Engenharia El´etrica.
1. Inteligˆencia de Neg´ocios 2. An´alise Preditiva 3. Processos Gaussianos 4. Misturas Gaussianas
I. ENE/FT/UnB II. T´ıtulo (s´erie)
REFERˆENCIA BIBLIOGR ´AFICA
PILON, B.H.A. (2015). Predictive Analytics via Gaussian Processes and Statistical Audit via Gaussian Mixtures in Business Intelligence Systems. Disserta¸c˜ao de Mestrado em Engenharia El´etrica, Publica¸c˜ao PPGEE.DM-591/2015, Departamento de Engenharia El´etrica, Universidade de Bras´ılia, Bras´ılia, DF, 87p.
CESS ˜AO DE DIREITOS
AUTOR: Bruno Hernandes Azenha Pilon
T´ITULO: Predictive Analytics via Gaussian Processes and Statistical Audit via Gaussian Mixtures in Business Intelligence Systems.
GRAU / ANO: Mestre / 2015
´
E concedida `a Universidade de Bras´ılia permiss˜ao para reproduzir c´opias desta disserta¸c˜ao de mestrado e para emprestar ou vender tais c´opias somente para prop´ositos acadˆemicos e cient´ıficos. O autor reserva outros direitos de publica¸c˜ao e nenhuma parte dessa disserta¸c˜ao de mestrado pode ser reproduzida sem autoriza¸c˜ao por escrito do autor.
Bruno Hernandes Azenha Pilon
Universidade de Bras´ılia - Faculdade de Tecnologia Departamento de Engenharia El´etrica
”In an economy where the only certainty is uncertainty,
the one sure source of lasting competitive advantage is knowledge.”
`
A minha m˜ae, Angela. `
Agradecimentos
A Deus. `
A minha m˜ae, Angela, por ter semeado e cultivado o valor da educa¸c˜ao e dos estudos em nossa fam´ılia. Por nunca ter deixado de nos prover um porto seguro, mesmo diante das adversidades da vida. Por sua incans´avel dedica¸c˜ao ao nosso bem-estar e `a nossa felicidade. Por ter me guiado pelo caminho do bem, ter me ensinado a lutar o bom combate, ter constru´ıdo as plataformas que me permitiram al¸car os voos que voei e ter amortecido as quedas que sofri. Por ser o meu exemplo de vida, m˜aezinha, a minha eterna gratid˜ao.
A vocˆe, Agnes, pelo lindo sorriso acolhedor que t˜ao bem me recebeu nesta cidade fria e por ter abdicado momentaneamente do seu direito de convivˆencia para que este trabalho pudesse ser realizado. Te amo.
Ao meu orientador e amigo, Prof. Jo˜ao Paulo Carvalho Lustosa da Costa, cuja paix˜ao pela academia me inspirou e enriqueceu desde o nosso primeiro contato. Por ter me aberto as portas do mundo de processamento de sinais em arranjos, um campo de pesquisa fascinante. Por sempre se colocar `a disposi¸c˜ao e ser extremamente acess´ıvel. Por n˜ao ter desistido deste aluno, mesmo nos momentos mais dif´ıceis. Por ter me dado a oportunidade de trabalhar ao seu lado, uma experiˆencia bastante recompensadora, e por ter me dado a oportunidade de fazer muito mais do que o tempo e as circunstˆancias permitiram. Certamente este ´e s´o o come¸co de uma longa parceria.
Ao meu coorientador, Prof. Juan Jos´e Murillo-Fuentes, que da long´ınqua Universidade de Sevilha (ES) contribuiu imensamente com este trabalho. Suas an´alises r´apidas, in-terven¸c˜oes cir´urgicas e enorme conhecimento relacionado a processos e misturas Gaus-sianas foram decisivos para a valida¸c˜ao e qualidade deste trabalho.
Aos colegas do Laborat´orio de Processamento de Sinais em Arranjos (LASP), do La-borat´orio de Tecnologias da Tomada de Decis˜ao (LATITUDE) e do Grupo de Pro-cessamento Digital de Sinais (GPDS) da UnB, em ordem alfab´etica, Danilo Ten´orio, Jayme Milanezi, Marco Marinho, Stefano Mozart, Stephanie Alvarez e Toni Serrano, pelo apoio, convivˆencia e ´otimos momentos.
RESUMO
AN ´ALISE PREDITIVA VIA PROCESSOS GAUSSIANOS E AUDITORIA ESTAT´ IS-TICA VIA MISTURAS GAUSSIANAS EM SISTEMAS DE INTELIGˆENCIA DE NEG ´OCIOS
Autor: Bruno Hernandes Azenha Pilon
Orientador: Prof. Dr. Jo˜ao Paulo Carvalho Lustosa da Costa Coorientador: Prof. Dr. Juan Jos´e Murillo-Fuentes
Programa de P´os-gradua¸c˜ao em Engenharia El´etrica Bras´ılia, Abril de 2015
Um sistema de Inteligˆencia de Neg´ocios, do inglˆes Business Intelligence (BI), ´e um sistema de informa¸c˜ao que emprega ferramentas de diversas ´areas do conhecimento na coleta, integra¸c˜ao e an´alise de dados para aprimorar e embasar o processo decis´orio em empresas e institui¸c˜oes gover-namentais. O Minist´erio do Planejamento, Or¸camento e Gest˜ao (MP), ´org˜ao do governo federal brasileiro, possui uma s´erie de sistemas de inteligˆencia de neg´ocios e, neste trabalho, dois destes sistemas foram considerados. O primeiro sistema de BI, mantido pela Secretaria de Patrimˆonio da Uni˜ao (SPU), cont´em dados de arrecada¸c˜ao mensal de impostos daquela Secretaria, enquanto o se-gundo sistema de BI, mantido pela Coordenadoria de Inteligˆencia e Auditoria Preventiva da Folha de Pagamento (CGAUD), cont´em dados da folha de pagamento dos servidores p´ublicos federais brasileiros. Ambos os sistemas foram constru´ıdos objetivando-se a detec¸c˜ao de fraudes e irregu-laridades como evas˜ao fiscal e pagamentos n˜ao autorizados. Ao longo deste trabalho, pretende-se incorporar est´agios que adicionem an´alise preditiva e melhorias de performance aos sistemas de BI existentes. No sistema de BI da SPU, Regress˜ao por Processos Gaussianos (RPG) ´e utilizada para modelar as caracter´ısticas intr´ınsecas da principal s´erie temporal financeira. RPG retorna uma descri¸c˜ao estat´ıstica completa da vari´avel estimada, que pode ser tratada como uma medida de confian¸ca e pode ser utilizada como gatilho para classificar dados em confi´aveis ou n˜ao confi´aveis. Ademais, um est´agio de pr´e-processamento reconfigura a s´erie temporal original em uma estru-tura bidimensional. O algoritmo resultante, com RPG em seu n´ucleo, superou m´etodos preditivos cl´assicos como indicadores financeiros e redes neurais artificiais. No sistema de BI da CGAUD, um Modelo de Misturas Gaussianas (MMG) ´e utilizado para descrever o processo estoc´astico que governa a distribui¸c˜ao de probabilidades dos contracheques. Rotular uma probabilidade relativa em cada contracheque habilita o sistema de BI a list´a-los e filtr´a-los com base em suas probabili-dades. A inser¸c˜ao de um filtro estat´ıstico em um sistema de BI determin´ıstico resultou em efetiva redu¸c˜ao na quantidade de dados a serem analisados pelas trilhas de auditoria.
ABSTRACT
PREDICTIVE ANALYTICS VIA GAUSSIAN PROCESSES AND STATISTICAL AUDIT VIA GAUSSIAN MIXTURES IN BUSINESS INTELLIGENCE SYSTEMS Author: Bruno Hernandes Azenha Pilon
Supervisor: Prof. Dr. Jo˜ao Paulo Carvalho Lustosa da Costa Co-supervisor: Prof. Dr. Juan Jos´e Murillo-Fuentes
Programa de P´os-gradua¸c˜ao em Engenharia El´etrica Bras´ılia, April of 2015
A Business Intelligence (BI) system is an information system that employs tools from several ar-eas of knowledge for the collection, integration and analysis of data to improve and support the decision making process in companies and governmental institutions. The Ministry of Planning, Budget and Management, in portugueseMinist´erio do Planejamento, Or¸camento e Gest˜ao(MP), an agency of the Brazilian federal government, possesses a wide number of BI systems and, in this work, two of those systems were considered. The first BI system, maintained by the Fed-eral Patrimony Department, in portuguese Secretaria de Patrimˆonio da Uni˜ao (SPU), contains data regarding the monthly tax collection of that department, whereas the second BI system, maintained by the Human Resources Auditing Department, in portuguese Coordenadoria de In-teligˆencia e Auditoria Preventiva da Folha de Pagamentos (CGAUD), contains data regarding the payroll of Brazilian federal employees. Both systems were designed aimed at fraud and irregulari-ties detection such as tax evasion and unauthorized payments. Throughout the present work, we aim to incorporate stages into the existing BI systems in order to add predictive analytics and performance enhancements. In the BI system of SPU, Gaussian Process for Regression (GPR) is used to model the intrinsic characteristics of the core financial time series. GPR natively returns a full statistical description of the estimated variable, which can be treated as a measure of con-fidence and can be used as a trigger to classify trusted and untrusted data. In order to take into account the multidimensional structure of the original data, we also propose a pre-processing stage for reshaping the original time series into a bidimensional structure. The resulting algorithm, with GPR at its core, outperforms classical predictive schemes such as financial indicators and artificial neural networks. In the BI system of CGAUD, a Gaussian Mixture Model (GMM) is used to describe the stochastic process that governs the probability distribution of payrolls. Attaching a relative probability into each payroll enables the BI system to sort and filter payrolls based on their probabilities. Inserting a statistical filter in a deterministic BI system showed to be effective in reducing the amount of data to be analyzed by rule-based audit trails.
CONTENTS
1 INTRODUC¸ ˜AO . . . 1
1.1 CONTEXTO E MOTIVAC¸ ˜AO... 1
1.2 OBJETIVOS E CONTRIBUIC¸ ˜OES ... 4
1.3 ORGANIZAC¸ ˜AO DESTE TRABALHO ... 7
2 INTRODUCTION . . . 8
2.1 CONTEXT AND MOTIVATION ... 8
2.2 OBJECTIVES AND CONTRIBUTIONS... 10
2.3 ORGANIZATION OF THIS WORK ... 13
3 THEORETICAL FOUNDATION . . . 15
3.1 BUSINESS INTELLIGENCE ... 15
3.1.1 Key Components ... 16
3.1.2 Fraud Detection Applications ... 17
3.2 FINITE MIXTURE MODELS ... 19
3.2.1 Estimation of Parametric Mixture Models... 20
3.2.2 Expectation Maximization Algorithm ... 21
3.3 GAUSSIAN PROCESS FOR REGRESSION ... 23
3.3.1 Multivariate Gaussian Distribution ... 23
3.3.2 Gaussian Processes ... 25
3.3.3 Regression Model and Inference ... 26
3.3.4 Covariance Functions and its Hyperparameters ... 27
4 BUSINESS INTELLIGENCE SYSTEMS AND DATA . . . 30
4.1 PAYROLLS OF FEDERAL EMPLOYEES ... 31
5 STATISTICAL AUDIT . . . 36
5.1 STATYSTICAL ANALYSIS ON A DETERMINISTIC BI SYSTEM ... 36
5.1.1 Statistical Audit Module ... 38
5.1.2 GMM for Statistical Auditing ... 38
5.2 OPTIMIZATION AND EXPERIMENTAL RESULTS ... 40
6 PREDICTIVE ANALYTICS . . . 45
6.1 UNIDIMENSIONAL PREDICTOR MODEL ... 45
6.1.1 Mean and Covariance Function Modeling ... 45
6.1.2 Unidimensional Prediction Results ... 47
6.2 BIDIMENSIONAL DATASET RESHAPE ... 48
6.2.1 Time Cross-Correlation ... 49
6.2.2 Dataset Reshape... 50
6.3 OPTIMIZATION AND PREDICTION RESULTS ... 51
6.3.1 Hyperparameters Tuning ... 52
6.3.2 Bidimensional Prediction Results ... 54
6.3.3 Prediction Comparison and Error Metrics ... 54
6.3.4 Classification Stage Proposals... 56
7 CONCLUSIONS . . . 58
PUBLICATIONS FROM THIS WORK . . . 61
REFERENCES . . . 62
LIST OF FIGURES
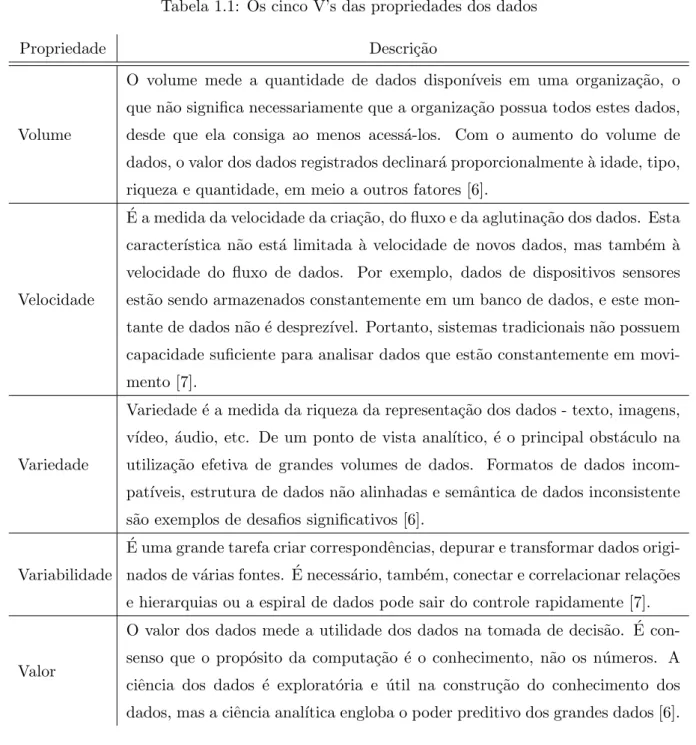
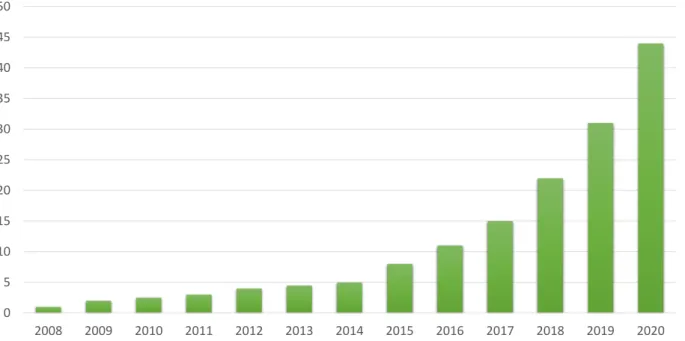
1.1 Estimativa do volume total de dados armazenados eletronicamente em ZB ao longo dos anos. Com uma taxa de crescimento composta anual de 40 por cento, a
esti-mativa do volume de dados armazenados deve alcan¸car 45 ZB no ano de 2020 [3]. ... 2
2.1 Estimation of the total volume of electronically stored data in ZB along the years. With a growing compound annual rate of 40 percent, stored data is estimated to reach nearly 45 ZB by 2020 [3]. ... 9
3.1 A traditional architecture and components of a generic BI system ... 16
4.1 Scatter plot of 10,000 samples of payroll data, with gross income in one dimension (ordinate) and total discounts and deductions in the other dimension (abscissa). Both dimensions are plotted inReais, the Brazilian currency. ... 31
4.2 Architecture of the current state-of-the-art BI system of CGAUD ... 32
4.3 Example of a concept map for an audit trail. Adapted from [14]. ... 33
4.4 Architecture of the current state-of-the-art BI system of SPU ... 34
4.5 Monthly tax collected by SPU, inreais (R$), indexed by the mth month. ... 35
5.1 Scatter plot of 10,000 samples of payroll data, showed in Fig. 4.1, with a zoom around the origin for a better visualization of the correlation profile. ... 37
5.2 Block architecture of the proposed statistical audit module solution in the original BI architecture shown in Fig. 4.2. ... 38
5.3 Contour plot of the estimated pdf of the dataset presented in Fig. 5.1 with (a) 8 sources (log-likelihood: −174317); (b) 16 sources (log-likelihood: −173282); (c) 24 sources (log-likelihood: −173019) and (d) 32 sources (log-likelihood: −172937). The axis in all subfigures are the same as in Fig.5.1. ... 41
6.1 Normalized plot of the posterior inference of the Gaussian process, indexed by a continuous time interval X = [0,80], obtained using the covariance function (a) k2,1(x,x′) in red (the periodic component) and k2,2(x,x′) in blue (the squared
exponential component); (b)k2(x,x′) in black (the product of both components). ... 47
6.2 Prediction results from conditioning the posterior Gaussian jointly distribution at a continuous time intervalX = [0,75]. The blue dots are the training data, the red dots are the target data, the black tick line is the expected value at a time index and the gray band represents the 95% confidence interval (two standard deviations above and below the expected value). ... 48 6.3 Estimated absolute normalized cross-correlation between the target data and the
hole SPU data set. The sequence was trimmed due the zero-padding, and the red circles highlights where the lagm is a multiple of 12 months. ... 50 6.4 Plot of the SPU data set converted in a 2D array... 51 6.5 Plot of the Gaussian process prediction in blue, target SPU data in red. The error
bars corresponds to a confidence interval of two standard deviations with respect to the predictive mean (around 95% of confidence)... 54 6.6 Monthly plot of target data and predictive results, in Reais (R$), indexed by the
LIST OF TABLES
1.1 Os cinco V’s das propriedades dos dados ... 3
2.1 The five V’s of data properties ... 10
3.1 Key components in BI systems framework ... 16
4.1 Legal attributions of MP ... 30
5.1 Fraud occurrences detected by audit trails, grouped by trail ID # and divided according to their probability of occurrence. ... 43
5.2 Total fraud occurrences detected by audit trails, divided according to their proba-bility of occurrence. ... 43
6.1 Optimized set of hyperparameters Θ, σ21and σn2 after 100 iterations, using the marginal likelihood with the kernel in (6.4)... 53
LIST OF ACRONYMS
ABS
Absolute Value. 42 ANN
Artificial Neural Network. 19, 59
BI
Business Intelligence. xi, xiii, 1, 2, 3, 4, 5, 6, 7, 8, 9, 10, 11, 12, 13, 15, 16, 17, 18, 19, 30, 31, 32, 34, 36, 37, 38, 42, 44, 45, 58, 59
CGAUD
Coordenadoria de Inteligˆencia e Auditoria Preventiva da Folha de Pagamentos (Intelligence and Preventive Audit of Payrolls Division). xi, 3, 4, 5, 7, 10, 11, 12, 13, 32, 36, 58, 59 CIO
Chief Information Officer. 58
DW
Data Warehouse. 17
E-Step
Expectation Step. 39 EB
Exabyte = 1018 bytes. 1, 8
EM
Expectation Maximization. 13, 21, 22, 38, 39, 40, 41, 42 ETL
GB
Gigabyte = 109 bytes. 4, 31
GMM
Gaussian Mixture Model. xi, 12, 13, 20, 36, 37, 38, 39, 40, 42, 44, 58 GPR
Gaussian Process for Regression. 12, 13, 26, 27, 28, 45, 47, 48, 51, 52, 55, 56, 59
iid
independently and identically distributed. 19, 20, 26, 27
KRR
Kernel Ridge Regression. 28, 52
M-Step
Maximization Step. 39 ME
Maximiza¸c˜ao da Esperan¸ca (Expectation Maximization). 7 ML
Machine Learning. 15, 17, 28 MMG
Modelo de Misturas Gaussiana (Gaussian Mixture Model). 5, 7 MP
Minist´erio do Planejamento, Or¸camento e Gest˜ao (Ministry of Planning, Budget and Man-agement). 4, 7, 11, 13, 30, 58
ODS
Operational Data Store. 16 OLAP
On-line Analytical Processing. 15, 17
RPG
Regrass˜ao por Processos Gaussianos (Gaussian Process for Regression). 6, 7
SIAPE
Sistema Integrado de Administra¸c˜ao de Recursos Humanos (Integrated System of Human Resources Administration). 31, 32, 37, 38, 40
SPU
Secretaria de Patrimˆonio da Uni˜ao (Federal Patrimony Department). xi, xii, 3, 5, 6, 7, 10, 12, 13, 31, 33, 34, 35, 45, 46, 47, 48, 49, 50, 54, 55, 56, 58, 59
SVM
Supported Vector Machine. 28, 52
ZB
Cap´ıtulo 1
INTRODUC
¸ ˜
AO
1.1
CONTEXTO E MOTIVAC
¸ ˜
AO
Conhecimento ´e poder. Em corpora¸c˜oes e institui¸c˜oes governamentais, informa¸c˜oes referentes a inteligˆencia do neg´ocio s˜ao vitais para auxiliar a alta administra¸c˜ao no processo de tomada de decis˜ao, na condu¸c˜ao dos neg´ocios e nas opera¸c˜oes institucionais [1]. Neste dom´ınio de conheci-mento, BI1 evoluiu como um importante campo de pesquisa. Ademais, mesmo fora do mundo acadˆemico, BI foi reconhecida como uma iniciativa estrat´egica em aumentar a efic´acia e gerar inova¸c˜oes em diversas aplica¸c˜oes pr´aticas no universo dos neg´ocios.
Neste contexto, avan¸cos tecnol´ogicos aumentaram massissamente o volume de dados e in-forma¸c˜oes dispon´ıveis eletronicamente, onde cerca de 2,5 EB de dados s˜ao criados a cada dia ao redor do mundo, e este n´umero dobra a cada 40 meses aproximadamente [2]. A Fig. 1.1 ilustra esta tendˆencia de aumento exponencial do volume de dados ao longo dos anos. Por outro lado, grande parte destes novos dados n˜ao possuem qualquer estrutura associada. Organizar e analisar este volume de dados em ascens˜ao e encontrar, em seu conte´udo, significado e informa¸c˜ao ´util s˜ao pontos chave para sistemas de BI.
Sobre este t´opico, Hal Varian, Economista-Chefe do Google e professor em´erito da Univer-sidade da Calif´ornia, comentou: “Ent˜ao, o que est´a se tornando onipresente e barato? Dados. E o que ´e complementar aos dados? An´alise. Ent˜ao, minha recomenda¸c˜ao ´e frequentar muitos cursos relacionados `a manipula¸c˜ao e an´alise de dados: banco de dados, aprendizado de m´aquina, econometria, estat´ıstica, visualiza¸c˜ao, e assim por diante.” [4].
N˜ao obstante o volume crescente de dados, a gest˜ao de grandes dados tamb´em lida com a variedade, a velocidade, a variabilidade e o valor dos dados. Em [5], pela primeira vez, a gest˜ao de dados foi tratada a partir de uma vis˜ao tridimensional, onde o volume, a velocidade e a
0 5 10 15 20 25 30 35 40 45 50
2008 2009 2010 2011 2012 2013 2014 2015 2016 2017 2018 2019 2020
Figura 1.1: Estimativa do volume total de dados armazenados eletronicamente em ZB ao longo dos anos. Com uma taxa de crescimento composta anual de 40 por cento, a estimativa do volume de dados armazenados deve alcan¸car 45 ZB no ano de 2020 [3].
variedade contribuem, de forma independente, para o desenvolvimento de ferramentas e algoritmos para a gest˜ao de dados. Em [6], os autores adicionam duas outras dimens˜oes nesta perspectiva: variabilidade e valor. Estas propriedades est˜ao resumidas na Tabela 1.1.
Com todo este montante de dados se tornando onipresente e barato, novas ferramentas de captura, descoberta e an´alise podem ajudar empresas e institui¸c˜oes governamentais a ganhar conhecimento a partir dos seus dados desestruturados, que respondem por mais de 90% do universo digital [8]. Estas ferramentas podem ser programadas para criar dados sobre dados de forma automatizada, assim como as rotinas de reconhecimento facial que ajudam a identificar fotos no Facebook. Dados sobre dados, ou metadados, crescem ao dobro da taxa do universo digital como um todo [8].
Como consequˆencia deste cen´ario, onde mais e mais dados s˜ao armazenados e processados eletronicamente e vastas quantidades de informa¸c˜ao est˜ao se tornando facilmente dispon´ıveis, o processo de tomada de decis˜ao em empresas e organiza¸c˜oes governamentais est´a consideravelmente mais r´apido nos dias atuais. Tomadores de decis˜oes estrat´egicas s˜ao expostos a um enorme fluxo de dados e informa¸c˜ao e est˜ao sob constante press˜ao para responder a situa¸c˜oes excepcionais e para aproveitar oportunidades de neg´ocio dispon´ıveis em curtos espa¸cos de tempo.
ferra-Tabela 1.1: Os cinco V’s das propriedades dos dados
Propriedade Descri¸c˜ao
Volume
O volume mede a quantidade de dados dispon´ıveis em uma organiza¸c˜ao, o que n˜ao significa necessariamente que a organiza¸c˜ao possua todos estes dados, desde que ela consiga ao menos acess´a-los. Com o aumento do volume de dados, o valor dos dados registrados declinar´a proporcionalmente `a idade, tipo, riqueza e quantidade, em meio a outros fatores [6].
Velocidade ´
E a medida da velocidade da cria¸c˜ao, do fluxo e da aglutina¸c˜ao dos dados. Esta caracter´ıstica n˜ao est´a limitada `a velocidade de novos dados, mas tamb´em `a velocidade do fluxo de dados. Por exemplo, dados de dispositivos sensores est˜ao sendo armazenados constantemente em um banco de dados, e este mon-tante de dados n˜ao ´e desprez´ıvel. Portanto, sistemas tradicionais n˜ao possuem capacidade suficiente para analisar dados que est˜ao constantemente em movi-mento [7].
Variedade
Variedade ´e a medida da riqueza da representa¸c˜ao dos dados - texto, imagens, v´ıdeo, ´audio, etc. De um ponto de vista anal´ıtico, ´e o principal obst´aculo na utiliza¸c˜ao efetiva de grandes volumes de dados. Formatos de dados incom-pat´ıveis, estrutura de dados n˜ao alinhadas e semˆantica de dados inconsistente s˜ao exemplos de desafios significativos [6].
Variabilidade ´
E uma grande tarefa criar correspondˆencias, depurar e transformar dados origi-nados de v´arias fontes. ´E necess´ario, tamb´em, conectar e correlacionar rela¸c˜oes e hierarquias ou a espiral de dados pode sair do controle rapidamente [7].
Valor
O valor dos dados mede a utilidade dos dados na tomada de decis˜ao. ´E con-senso que o prop´osito da computa¸c˜ao ´e o conhecimento, n˜ao os n´umeros. A ciˆencia dos dados ´e explorat´oria e ´util na constru¸c˜ao do conhecimento dos dados, mas a ciˆencia anal´ıtica engloba o poder preditivo dos grandes dados [6].
1.2
OBJETIVOS E CONTRIBUIC
¸ ˜
OES
Neste trabalho, objetiva-se incorporar est´agios em sistemas existentes de BI do governo federal brasileiro, adicionando a estes capacidade de an´alise preditiva e melhorias de performance. O governo federal brasileiro possui um vasto n´umero de sistemas de BI e, neste trabalho, dois destes sistemas ser˜ao utilizados. O primeiro sistema, mantido pela CGAUD, cont´em dados relativos `
a folha de pagamento dos servidores p´ublicos federais. O segundo sistema, mantido pela SPU, cont´em dados relativos `a arrecada¸c˜ao mensal de impostos daquele ´Org˜ao federal. Ambos os sistemas foram desenvolvidos com foco em detec¸c˜ao de fraudes e irregularidades, como a evas˜ao fiscal e pagamentos n˜ao autorizados.
M´etodos para detec¸c˜ao de irregularidades s˜ao classificados principalmente em duas catego-rias [11]. Uma ´e a detec¸c˜ao baseada no conhecimento, onde ocorrˆencias fraudulentas s˜ao previ-amente definidas e categorizadas. Portanto, neste tipo de detec¸c˜ao, a irregularidade precisa ser conhecida e descrita a priori e o sistema normalmente n˜ao consegue lidar com tipos de irregulari-dades novos ou desconhecidos. Detec¸c˜ao de intrus˜ao baseada no conhecimento em redes e sistemas de computadores s˜ao mostradas em [12].
Como alternativa, um esquema de detec¸c˜ao de fraudes baseado em comportamento assume que uma irregularidade possa ser detectada pela observa¸c˜ao de ocorrˆencias que s˜ao mais dissimilares que o normal [11]. Um comportamento v´alido e padr˜ao pode ser extra´ıdo de informa¸c˜oes pr´evias de referˆencia, e este modelo pode ser comparado a um poss´ıvel candidato fraudulento de modo a checar o grau de divergˆencia entre eles. Em [13], os autores apresentam um sistema de detec¸c˜ao de fraudes em cart˜oes de cr´edito cuja metodologia utiliza redes neurais treinadas com dados anteriores relacionados.
O sistema atual da CGAUD ´e baseado inteiramente em detec¸c˜ao de irregularidades por co-nhecimento. A CGAUD, subordinada ao MP, criou seu sistema de BI com o objetivo de detectar irregularidades na folha de pagamento dos servidores p´ublicos federais. A proposta inicial do sistema de BI foi apresentada em [14] e diversos aperfei¸coamentos foram propostos em [15], [16] e [1*]. A vers˜ao mais recente do sistema de BI da CGAUD utiliza trilhas de auditoria constru´ıdas com indexa¸c˜ao ontol´ogica via mapas conceituais para detectar inconsistˆencias [14, 15, 1*]. As trilhas de auditoria consistem em um conjunto de heur´ısticas baseado em uma legisla¸c˜ao federal brasileira complexa, que dita o sal´ario de cada servidor p´ublico federal de acordo com seu cargo e sua posi¸c˜ao na administra¸c˜ao p´ublica.
bastante elevado, dado que cada trilha de auditoria varre todo o banco de dados na busca por irregularidades.
De fato, enquanto a folha de pagamentos mensal dos servidores p´ublicos federais brasileiros gira em torno de R$12,5 bilh˜oes, o atual sistema de BI da CGAUD ´e capaz de auditar aproximadamente R$5 bilh˜oes a cada mˆes [1*].
Neste cen´ario, nossa proposta ´e incorporar t´ecnicas de modelagem de mistura finita com o objetivo de computar a distribui¸c˜ao de probabilidades das folhas de pagamento. ´E consenso que modelos de mistura constituem uma ferramenta probabil´ıstica vers´atil para representar a presen¸ca de subpopula¸c˜oes em conjuntos de observa¸c˜oes. Desta forma, modelos de mistura facilitam uma descri¸c˜ao muito mais detalhada de sistemas complexos, ao passo que descrevem caracter´ısticas diversas dos dados ao inferir todos os parˆametros de cada componente da mistura e explicando como este conjunto de fontes interagem para formar um modelo de mistura.
Evidˆencias da versatilidade de modelos de mistura s˜ao demonstradas pela aplica¸c˜ao deste t´opico em diversas ´areas do conhecimento, como a astronomia [17], ecologia [18] e engenharia [19]. No contexto de sistemas de BI, modelos de mistura podem ser utilizados para representar fun¸c˜oes de densidade de probabilidade arbitrariamente complexas [20]. Esta caracter´ıstica faz dos mode-los de mistura uma escolha confi´avel para representar fun¸c˜oes de verossimilhan¸ca complexas em cen´arios de aprendizado supervisionado [21], ou defini¸c˜oes a priori em estima¸c˜oes de parˆametros Bayesiana [22].
No sistema de BI da CGAUD, a hip´otese que buscamos validar ´e a existˆencia de uma rela¸c˜ao direta entre a probabilidade de ocorrˆencia das folhas de pagamento dos servidores p´ublicos federais brasileiros e a detec¸c˜ao de fraudes atualmente existente nas trilhas de auditoria. Em outras pala-vras, contracheques improv´aveis - que mais divergem do padr˜ao - possivelmente tˆem mais chances de possu´ırem algum tipo de irregularidade e de serem identificados pelas trilhas de auditoria.
Neste sentido, propomos uma abordagem estat´ıstica complementar, com um filtro generativo baseado em MMG em um est´agio de pr´e-processamento, com o objetivo de computar a pro-babilidade das folhas de pagamento e excluir as folhas mais prov´aveis das trilhas de auditoria subsequentes. Ao aprender um modelo de mistura que representa o comportamento mais prov´avel das folhas de pagamento dos servidores p´ublicos federais brasileiros, n´os conseguimos executar uma sele¸c˜ao qualitativa no conjunto de todas as folhas de pagamento e entregar `as trilhas de auditoria somente as folhas de pagamento que mais divergem da norma.
Esta nova abordagem aumentou a eficiˆencia do sistema de BI, bem como a sua capacidade de processamento, com uma penalidade de perda de alguns falso negativos neste est´agio proposto.
hip´otese que buscamos validar ´e a possibilidade de aumentar a eficiˆencia do algoritmo preditivo atualmente existente no sistema de BI da SPU - baseado em redes neurais artificiais - em termos de m´etricas de erro.
O modelo escolhido como n´ucleo da predi¸c˜ao ´e baseado em RPG, uma fam´ılia de processos es-toc´asticos largamente utilizada na modelagem de dados interdependentes, primariamente devido a duas propriedades essenciais que ditam o comportamento da vari´avel predita. Primeiro, um processo Gaussiano ´e completamente determinado por suas fun¸c˜oes de m´edia e de covariˆancia, o que reduz a quantidade de parˆametros a serem especificados j´a que somente os primeiro e segundo momentos do processo s˜ao requeridos. Segundo, os valores preditos s˜ao fun¸c˜ao dos valores observa-dos, onde todos os conjuntos de distribui¸c˜oes dimensionalmente finitas possuem uma distribui¸c˜ao Gaussiana multivariada.
Em um ambiente de BI, o fato de RPG retornar uma descri¸c˜ao estat´ıstica completa da vari´avel predita pode adicionar confian¸ca ao resultado final e ajudar na avalia¸c˜ao de sua pr´opria perfor-mance. Ademais, a descri¸c˜ao estat´ıstica pode ser utilizada como gatilho para transformar um problema de regress˜ao em um problema de classifica¸c˜ao a depender do contexto. Quando lida-mos com dados multidimensionais, RPG pode ser modelado de maneira independente em cada dimens˜ao, o que adiciona flexibilidade para conjuntos de dados com diferentes graus de correla¸c˜ao entre suas dimens˜oes.
Neste trabalho, n´os utilizamos RPG para modelar a quantidade de imposto arrecadado men-salmente pela SPU. Considerando que a s´erie temporal advinda da SPU possui uma estrutura mul-tidimensional, ainda que oculta, foi desenvolvido neste trabalho um est´agio de pr´e-processamento para reorganizar o conjunto original dos dados em uma estrutura bidimensional.
regress˜ao supervisionada.
RPG provˆe um ambiente completamente transparente, permitindo modelar uma rela¸c˜ao de entrada-sa´ıda de um processo sem camadas ocultas ou nebulosas, restando poss´ıvel adaptar ca-racter´ısticas espec´ıficas de um sistema de detec¸c˜ao de fraude de modo a mantˆe-lo atualizado com um novo eventual comportamento fraudulento.
1.3
ORGANIZAC
¸ ˜
AO DESTE TRABALHO
No cap´ıtulo 3, expomos a fundamenta¸c˜ao te´orica que embasa este trabalho. Componentes chave em sistemas de BI e o estado da arte em aplica¸c˜oes no campo da detec¸c˜ao de fraudes s˜ao apresentados na Se¸c˜ao 3.1. A Se¸c˜ao 3.2 apresenta uma introdu¸c˜ao a modelos de misturas finitas, com foco em MMG e no algoritmo de ME. Na Se¸c˜ao 3.3, um modelo preditivo gen´erico baseado em RPG ´e derivado, com a sele¸c˜ao da fun¸c˜ao de covariˆancia e a otimiza¸c˜ao dos seus hiper-parˆametros. No cap´ıtulo 4, descrevemos o atual sistema e dados de BI geridos pelo MP que receberam interven¸c˜oes e melhorias ao longo deste trabalho. Na Se¸c˜ao 4.1, dissecamos o sistema de BI da CGAUD e exploramos a metodologia utilizada na auditoria da folha de pagamento de servidores p´ublicos federais brasileiros. Na Se¸c˜ao 4.2, mostramos os dados de BI da SPU, que ´e constitu´ıdo de uma s´erie temporal hist´orica com a arrecada¸c˜ao de impostos efetuada por aquele ´Org˜ao.
No cap´ıtulo 5, desenvolvemos m´etodos para a aplica¸c˜ao de MMG no sistema de BI da CGAUD. Na Se¸c˜ao 5.1, analisamos as implica¸c˜oes de um m´odulo de an´alise estat´ıstica incorporado em um sistema de BI determin´ıstico, i.e. o que o sistema tem a ganhar e quais s˜ao as poss´ıveis armadilhas neste tipo de abordagem. Na Se¸c˜ao 5.2, discorremos sobre a otimiza¸c˜ao e os resultados experimentais desta aplica¸c˜ao espec´ıfica.
No cap´ıtulo 6, propomos um m´odulo de an´alise preditiva com RPG em seu n´ucleo para os dados de BI da SPU. Na Se¸c˜ao 6.1, desenvolvemos um modelo preditivo unidimensional que captura as caracter´ısticas intr´ınsecas dos dados de BI da SPU. Na Se¸c˜ao 6.2, propomos uma abordagem diferente para o m´odulo preditivo, transformando o conjunto de dados original em um conjunto de dados bidimensional. Na Se¸c˜ao 6.3, os resultados da otimiza¸c˜ao s˜ao apresentados e os resultados experimentais s˜ao comparados com outras t´ecnicas preditivas por meio de diversas m´etricas de erro.
Chapter 2
INTRODUCTION
2.1
CONTEXT AND MOTIVATION
Knowledge is power. In corporations and governmental institutions, high-level management needs business intelligent information to efficiently manage business and institutional operations and support their process of decision making [1]. In this domain of expertise, BI has evolved as an important field of research. Furthermore, outside of the academic world, BI has been recognized as a strategic initiative and a key enabler for effectiveness and innovations in several practical applications in the business universe.
In this context, advances in technology has massively increased the volume of electronic data available, with about 2.5 EB of digital data being created each day in the world, and that number is doubling every 40 months approximately [2]. Fig. 2.1 shows the increase trend of data in volume each year. On the other hand, a great part of this new data lacks structure. Organize and analyze this rising volume of raw data and find meaningful and useful information in its content are key points in BI systems.
On this topic, Hal Varian, Chief Economist at Google and emeritus professor at the University of California, Berkeley, commented: “So what’s getting ubiquitous and cheap? Data. And what is complementary to data? Analysis. So my recommendation is to take lots of courses about how to manipulate and analyze data: databases, machine learning, econometrics, statistics, visualization, and so on.” [4].
0 5 10 15 20 25 30 35 40 45 50
2008 2009 2010 2011 2012 2013 2014 2015 2016 2017 2018 2019 2020
Figure 2.1: Estimation of the total volume of electronically stored data in ZB along the years. With a growing compound annual rate of 40 percent, stored data is estimated to reach nearly 45 ZB by 2020 [3].
summarized in Table 2.1.
With all this data getting cheap and ubiquitous, new capture, search, discovery, and analysis tools can help organizations and governmental institutions gain insights from their unstructured data, which accounts for more than 90% of the digital universe [8]. These tools can be programmed to create data about data in an automated way, much like facial recognition routines that help tag Facebook photos. Data about data, or metadata, is growing twice as fast as the digital universe as a whole [8].
As a consequence of this scenario, where more and more data are stored and processed elec-tronically and vasts amounts of information are becoming easily available and retrievable, the decision making cycles in enterprises and governmental organizations are considerably shorter in our days. Strategic decision makers are being exposed to huge inflows of data and information and are constantly under pressure to respond to exceptional situations and to take advantage of time-sensitive business opportunities.
Table 2.1: The five V’s of data properties
Property Description
Volume
Data volume measures the amount of data available to an organization, which does not necessarily have to own all of it as long as it can access it. As data volume increases, the value of different data records will decrease in proportion to age, type, richness, and quantity among other factors [6].
Velocity
Data velocity measures the speed of data creation, streaming, and aggregation. This characteristic is not being limited to the speed of incoming data but also speed at which the data flows. For example, the data from the sensor devices would be constantly moving to the database store and this amount would not be small enough. Thus our traditional systems are not capable enough on performing the analytics on the data which is constantly in motion [7].
Variety
Data variety is a measure of the richness of the data representation - text, im-ages video, audio, etc. From an analytic perspective, it is mainly the biggest obstacle to effectively using large volumes of data. Incompatible data for-mats, non-aligned data structures, and inconsistent data semantics represents significant challenges that can lead to analytic sprawl [6].
Variability
It is quite an undertaking to link, match, cleanse and transform data across systems coming from various sources. It is also necessary to connect and cor-relate relationships, hierarchies and multiple data linkages or data can quickly spiral out of control [7].
Value
Data value measures the usefulness of data in making decisions. It has been noted that the purpose of computing is insight, not numbers. Data science is exploratory and useful in getting to know the data, but analytic science encompasses the predictive power of big data [6].
The BI systems contribute to optimizing business processes and resources, maximizing profits and improving proactive decision making [10].
2.2
OBJECTIVES AND CONTRIBUTIONS
collection of that federal department. Both systems were designed aimed at fraud and irregularities detection such as tax evasion and unauthorized payments.
Methods for irregularities detection are mainly classified in two categories [11]. One is knowledge-based detection, where fraudulent occurrences are previously defined and categorized. Thus, in this kind of detection, the irregularity must be known and described a priori and the system is usually unable to deal with new or unknown irregularities. Knowledge-based intrusion detection schemes in network and computer systems are shown in [12].
Alternatively, a behavior-based fraud detection scheme assumes that an irregularity can be detected by observing occurrences that are most dissimilar from the norm [11]. A valid and standardized behavior can be extracted from previous reference information, and this model can be compared to a fraudulent candidate in order to check for the degree of divergence between them. In [13], the authors present a credit card fraud detection method using neural networks trained with previous related data.
The current CGAUD BI system is entirely based on a knowledge-based approach for irreg-ularity detection. CGAUD, subordinated to MP, created its own BI system with the objective of detect irregularities on the payrolls of the Brazilian federal staff. The initial BI solution was presented in [14] and several improvements were proposed in [15], [16] and [1*]. The most recent BI system of CGAUD uses audit trails built with ontological indexation via concept maps in order to detect inconsistencies [14, 15, 1*]. The audit trails consist on a set of heuristics based on a complex Brazilian federal legislation, which dictates the income of each public employees according to their position in the public administration organization.
In addition to a complex regulatory basis, the amount of data periodically generated regarding the payroll of federal employees is massive: Around 14GB of raw data per month, and more than 200 million rows in the financial data table each year [16]. Thus, the processing cost of auditing this amount of data is very high, since each audit trail has to go through all database performing relational statements on the search for irregularities.
In fact, whereas the monthly payroll of the Brazilian federal staff is around 12.5 billionreais, the current BI system of CGAUD is capable of auditing approximately 5 billionreais each month [1*]. In this scenario, we propose to incorporatefinite mixture modelstechniques in order to compute the pdf of payrolls. It is known that mixture models constitute a versatile probabilistic tool for representing the presence of subpopulations within a set of observations. They thus facilitate a much more detailed description of complex systems, describing different features of the data by inferring all the parameters of each component of the mixture and by explaining how the set of sources interact together to form a mixture model.
astronomy [17], ecology [18] and engineering [19]. In the context of BI systems, mixture models can be used to represent arbitrarily complex probability density functions [20]. This characteristic makes them a reliable choice for representing complex likelihood functions in supervised learning scenarios [21], or priors for Bayesian parameter estimation [22].
In the BI system of CGAUD, the hypothesis we seek to test is the existence of a direct relationship between the probability of occurrence of payrolls of the Brazilian federal employees and the fraud detection currently performed by the audit trails. In other words, unlikely payrolls - that most diverge from the norm - have more chances of being detected by the audit trails for some irregularity.
Under this perspective, we propose a complementary statistical approach, with a generative GMM filter in a pre-processing stage with the objective of compute payrolls with low probability of occurrence as being irregular and exclude them of the following audit trails. By learning a mixture model that represents the most probable behavior of the payrolls of the Brazilian federal staff, we are able to perform a selection on all payrolls and deliver to the audit trails only payrolls that diverge the most from the norm.
This new approach significantly increases the efficiency of the BI system and its processing capacity, with a penalty of losing a few false negatives at this proposed stage.
On the other hand, in the BI system maintained by SPU, we propose to add a predictive analytics module in order to forecast the amount of tax to be collected by that federal organization. The hypothesis we intent to validate is the possibility to improve the error rates of the predictive algorithm currently employed in the BI system of SPU, which is based on artificial neural networks. The model chosen as the core predictor is based on GPR, a widely used family of stochastic process schemes for modeling dependent data primarily due two essential properties that dictate the behavior of the predicted variable [24]. First, a Gaussian process is completely determined by its mean and covariance functions, which reduces the amount of parameters to be specified since only the first and second order moments of the process are needed. Second, the predicted values are a function of the observed values, where all finite-dimensional distributions sets have a multivariate Gaussian distribution [25].
In a BI environment, the fact that GPR returns a complete statistical description of the predicted variable can add confidence to the final result and help the evaluation of its own perfor-mance. Additionally, the statistical description can be used as a trigger to transform a regression problem into a classification problem depending on the context. When dealing with multidimen-sional data, GPR can be independently modeled in each dimension, which adds flexibility for data sets with different degrees of correlation among its dimensions.
Con-sidering that the time series provided by SPU possess a latent multidimensional structure, we propose a pre-processing stage to reshape that original data set into a bidimensional structure.
In the BI system of SPU, a supervised regression method to predict the amount of tax collected at a given period by SPU is proposed. An approach based on predictive regression using Gaussian processes was developed to forecast the amount of tax that is most likely to occur at the point of interest. Furthermore, as BI systems aimed at fraud detection often requires a classification stage to label trusted and possibly fraudulent data, we show that GPR can be used both in the predictive and the classification stages using the statistical description of the continuous predicted variable as a trigger measure to classify regular or possibly fraudulent data.
According to [23], a regression problem can be seen as a classification problem where the number of predicted classes tends to infinity. Similarly, one can say that a classification problem can be solved by applying a set of heuristics into a regression environment to break the continuous variable into a finite-length set of classes. Considering also that GPR returns not only a predicted value, but a full conditional statistical description of the estimated variable, we focus on supervised regression.
GPR provides a complete transparent environment, allowing to model the input-output rela-tionship of a process with no hidden or nebulous layers, making possible to adapt specific charac-teristics of a fraud detection system to keep in tune with an eventual new fraud behavior.
2.3
ORGANIZATION OF THIS WORK
In Chapter 3, we expose the theoretical foundation on which this work is based. Key compo-nents in BI systems and the state-of-the-art applications in the field of fraud detection are shown in Section 3.1. Section 3.2 presents a gentle introduction to finite mixture models, focusing on GMM and the EM algorithm. In Section 3.3, a generic predictive model based on GPR is derived, with covariance function selection and hyperparameters tuning.
In Chapter 4, we describe the current BI systems and data managed by MP that have received improvements and enhancements throughout this work. In Section 4.1, we dissect the BI system of CGAUD and explore the methodology used to audit payrolls of Brazilian federal employees. In Section 4.2, we show the BI data of SPU, which is consisted of a time series with historical federal tax collected.
In Chapter 6, we propose a predictive analytics module, with GPR at its core, for the BI data of SPU. In Section 6.1, we develop a unidimensional predictor model that captures the intrinsic characteristics of the BI data of SPU. In Section 6.2, we propose a different approach to the predictive module by transforming the original data set into a bidimensional data set. In Section 6.3, the optimization results are shown and the experimental results are compared with other predictive approaches by several error metric.
Chapter 3
THEORETICAL FOUNDATION
3.1
BUSINESS INTELLIGENCE
The term BI has been used since late 1960s [26], where the author definedBusiness as a collec-tion of activities carried on for whatever purpose, be it science, technology, commerce, industry, law, government, defense, et cetera. The communication facility serving the conduct of a business, in the broad sense, may be referred to as an intelligence system. The notion ofintelligence is also defined, in a more general sense, as “the ability to apprehend the interrelationships of presented facts in such a way as to guide action towards a desired goal” [26].
BI, as it is understood today, is said to have evolved from the decision support systems which began in the 1960s and developed throughout the 80s [27]. According to [28], the term BI was coined in 1989 as an umbrella term to describe “concepts and methods to improve business decision making by using fact-based support systems.” It was not until the late 1990s that this usage was widespread [27].
A BI system combines data gathering, data storage, and knowledge management with analyt-ical tools to present complex and competitive information to planners and decision makers [29]. The objectives are to enable business managers and analysts of all levels to readily access any data in the organization and to conduct appropriate manipulation and analysis [30]. Implicit in this definition is the notion that a BI system can improve the timeliness and quality of the input to the decision making process [31].
techniques in applications that are so large and complex that they require advanced and unique data storage, management, analysis, and visualization technologies [33].
3.1.1 Key Components
From a process point of view, BI systems can be divided into two primary activities: insert data into the system and extract information and knowledge out of the system [34]. The key components of a BI system framework is summarized in Table 3.1 [35].
Table 3.1: Key components in BI systems framework
Layer Description
Data Source Manages the external sources of data, operational databases and transaction systems
Data Integration ETL tools, that are responsible for data transfer from data sources to data warehouses
Data Storage Data warehouses, to provide some room for thematic storing of ag-gregated data
Data Analysis Knowledge discovery tools, which determines patterns, generaliza-tions, probabilities, regularities and heuristics in data resources Data Presentation Reporting and ad hoc inquiry tools, for different synthetic reports
and customized graphical and multimedia interfaces
The traditional architecture of the key components in generic BI systems is shown in Fig. 3.1.
DATA SOURCES DATA
INTEGRATION DATA STORAGE DATA ANALYSIS
DATA PRESENTATION
External Data Sources
Internal Database
Operational Data Store
Complex event processing
ETL
Relational DBMS
MapReduce Engine
Reporting Servers Analytic Engines Enterprise Search Engine OLAP Server
Search
Spreadsheet
Dashboard
Data Context Information Knowledge
Actions
Usually, the first conceptual step in the development of a BI system regards its data integration layer, which often translates into an ETL process, although some pre-processing stages can be performed when the data is coming from an external data source, such as the use of an ODS [36]. ETL refers to a collection of tools that plays a crucial role in helping discover and correct data quality issues and efficiently load large volumes of data into the warehouse. The accuracy and timeliness of reporting, ad hoc queries, and data analysis depends on being able to efficiently get high-quality data into the DW from operational databases and external data sources [37].
In the data storage layer, DW store current and historical data, which are later used for creating trending reports for senior management. Other basic elements in the data storage layer are the Data Marts. They are subsets of data stored at the DW, and are devoted to respond for a necessity to work with a specific population.
The architecture of the Data Mart and the DW is a main concept that will impact on the performance of the system [29]. Whether a bottom-up structure proposed by [38], or a top-down structure proposed by [39], or even if big data technology [29] will be incorporated to the system make a significant difference in the system responsiveness.
The data analysis layer contains the business analytics tools aimed at extracting knowledge from the stored data [29]. OLAP tools enable users to analyze multidimensional data interactively from multiple perspectives, whereas analytic engines, commonly based on ML techniques, seeks for patterns, classes, statistical parameters and other relevant characteristics on the data.
The presentation layer converts the raw knowledge information to different reports and cus-tomized interfaces for each different end user at any level of the organization [29]. Role based BI is a concept that suggests that it is not necessary to drown people with information, but rather delivery just the information they need, customized to their function. The architecture should support every level of end user, including external consumers to the organization [29].
3.1.2 Fraud Detection Applications
In the context of BI systems, fraud detection schemes is a continuously evolving topic. In 2012, global credit, debit and prepaid card fraud losses reach $11.27 billion [40]. Of that, card issuers lost 63% and acquires lost the other 37% [40].
In a competitive environment, fraud can become a business critical problem if it is very preva-lent and if the prevention procedures are not fail-safe [41]. Fraud detection, being part of the overall fraud control, has become one of the most established industrial and governmental data mining applications [41].
public domain, criminals are likely to use this information to evade themselves of this type of detection, limiting the public exchange of ideas regarding this topic [11].
In many applications, BI systems aimed at fraud detection deal with huge data sets. For example, business general-purpose credit card transactions in the United States reached 3.4 billion in 2012 [42]. Search for fraudulent transactions in such data sets makes data mining techniques relevant, requiring more than state-of-the-art statistical models [11].
The need for fast and efficient algorithms makes automated fraud detection techniques widely varied, but there are common features. Essentially, those methods compare observed or estimated data with expected values [11].
In addition, automated fraud detection methods can be divided in supervised and unsuper-vised. Supervised methods use samples of known to be either fraudulent and nonfraudulent data in order to construct a model that classifies new data into one of those two classes [11]. In this case, the objective is to obtain a model to maximize the differences between fraudulent and nonfraudulent data, which requires a high confidence about the records used as fraudulent and trustable. Also, the use of supervised methods can only be applied to detect types of fraud that have previously occurred or simulated.
On the other hand, unsupervised methods seek for samples that are most dissimilar from the norm [11]. In this case, the goal is to model the normal behavior of the monitored environment and to establish a quantifiable measure that segregates a possibly fraudulent event. Frequently, unsupervised methods are used to alert the fact that an observation is anomalous and requires a closer investigation.
Some of the most commonly used techniques for automated fraud detection applications are:
• Data preprocessing techniques for detection, validation, error correction, and filling up of missing or incorrect data.
• Calculation of various statistical parameters such as averages, quantiles, performance met-rics, probability distributions, etc..
• Models and probability distributions of various business activities either in terms of various parameters or probability distributions.
• Computing user profiles.
• Time-series analysis of time-dependent data.
• Matching algorithms to detect anomalies in the behavior of transactions or users as compared to previously known models and profiles. Techniques are also needed to eliminate false alarms, estimate risks, and predict future of current transactions or users.
• Data mining to classify, cluster, and segment the data and automatically find associations and rules in the data that may signify interesting patterns, including those related to fraud. • Expert systems to encode expertise for detecting fraud in the form of heuristics.
• Pattern recognition to detect approximate classes, clusters, or patterns of suspicious behavior either unsupervised or to match given inputs.
• Machine learning techniques to automatically identify characteristics of fraud.
• Neural networks that can learn suspicious patterns from samples and used later to detect them.
Automated fraud detection approaches have been used in [43], where statistical analysis were used to detect medicaid1 claim fraudulent requests; in [44], where an ANN is used for fraud detection in credit card operations; in [45], where an ANN based predictor was used in real world BI data for forecasting a time series and heuristics based on error metrics decides if the predicted data is possibly fraudulent or regular. In [46], supported vector machines and genetic algorithms are used to identify electricity theft.
3.2
FINITE MIXTURE MODELS
A convex combination of two or more pdf is a mixture. The approximation of any arbitrary distribution can be achieved by the combination of the properties of a set of individual pdf [47], making mixture models a powerful tool for modeling complex data. While within a parametric fam-ily, mixture models offer malleable approximations in non-parametric settings and, although based on standard distributions, mixture models pose highly complex computational challenges [48].
To accompany our model, letX = (x1,x2, . . . ,xL) be an unlabeled random sample obtained
in an iid manner. The pdf of a mixture model is defined as
p(x|Θ) =
K X k=1
αkpk(x|θk) k= 1, . . . , K, (3.1)
1Medicaid is a social health care program for families and individuals with low income and limited resources in
where x = (x1, . . . , xd)T ∈ Rd is a set of d observed random samples, K ∈ Z+ is the number
of components (sources) in the mixture, pk(x|θk) is the pdf of the kth component and Θ = (α1, . . . , αK, θ1, . . . , θK)∈Ω is the set of parameters of the mixture, with Ω being the parameter
space of all possible combinations of values for all the different parameters of the mixture [49]. The collection αk is the mixing proportion (or weighting factor) of the kth component, representing
the probability that a randomly selected xi ∈ X was generated by the kth component.
In the particular case of a Gaussian mixture model, (3.1) can be written as
p(x|Θ) =
K X
k=1
αkpk(x|µk,Σk), (3.2)
whereµk∈Rdis the mean vector andΣk ∈Rd×dis the covariance matrix, both of them originated
by the kth Gaussian component. Each of those component density is a Gaussian function of the form
p(x|µk,Σk) =
1 (2π)d/2|Σ
k|1/2
exp{−1
2(x−µk)
TΣ−1
k (x−µk)}. (3.3)
Note that the Gaussian mixture model is completely parametrized by its mean vectors, covari-ance matrices and mixture weights from all component densities [50].
Given that (3.1) and (3.2) represent a convex combination of K distributions [47], it can be stated that
αk ≥0, fork∈ {1, . . . , K}, and K
X
k=1
αk= 1.
(3.4)
In addition, since eachpk(x|θk) defines a pdf, p(x|Θ) will also be a pdf [47].
One straightforward interpretation of mixture models is that (3.1) describes a complete stochas-tic model [51], thus giving us a recipe to generate new data points. Another point of view, in the mixture model context, is that any observed data sample is generated from a combination of K distinct random processes, each one modeled by the density pk(x|θk), withαk defining the
proportion of a particular random process in the overall observations.
3.2.1 Estimation of Parametric Mixture Models
LetX∈RN×Lbe a set ofN unlabeled observations, wherexikis the value of theithobservation for the kth component. Since the observed set Xis iid, the joint pdf for Xcan be written as [52]
p(X|Θ) =
N Y i=1
p(xi|θ1, . . . , θk). (3.5)
The likelihood function of the data, also assuming that xi are independently distributed, is
defined as
p(X|Θ) =L(Θ|X) =
N Y
i=1
K X
k=1
αkpk(xi|θk). (3.6)
The likelihood can be thought of as a function of the parameters Θ where the observed data X is fixed. In the maximum likelihood problem, our goal is to find the Θ that maximizesL(Θ|X), thus determining which parameters values are more likely for the observed values [53]:
Θ∗ = arg max
Θ∈Ω
L(Θ|X). (3.7)
In general cases, it is often preferable to maximize log(L(Θ|X) instead, since it is analytically easier [53]. However, in many scenarios an analytical solution is not possible to develop. One alternative is to maximize the likelihood in an EM approach.
3.2.2 Expectation Maximization Algorithm
The EM algorithm is an iterative method for estimating the maximum likelihood of a stochastic model where exists a dependency upon latent, or unobserved, data [54].
Throughout the remainder of this subsection, the EM algorithm is used to obtain an accurate approximation of the maximum likelihood of a mixture model which hasincompletedata associated with it. This consideration is taken into account when optimizing the likelihood function is analytically intractable, but the likelihood function can be simplified by assuming the existence of additional but missing values [53].
Therefore, letX be a random incomplete observed data set,Y be a random unobserved data set and Z = (X,Y) be acomplete data set.
The EM algorithm aims to maximize the incomplete data log-likelihood [54], log[L(Θ|X)] = log[g(x|Θ)] for Θ∈Ω,
by using p(x,y|Θ) andg(x|Θ). From Bayes’ rule, p(z|Θ) can be represented as
p(z|Θ) =p(x,y|Θ) =k(y|x,Θ)·g(x|Θ), (3.8) for x∈X and y∈Y.
The E-step of the EM algorithm seeks to find the expected value of the complete data log-likelihood, defined as
log[L(Θ|X,Y)] = log[p(x,y|Θ)]. (3.9)
In (3.9), the observed samplesX and somea priori parameter estimate Θp ∈Ω are given as inputs. In addition, an auxiliary function Qis defined such as
Q(Θ|Θp) =E[log[p(x,y|Θ)|x,Θp]], (3.10) where x∈X,y∈Y, Θp ∈Ω andE[·] denotes the expectation operator. The key thing in (3.10) is that X and Θp are constants, Θ is a regular variable which we want to optimize and Y is a random variable governed by the distribution k(y|x,Θ).
The M-step of the EM algorithm intents to maximize (3.10) by selecting a new set of parameters Θ∗ ∈Ω such that
Θ∗ ∈arg max
Θ∈Ω
Q(Θ|Θp). (3.11)
The EM algorithm presented in [54] can abstractly be summarized as follows:
1. E-Step: Calculate Q(Θ|Θp).
2. M-Step: Pick Θ∗∈arg max
Θ∈ΩQ(Θ|Θp).
3. Θp ←Θ∗.
4. Iterate (1)-(3) until some convergence criterion is met.
3.3
GAUSSIAN PROCESS FOR REGRESSION
Gaussian processes belong to the family of stochastic processes schemes that can be used for modeling dependent data observed over time and/or space [25]. Our main interest relies on supervised learning, which can be characterized by a function that maps the input-output relationship learned from empirical data,i.e. a training data set.
In order to make predictions based on a finite data set, a functionhneeds to link the known sets of the training data with all the other possible sets of input-output values. The characteristics of this underlying functionhcan be defined in a wide variety of ways [57], and that is where Gaussian processes are applied. Stochastic processes, as the Gaussian process, dictate the properties of the underlying function as well as probability distributions govern the properties of a random variable [25].
Two properties make Gaussian processes an interesting tool for inference. First, a Gaussian process is completely determined by its mean and covariance functions, requiring only the first and second order moments to be specified, which makes it a non parametric model whose structure is fixed and completely known. Second, the predictor of a Gaussian process is based on a conditional probability and can be solved with simple linear algebra, as shown in [58].
3.3.1 Multivariate Gaussian Distribution
Consider a multivariate random variablex∈Rn. Ifxhas a multivariate Gaussian distribution with mean vector µ∈Rn and covariance matrix Σ∈Sn++, where Sn++ is the space of symmetric positive definite n×nmatrices2, the pdf ofx has the form [58]:
f(x) = 1
(2π)n/2|Σ|exp
h
−1
2(x−µ)
TΣ−1(x−
µ)
i
, (3.12)
where |Σ|is the determinant of Σ.
To denote a random variable to be Gaussian distributed we write:
x∼ N(µ,Σ). (3.13)
Now, consider that the random vectorx∈Rn, withx∼ N(µ,Σ), is partitioned into two sets xA and xB, such that:
xA = [x1, x2,· · · , xr]T ∈Rr,
xB = [xr+1, xr+2,· · · , xn]T ∈Rn−r.
(3.14)
2In some cases,Σcan be positive semidefinite but not positive definite, such as the case whereΣis not full rank.
Similarly, the mean vector µ and the covariance matrix Σ can also be partitioned into two sets, resulting in:
x=
xA
xB
, µ=
µA
µB
, Σ=
ΣAA ΣAB
ΣBA ΣBB
, (3.15)
where ΣAA = var(xA),ΣBB= var(xB) and ΣAB = (ΣAB)T = cov(xA,xB).
In Subsections 3.3.1, 3.3.1 and 3.3.1 some useful properties for (3.15) are proven.
Marginalization
Given the marginal density function ofxA andxB,
f(xA) = Z
xB
f(x)dxB,
f(xB) = Z
xA
f(x)dxA,
(3.16)
it can be stated that the densities in (3.16) are Gaussian distributed [58]. Therefore, it is possible to write:
xA∼ N(µA,ΣAA),
xB ∼ N(µB,ΣBB).
(3.17)
Conditioning
Given the conditional density function ofxA|xB and xB|xA,
f(xA|xB) =
f(x) f(xB)
,
f(xB|xA) =
f(x) f(xA)
;
(3.18)
their conditional densities in (3.18) are also Gaussian distributed [58], which leads to: xA|xB ∼ N(µA|B,ΣA|B),
xB|xA∼ N(µB|A,ΣB|A);
(3.19)
where
µA|B=µA+ΣBAΣ−AA1(xB−µB), µB|A=µB+ΣABΣ−BB1(xA−µA),
ΣA|B =ΣAA−ΣABΣ−BB1ΣBA,
ΣB|A=ΣBB−ΣBAΣ−AA1ΣAB.
Summation
The sum of independent multivariate Gaussian random variables with the same dimensionality results in another multivariate Gaussian random variable [58]. As an example, let y∼ N(µ,Σ) and z∼ N(µ′,Σ′). The sum ofyand z, provided they are independent, can be stated as:
y+z∼ N(µ+µ′,Σ+Σ′). (3.21)
3.3.2 Gaussian Processes
Multivariate Gaussian distributions are useful for modeling finite collections of real-valued random variables due to their analytical properties showed in Subsection 3.3.1. Gaussian processes extend this scenario, evolving from distributions over random vectors to distributions over random functions.
A stochastic process is a collection of random variables, e.g. {h(x) : x ∈ X }, defined on a certain probability space and indexed by elements from some set [59]. Just as a random variable assigns a real number to every outcome of a random experiment, a stochastic process assigns a sample function to every outcome of a random experiment [59].
A Gaussian process is a stochastic process where any finite subcollection of random variables has a multivariate Gaussian distribution. In other words, a collection of random variables {h(x) : x ∈ X } is a Gaussian process with mean function m(·) and covariance function k(·,·) if, for any finite set of elements {x1, x2, . . . , xn ∈ X }, the associated finite set of random variables
{h(x1), h(x2), . . . , h(xn)} have a distribution of the form:
h(x) =
h(x1)
h(x2)
.. . h(xn)
∼ N
m(x1)
m(x2)
.. . m(xn)
,
k(x1, x1) · · · k(x1, xn)
k(x2, x1) · · · k(x2, xn)
..
. . .. ...
k(xn, x1) · · · k(xn, xn) . (3.22)
The notation for definingh(x) as a Gaussian process is
h(x)∼ GP(m(x), k(x,x′)), (3.23)
for any x and x′∈ X. The mean and covariance functions are given, respectively, by:
m(x) =E[x],
k(x,x′) =E[(x−m(x))(x′−m(x′))];
(3.24)


![Figure 4.3: Example of a concept map for an audit trail. Adapted from [14].](https://thumb-eu.123doks.com/thumbv2/123dok_br/16759193.747124/51.892.102.795.143.991/figure-example-concept-map-audit-trail-adapted.webp)
![Fig 4.2 shows the architecture of the current BI system of SPU. Please refer to [69] for more details on the existing BI architecture.](https://thumb-eu.123doks.com/thumbv2/123dok_br/16759193.747124/52.892.101.797.465.828/fig-shows-architecture-current-refer-details-existing-architecture.webp)

